| Param | Original file | Final file |
|---|---|---|
| Filename | modeM0/AS1T03_004T01_9000002532_17051cztM0_level2.evt | modeM0/AS1T03_004T01_9000002532_17051cztM0_level2_quad_clean.evt |
| Size (bytes) | 500,160,960 | 57,600,000 |
| Size | 477.0 MB | 54.9 MB |
| Events in quadrant A | 3,126,840 | 339,078 |
| Events in quadrant B | 3,132,321 | 350,766 |
| Events in quadrant C | 5,060,096 | 318,241 |
| Events in quadrant D | 3,423,666 | 318,706 |
| Mode SS | |||
|---|---|---|---|
| Quadrant | BADHDUFLAG | Total packets | Discarded packets |
| A | 0 | 122 | 0 |
| B | 0 | 122 | 0 |
| C | 0 | 122 | 0 |
| D | 0 | 122 | 0 |
| Mode M9 | |||
|---|---|---|---|
| Quadrant | BADHDUFLAG | Total packets | Discarded packets |
| A | 0 | 13 | 0 |
| B | 0 | 13 | 0 |
| C | 0 | 13 | 0 |
| D | 0 | 13 | 0 |
| Mode M0 | |||
|---|---|---|---|
| Quadrant | BADHDUFLAG | Total packets | Discarded packets |
| A | 0 | 12765 | 1 |
| B | 0 | 12707 | 1 |
| C | 0 | 19347 | 4 |
| D | 0 | 14058 | 1 |
| Quadrant | Total seconds | Saturated seconds | Saturation percentage |
|---|---|---|---|
| A | 5965 | 31 | 0.519698% |
| B | 5966 | 46 | 0.771036% |
| C | 5965 | 301 | 5.046102% |
| D | 5965 | 92 | 1.542330% |
Noise dominated data is calculated using 1-second bins in cleaned event files. If a bin has >2000 counts, and if more than 50% of those come from <1% of pixels, then it is considered to be noise-dominated and hence unusable.
| Quadrant | # 1 sec bins | Bins with >0 counts | Bins with >2000 counts | High rate bins dominated by noise | Noise dominated (total time) | Noise dominated (detector-on time) | Marked lightcurve |
|---|---|---|---|---|---|---|---|
| A | 7346 | 5967 | 6 | 6 | 0.08% | 0.10% | 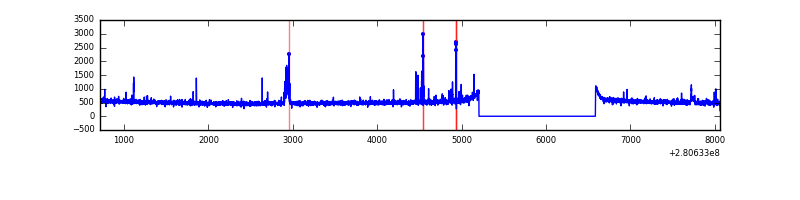 |
| B | 7347 | 5968 | 1 | 1 | 0.01% | 0.02% | 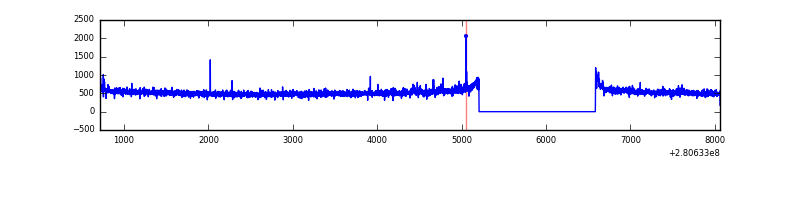 |
| C | 7346 | 5967 | 2 | 2 | 0.03% | 0.03% | 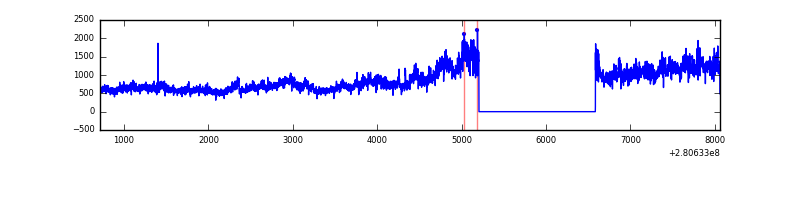 |
| D | 7346 | 5967 | 55 | 55 | 0.75% | 0.92% | 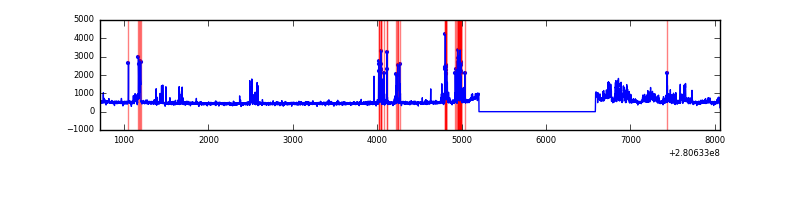 |
Top three noisy pixels from each quadrant. If the there are fewer than three noisy pixels in the level2.evt file, extra rows are filled as -1
| Pixel properties | Quadrant properties | ||||||
|---|---|---|---|---|---|---|---|
| Quadrant | DetID | PixID | Counts | Sigma | Mean | Median | Sigma |
| A | 4 | 2 | 101577 | 644.8 | 783 | 769 | 156.3 |
| A | 15 | 174 | 11483 | 68.53 | 783 | 769 | 156.3 |
| A | 0 | 226 | 6978 | 39.72 | 783 | 769 | 156.3 |
| B | 0 | 219 | 17582 | 114.52 | 789 | 772 | 146.8 |
| B | 12 | 111 | 16746 | 108.82 | 789 | 772 | 146.8 |
| B | 11 | 111 | 14424 | 93.0 | 789 | 772 | 146.8 |
| C | 3 | 233 | 2058574 | 12020.2 | 738 | 746 | 171.2 |
| C | 14 | 238 | 115705 | 671.5 | 738 | 746 | 171.2 |
| C | 9 | 160 | 5925 | 30.25 | 738 | 746 | 171.2 |
| D | 5 | 222 | 490663 | 2706.52 | 747 | 726 | 181.0 |
| D | 10 | 70 | 76237 | 417.14 | 747 | 726 | 181.0 |
| D | 2 | 234 | 21116 | 112.64 | 747 | 726 | 181.0 |
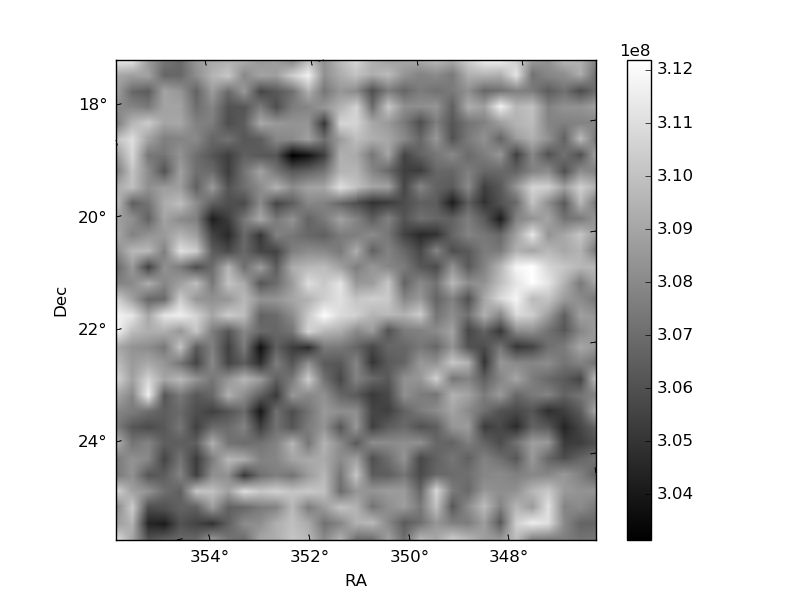
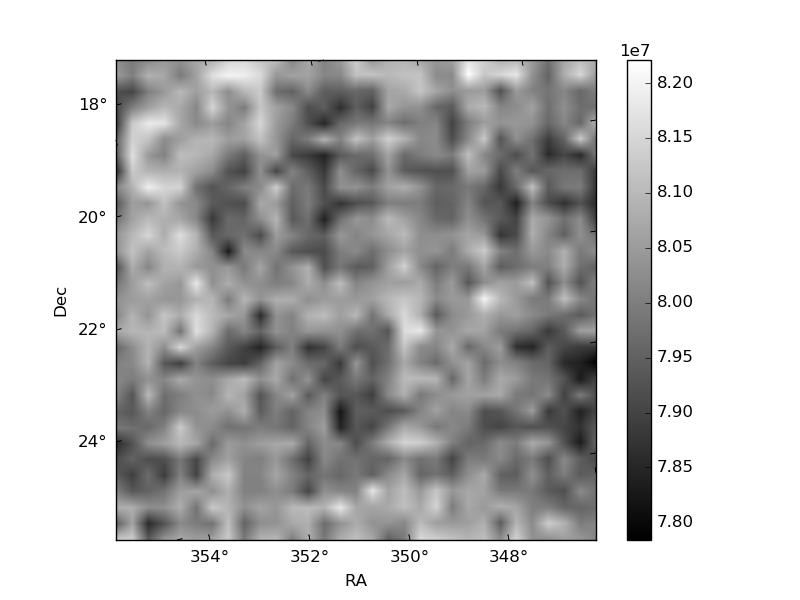
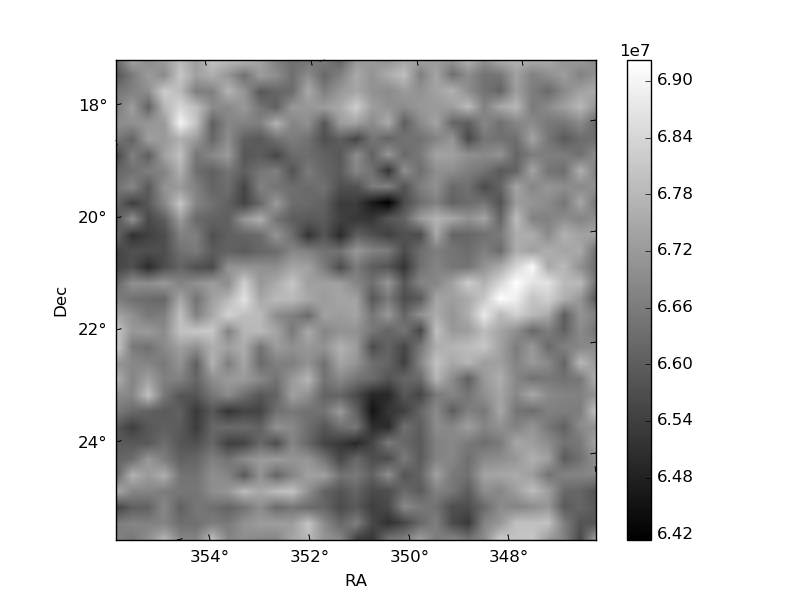
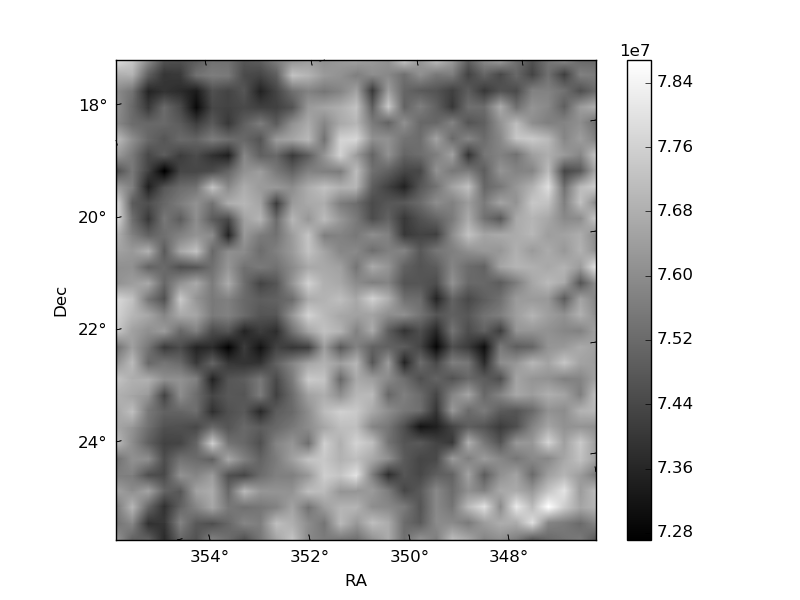
Histogram calculated using DETX and DETY for each event in the final _common_clean file
| Quadrant A | 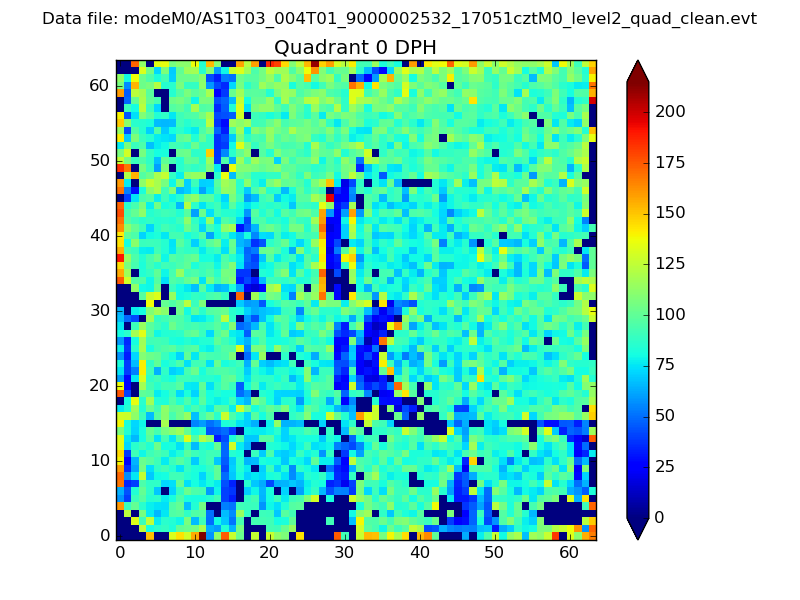 |
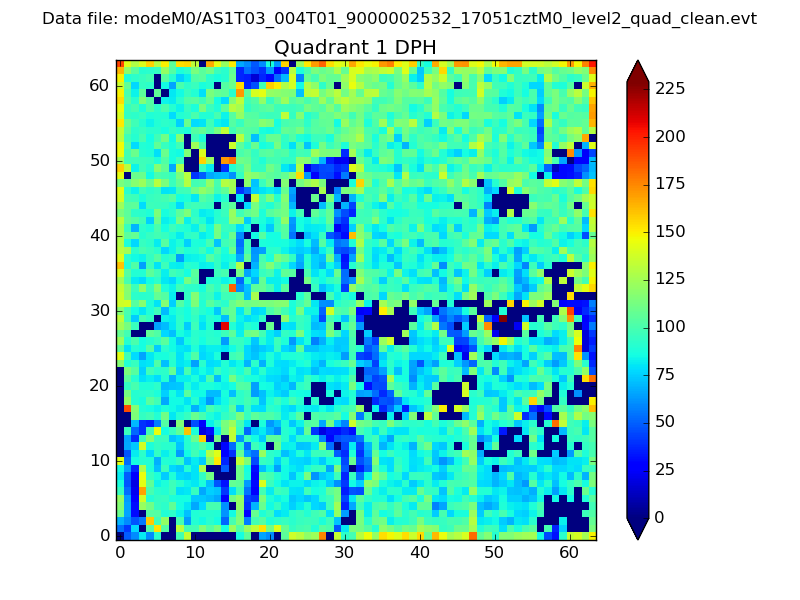 |
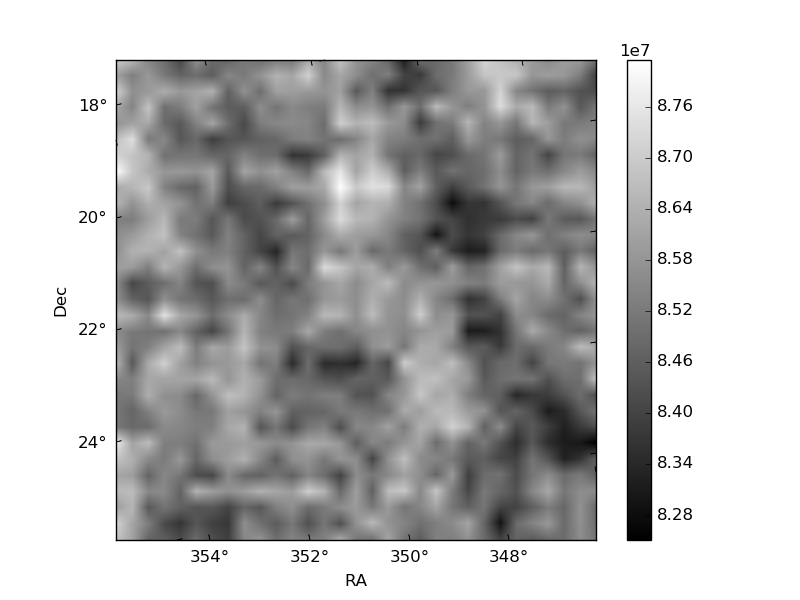
Quadrant B |
|---|---|---|---|
| Quadrant D | 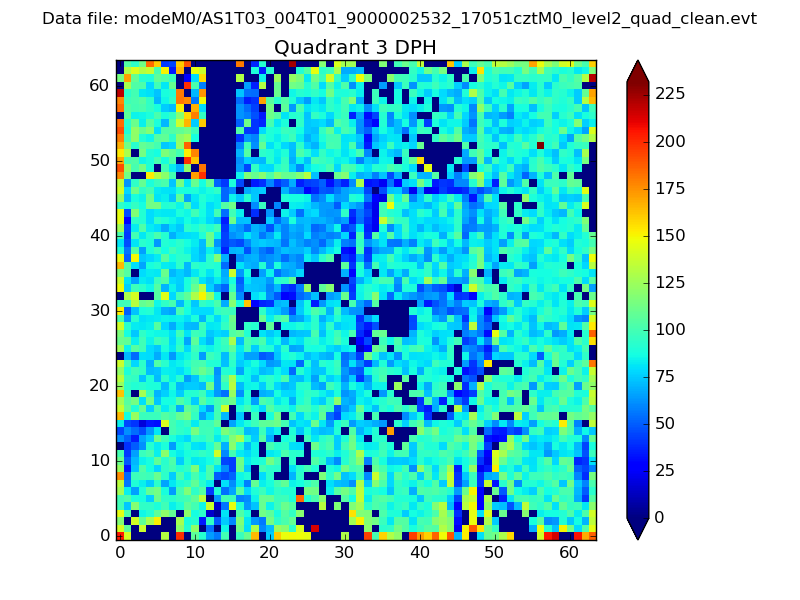 |
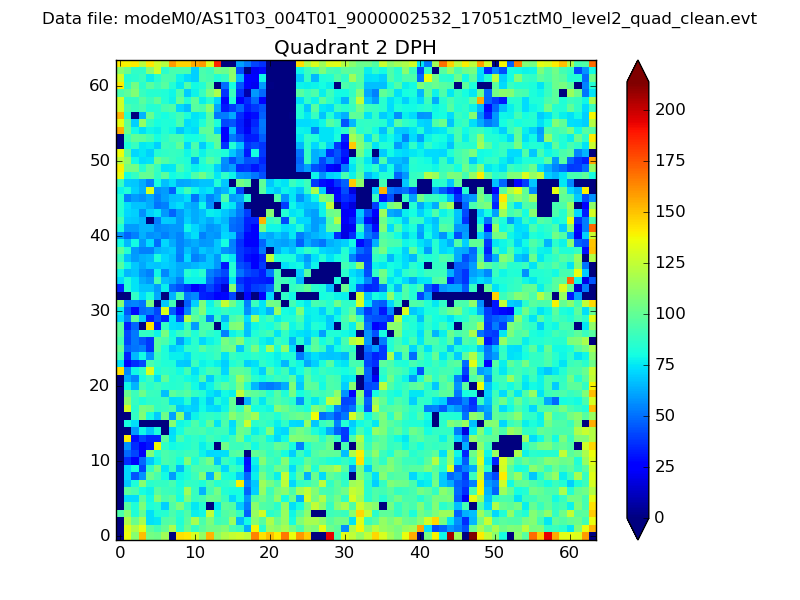 |
Quadrant C |
| Plot type | Count rate plots | Images |
|---|---|---|
| Comparison with Poisson distribution Blue bars denote a histogram of data divided into 1 sec bins. Red curve is a Poisson curve with rate = median count rate of data. |
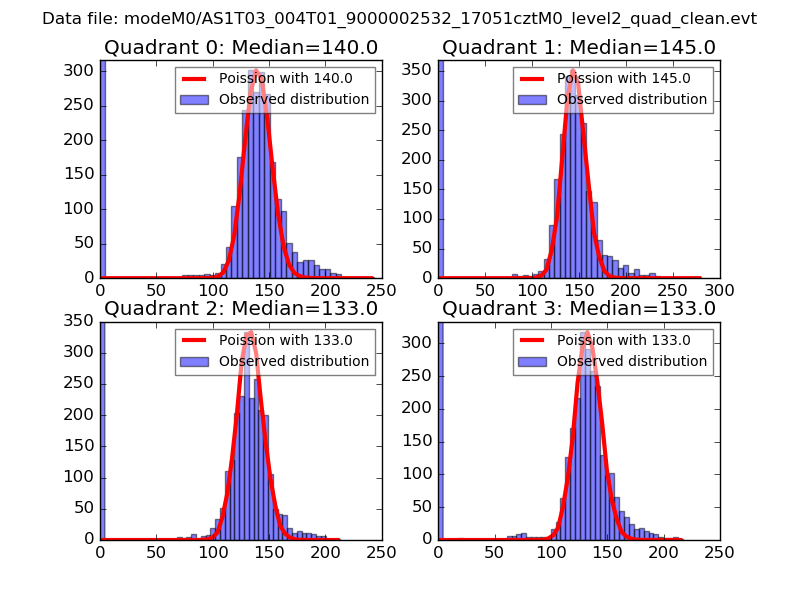 |
 |
| Quadrant-wise count rates Data is divided into 100 sec bins |
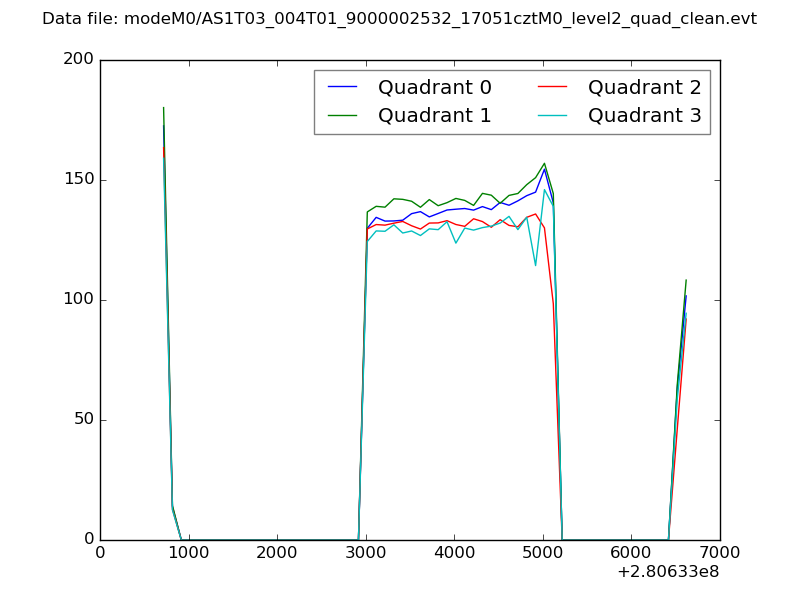 |
|
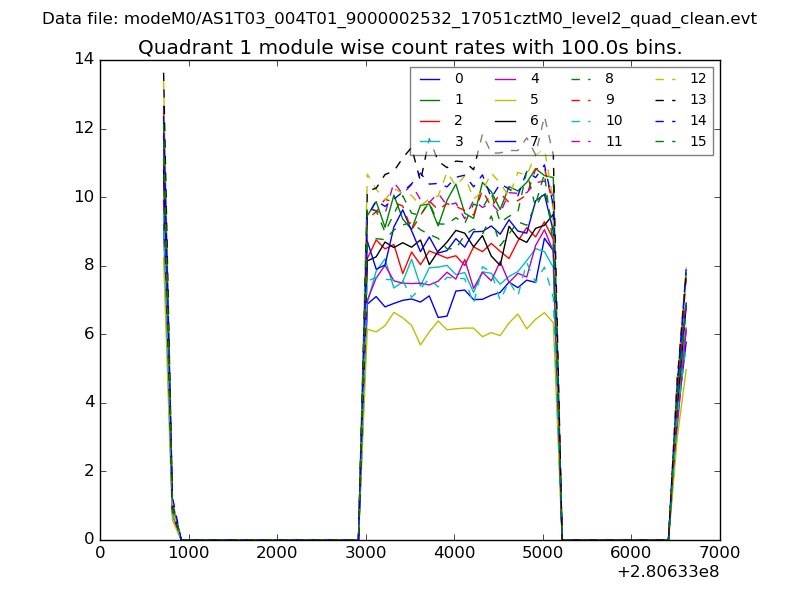
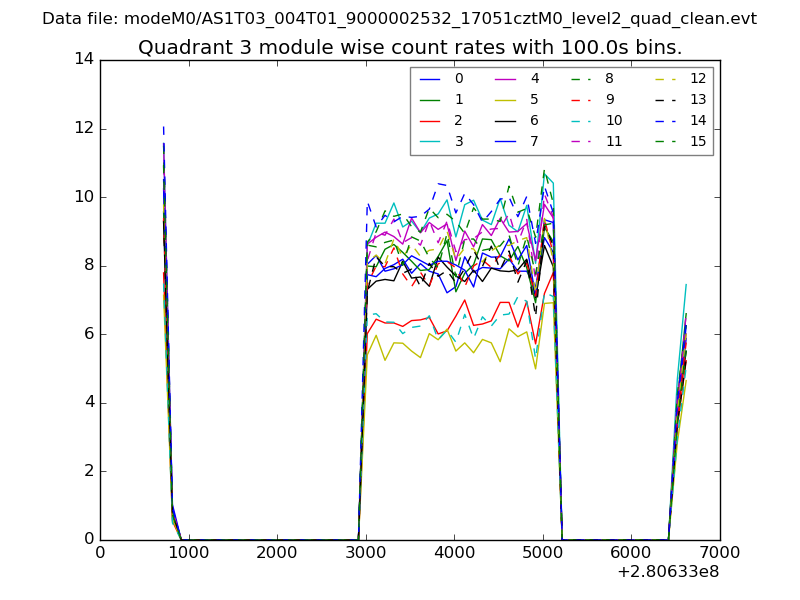
| Module-wise count rates for Quadrant A Data is divided into 100 sec bins |
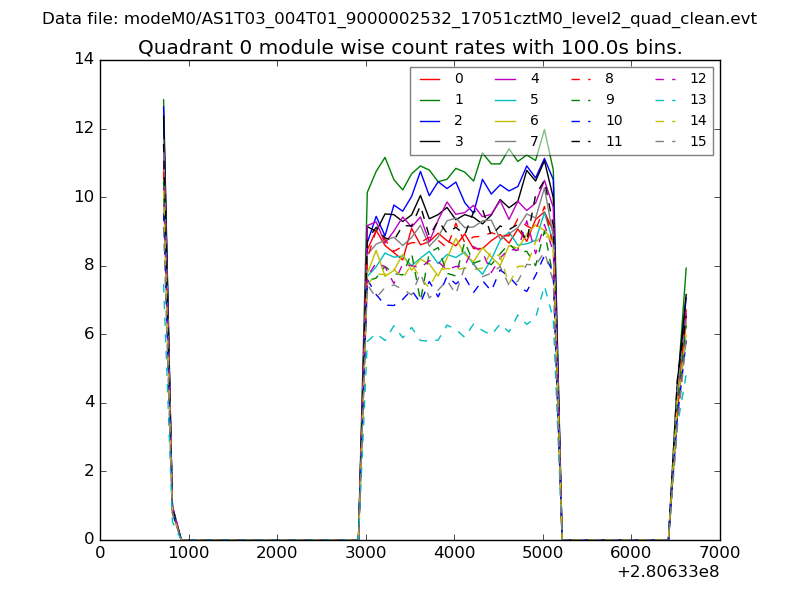 |
 |
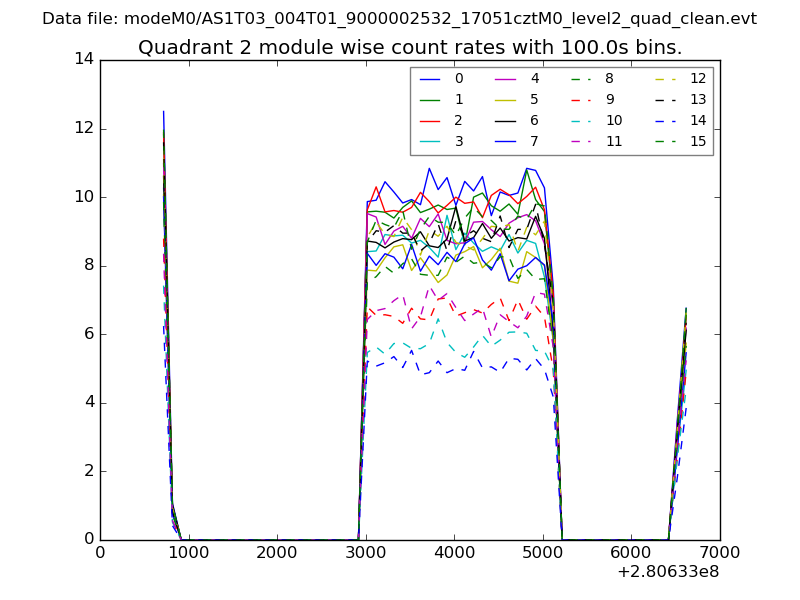
| Module-wise count rates for Quadrant B Data is divided into 100 sec bins |
 |
 |
| Module-wise count rates for Quadrant C Data is divided into 100 sec bins |
 |
 |
| Module-wise count rates for Quadrant D Data is divided into 100 sec bins |
 |
 |
| Parameter | Plot |
|---|---|
| CZT HV Monitor | 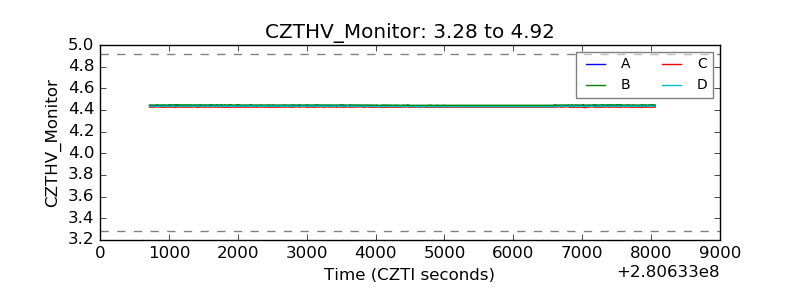 |
| D_VDD | 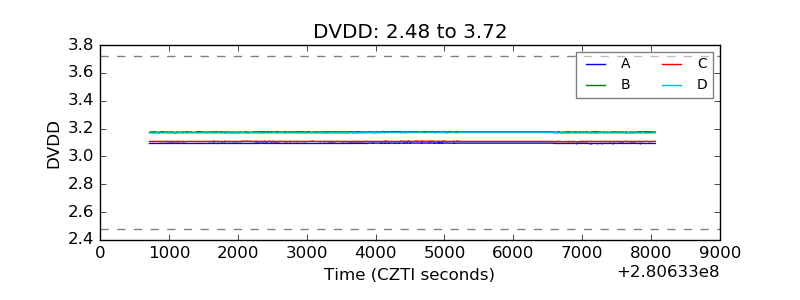 |
| Temperature 1 | 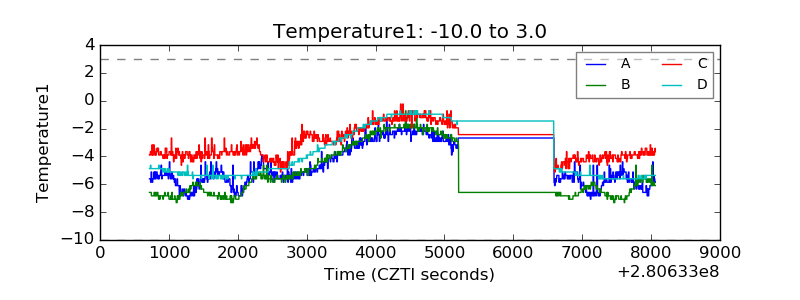 |
| Veto HV Monitor | 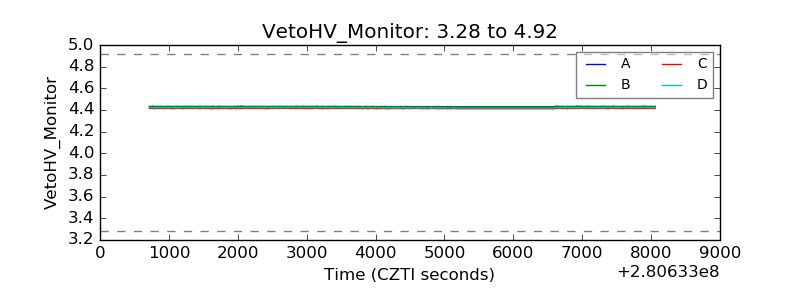 |
| Veto LLD | 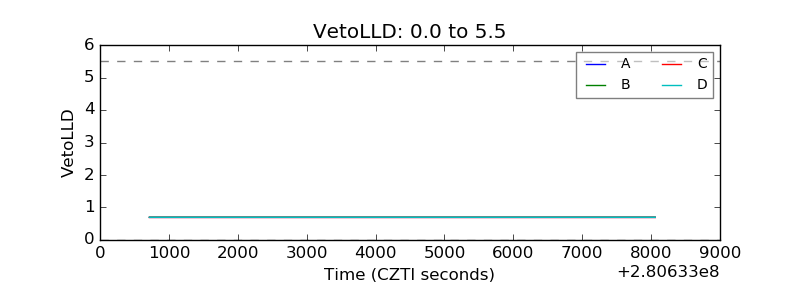 |
| Alpha Counter | 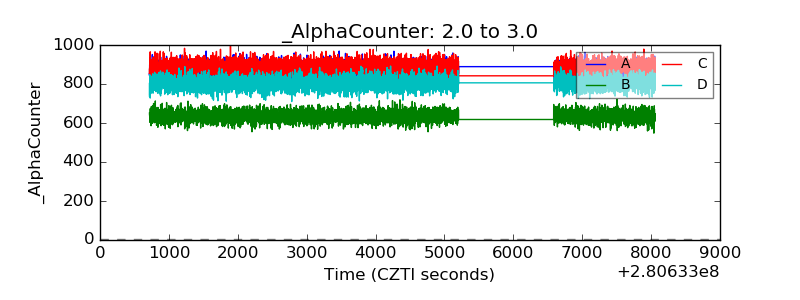 |
| _CPM_Rate | 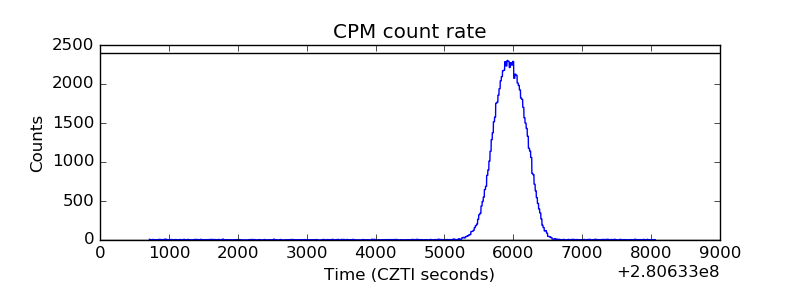 |
| CZT Counter | 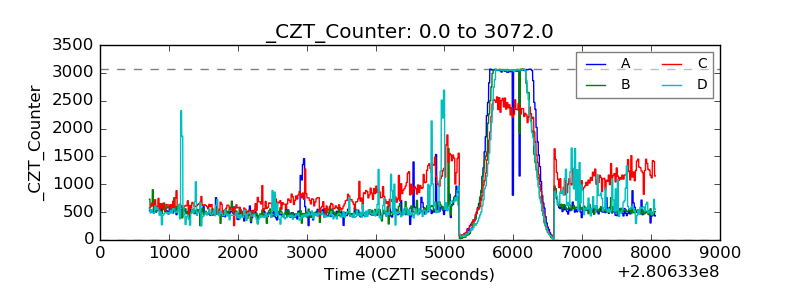 |
| +2.5 Volts monitor |  |
| +5 Volts monitor |  |
| _ROLL_ROT | 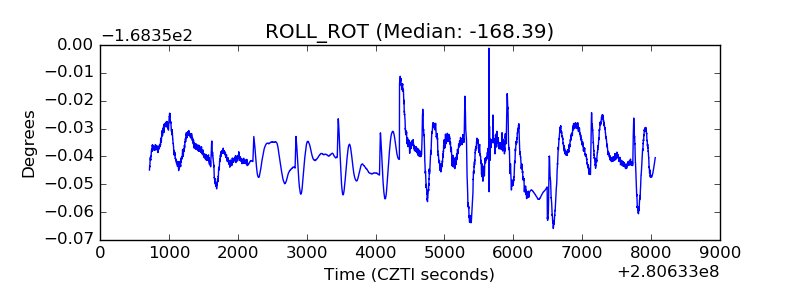 |
| _Roll_DEC | 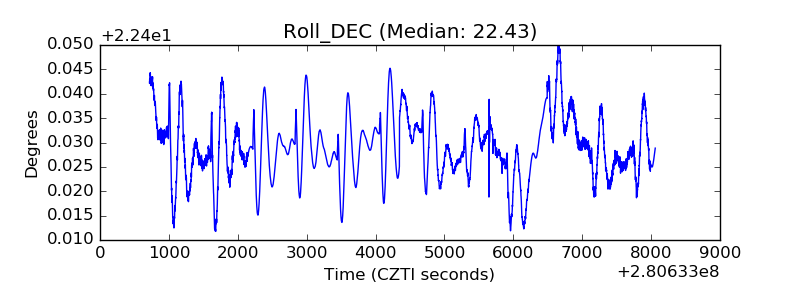 |
| _Roll_RA | 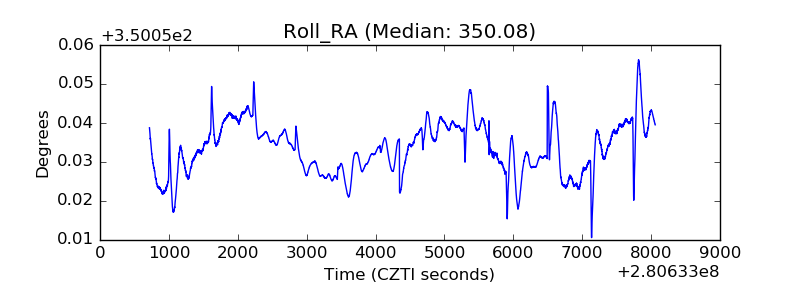 |
| Veto Counter | 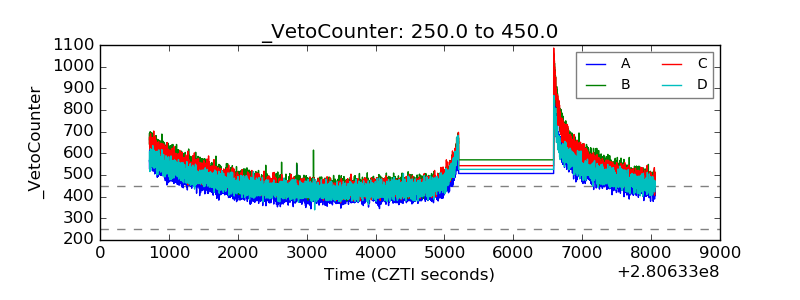 |