| Param | Original file | Final file |
|---|---|---|
| Filename | modeM0/AS1T03_004T01_9000002532_17052cztM0_level2.evt | modeM0/AS1T03_004T01_9000002532_17052cztM0_level2_quad_clean.evt |
| Size (bytes) | 591,318,720 | 64,264,320 |
| Size | 563.9 MB | 61.3 MB |
| Events in quadrant A | 3,407,027 | 383,737 |
| Events in quadrant B | 3,499,841 | 394,629 |
| Events in quadrant C | 6,920,567 | 357,501 |
| Events in quadrant D | 3,649,303 | 364,504 |
| Mode SS | |||
|---|---|---|---|
| Quadrant | BADHDUFLAG | Total packets | Discarded packets |
| A | 0 | 130 | 0 |
| B | 0 | 130 | 0 |
| C | 0 | 130 | 0 |
| D | 0 | 130 | 0 |
| Mode M9 | |||
|---|---|---|---|
| Quadrant | BADHDUFLAG | Total packets | Discarded packets |
| A | 0 | 15 | 0 |
| B | 0 | 16 | 0 |
| C | 0 | 16 | 0 |
| D | 0 | 16 | 0 |
| Mode M0 | |||
|---|---|---|---|
| Quadrant | BADHDUFLAG | Total packets | Discarded packets |
| A | 0 | 13879 | 2 |
| B | 0 | 14216 | 2 |
| C | 0 | 25135 | 2 |
| D | 0 | 14966 | 2 |
| Quadrant | Total seconds | Saturated seconds | Saturation percentage |
|---|---|---|---|
| A | 6380 | 80 | 1.253918% |
| B | 6380 | 100 | 1.567398% |
| C | 6380 | 415 | 6.504702% |
| D | 6380 | 57 | 0.893417% |
Noise dominated data is calculated using 1-second bins in cleaned event files. If a bin has >2000 counts, and if more than 50% of those come from <1% of pixels, then it is considered to be noise-dominated and hence unusable.
| Quadrant | # 1 sec bins | Bins with >0 counts | Bins with >2000 counts | High rate bins dominated by noise | Noise dominated (total time) | Noise dominated (detector-on time) | Marked lightcurve |
|---|---|---|---|---|---|---|---|
| A | 7661 | 6383 | 9 | 9 | 0.12% | 0.14% | 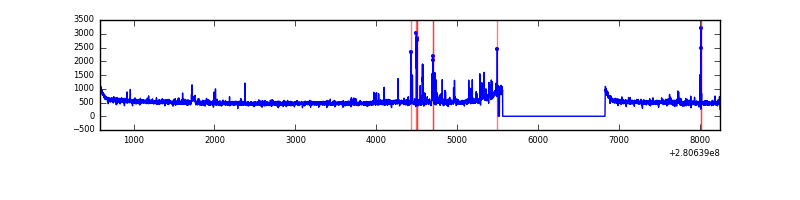 |
| B | 7661 | 6383 | 9 | 9 | 0.12% | 0.14% | 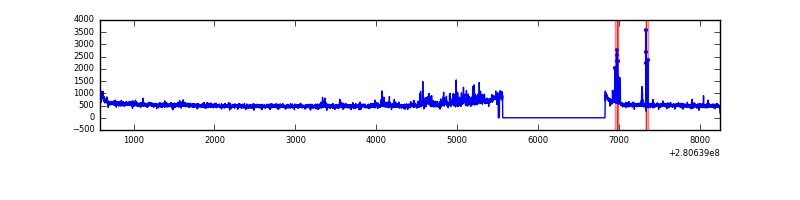 |
| C | 7661 | 6383 | 5 | 5 | 0.07% | 0.08% | 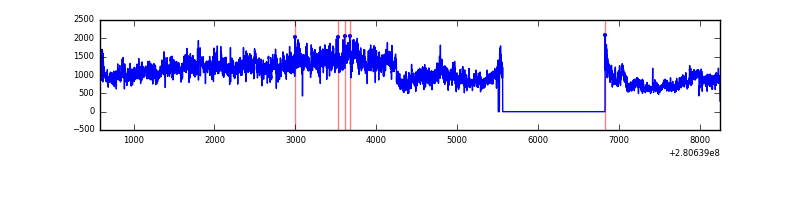 |
| D | 7661 | 6383 | 21 | 21 | 0.27% | 0.33% | 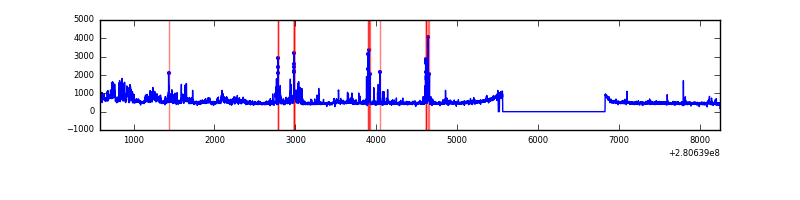 |
Top three noisy pixels from each quadrant. If the there are fewer than three noisy pixels in the level2.evt file, extra rows are filled as -1
| Pixel properties | Quadrant properties | ||||||
|---|---|---|---|---|---|---|---|
| Quadrant | DetID | PixID | Counts | Sigma | Mean | Median | Sigma |
| A | 4 | 2 | 127495 | 756.53 | 837 | 823 | 167.4 |
| A | 3 | 254 | 37318 | 217.96 | 837 | 823 | 167.4 |
| A | 12 | 189 | 16261 | 92.2 | 837 | 823 | 167.4 |
| B | 6 | 36 | 99790 | 626.39 | 842 | 825 | 158.0 |
| B | 3 | 64 | 67374 | 421.22 | 842 | 825 | 158.0 |
| B | 3 | 209 | 19185 | 116.21 | 842 | 825 | 158.0 |
| C | 3 | 233 | 3732367 | 20450.24 | 784 | 790 | 182.5 |
| C | 14 | 238 | 122456 | 666.77 | 784 | 790 | 182.5 |
| C | 9 | 160 | 6093 | 29.06 | 784 | 790 | 182.5 |
| D | 5 | 222 | 516376 | 2638.88 | 803 | 783 | 195.4 |
| D | 10 | 70 | 40290 | 202.2 | 803 | 783 | 195.4 |
| D | 2 | 234 | 23484 | 116.19 | 803 | 783 | 195.4 |
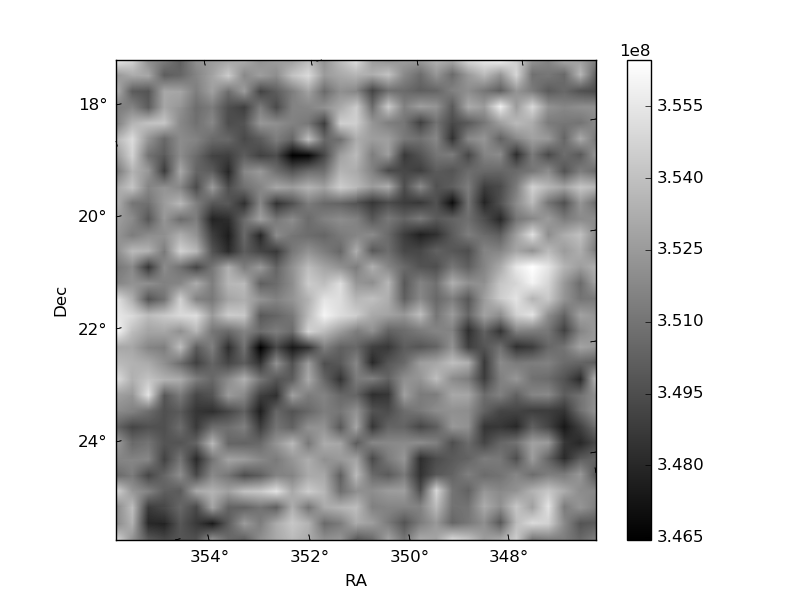
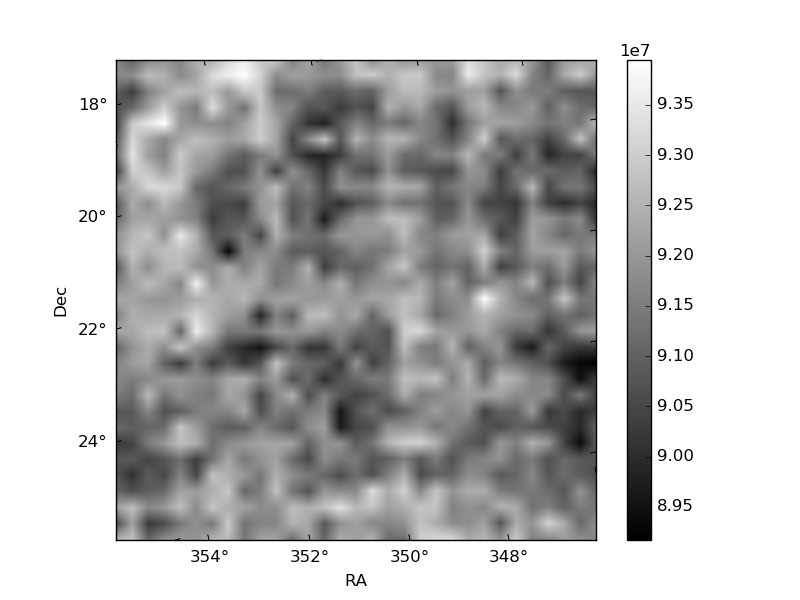
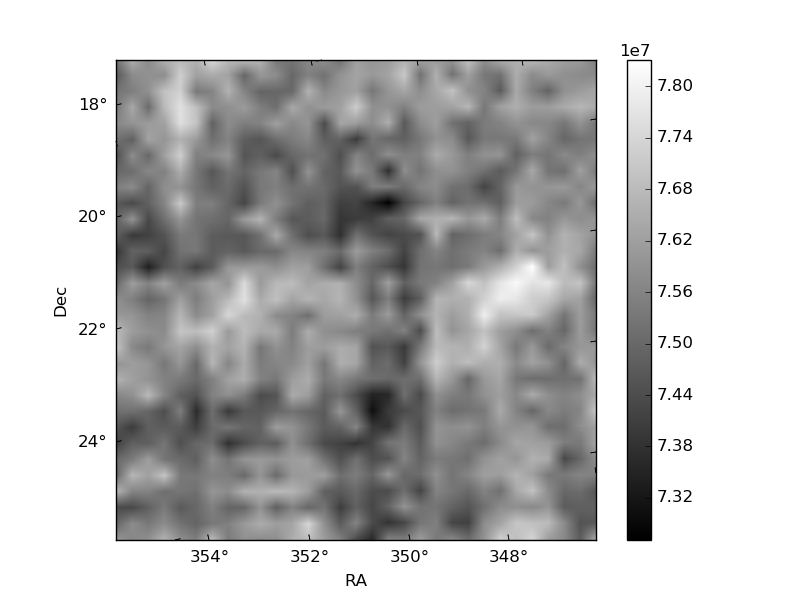
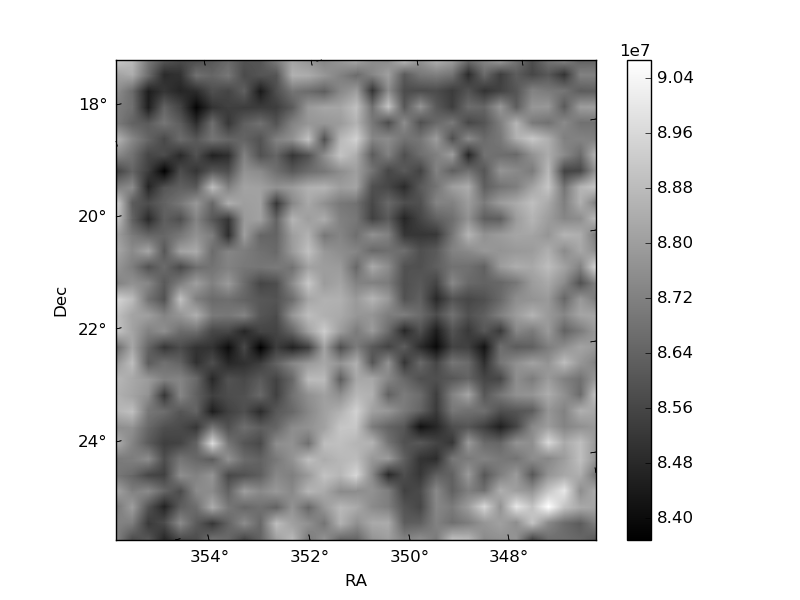
Histogram calculated using DETX and DETY for each event in the final _common_clean file
| Quadrant A | 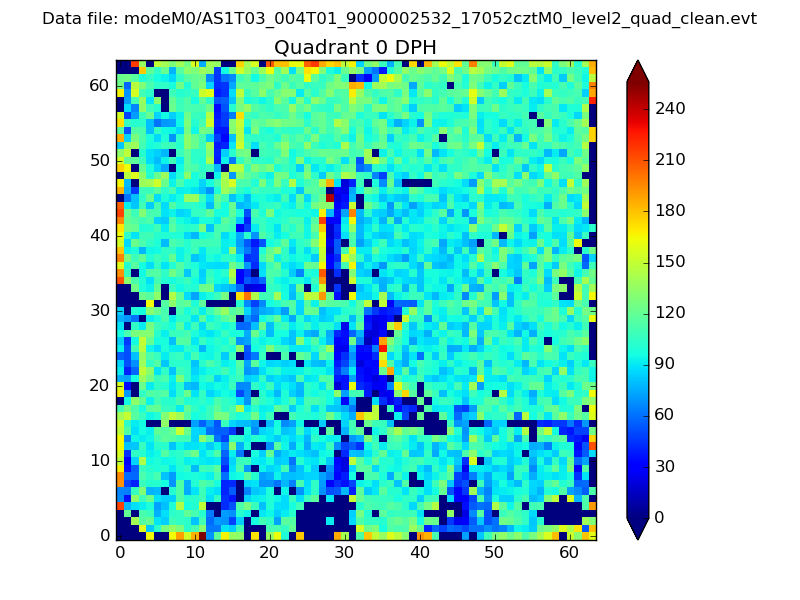 |
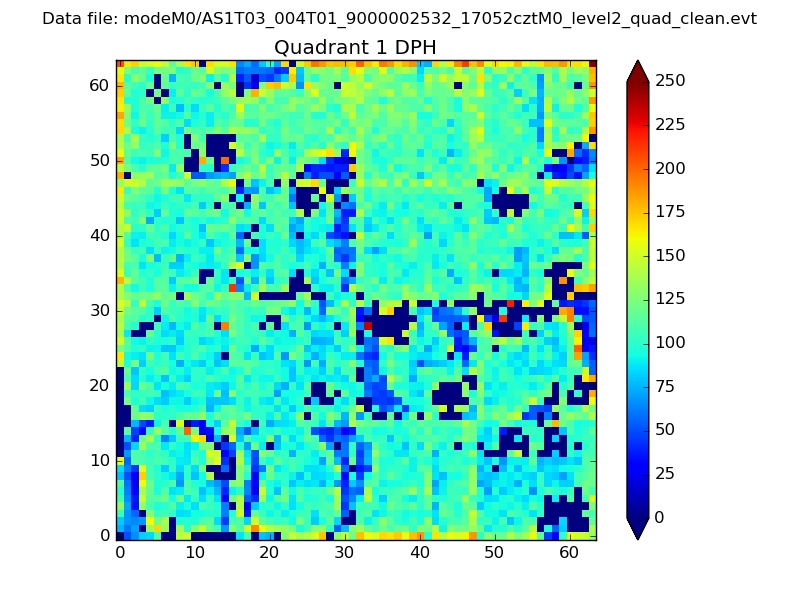 |
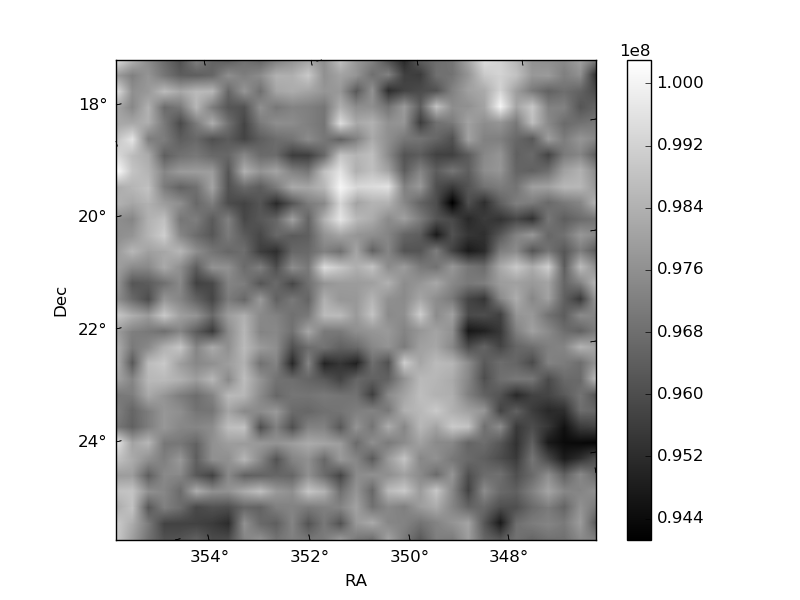
Quadrant B |
|---|---|---|---|
| Quadrant D | 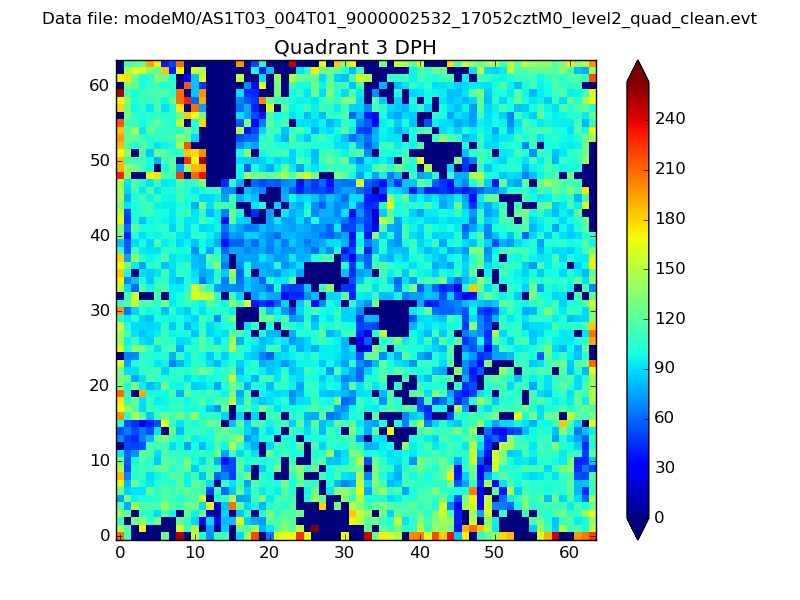 |
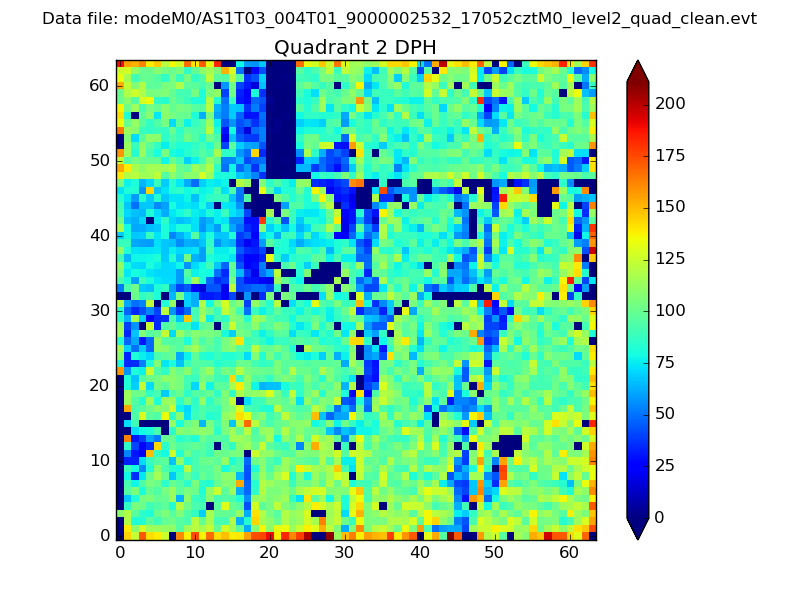 |
Quadrant C |
| Plot type | Count rate plots | Images |
|---|---|---|
| Comparison with Poisson distribution Blue bars denote a histogram of data divided into 1 sec bins. Red curve is a Poisson curve with rate = median count rate of data. |
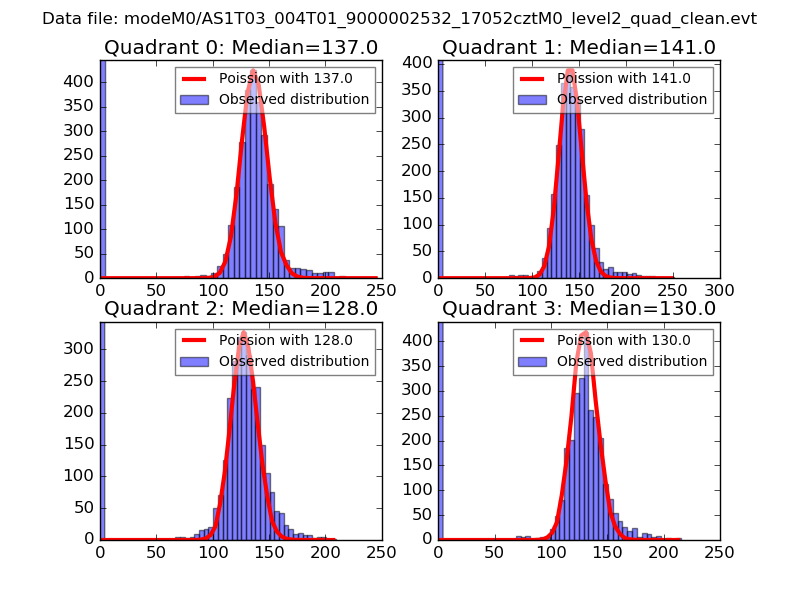 |
 |
| Quadrant-wise count rates Data is divided into 100 sec bins |
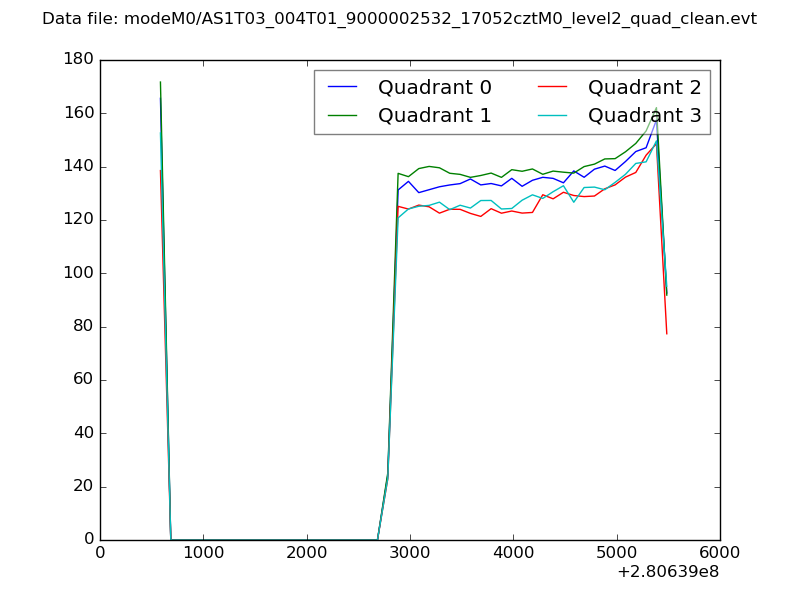 |
|
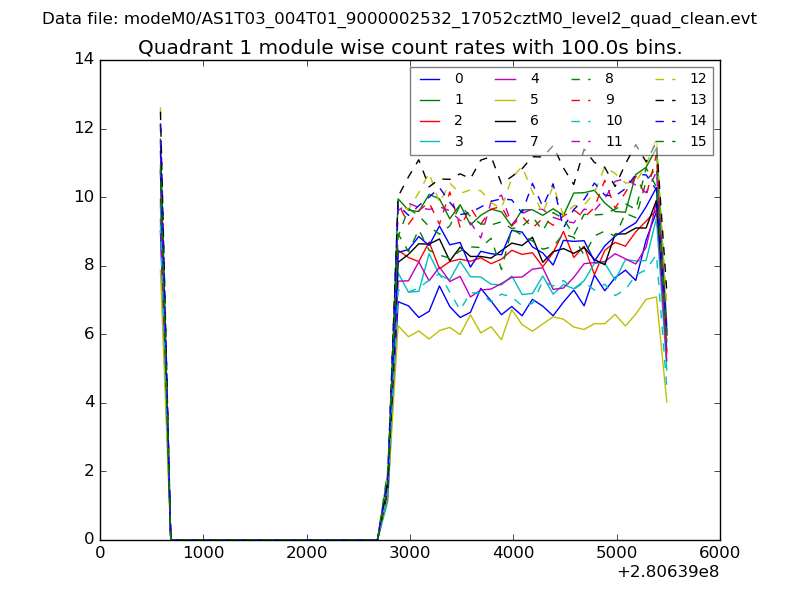
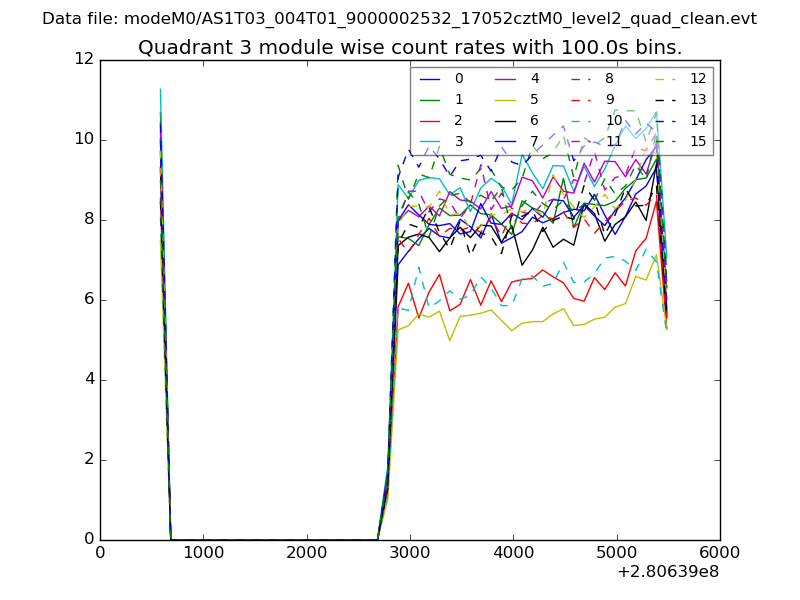
| Module-wise count rates for Quadrant A Data is divided into 100 sec bins |
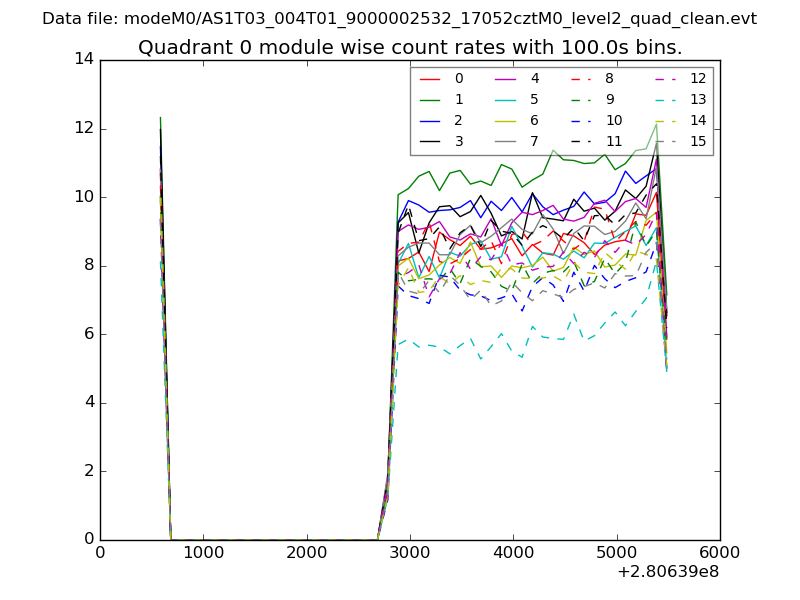 |
 |
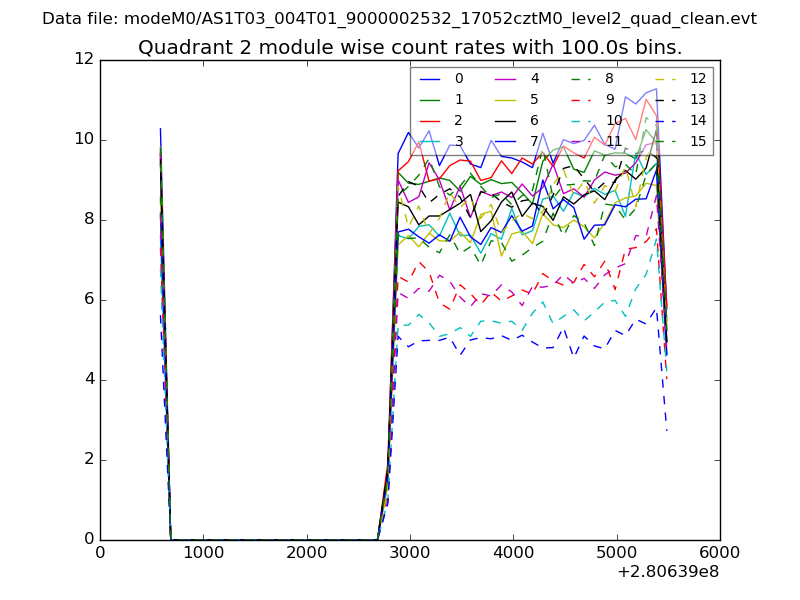
| Module-wise count rates for Quadrant B Data is divided into 100 sec bins |
 |
 |
| Module-wise count rates for Quadrant C Data is divided into 100 sec bins |
 |
 |
| Module-wise count rates for Quadrant D Data is divided into 100 sec bins |
 |
 |
| Parameter | Plot |
|---|---|
| CZT HV Monitor | 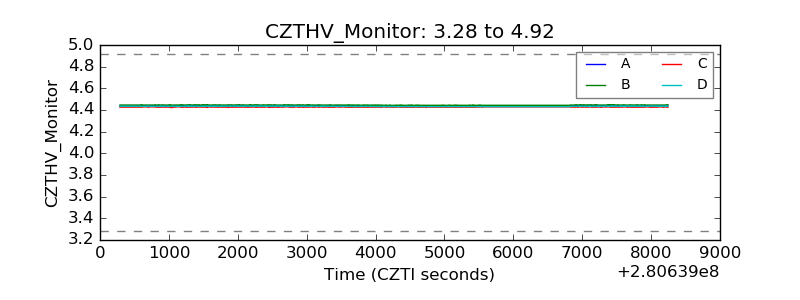 |
| D_VDD | 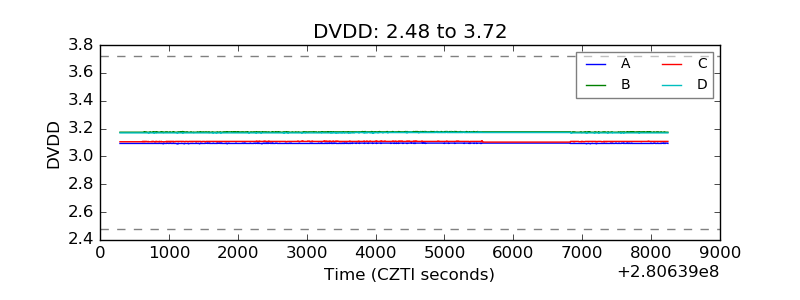 |
| Temperature 1 | 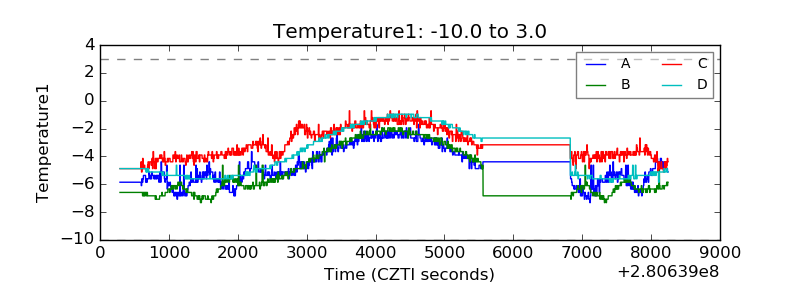 |
| Veto HV Monitor | 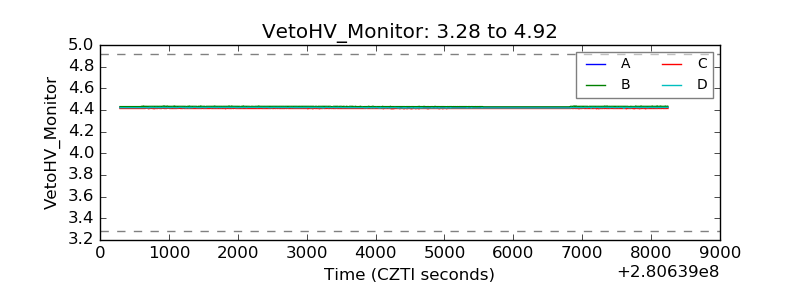 |
| Veto LLD | 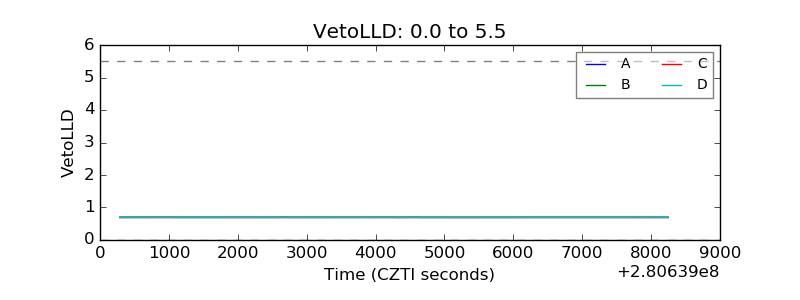 |
| Alpha Counter | 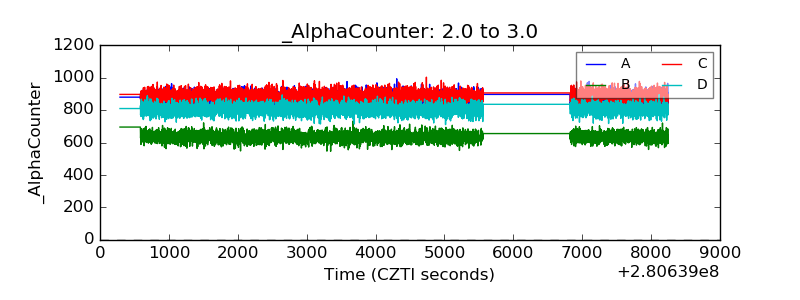 |
| _CPM_Rate | 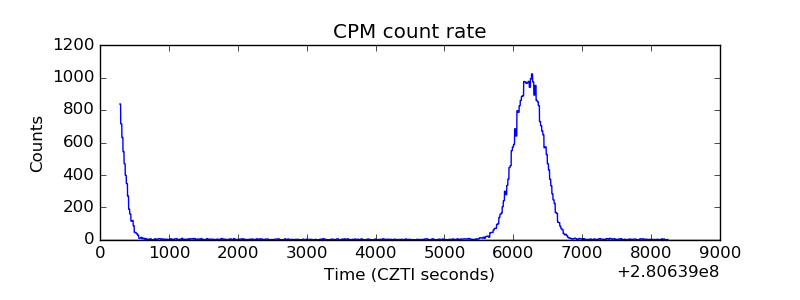 |
| CZT Counter | 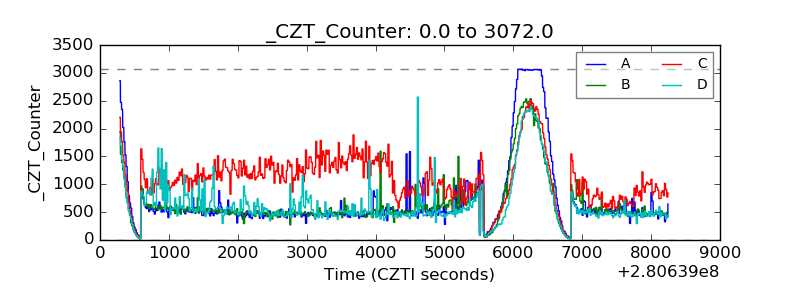 |
| +2.5 Volts monitor |  |
| +5 Volts monitor |  |
| _ROLL_ROT | 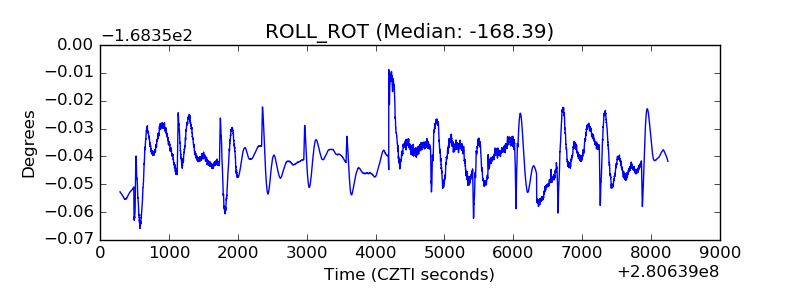 |
| _Roll_DEC |  |
| _Roll_RA | 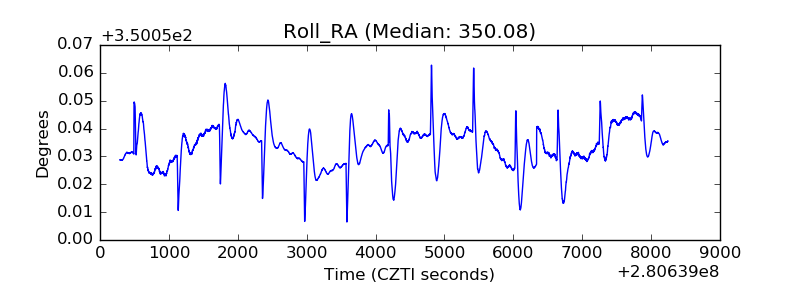 |
| Veto Counter | 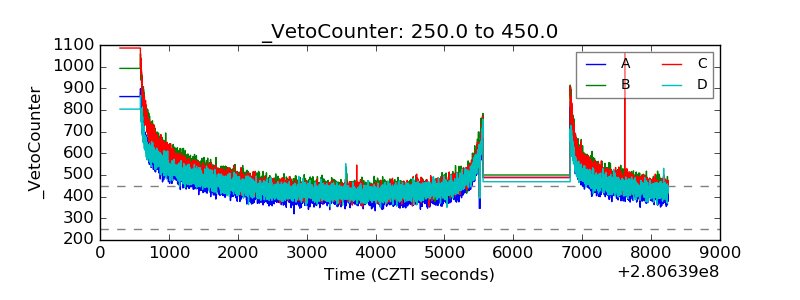 |