| Param | Original file | Final file |
|---|---|---|
| Filename | modeM0/AS1T03_004T01_9000002532_17055cztM0_level2.evt | modeM0/AS1T03_004T01_9000002532_17055cztM0_level2_quad_clean.evt |
| Size (bytes) | 542,511,360 | 89,202,240 |
| Size | 517.4 MB | 85.1 MB |
| Events in quadrant A | 3,771,351 | 545,411 |
| Events in quadrant B | 3,867,389 | 554,399 |
| Events in quadrant C | 4,539,661 | 532,199 |
| Events in quadrant D | 3,719,464 | 524,427 |
| Mode SS | |||
|---|---|---|---|
| Quadrant | BADHDUFLAG | Total packets | Discarded packets |
| A | 0 | 160 | 0 |
| B | 0 | 160 | 0 |
| C | 0 | 160 | 0 |
| D | 0 | 160 | 0 |
| Mode M9 | |||
|---|---|---|---|
| Quadrant | BADHDUFLAG | Total packets | Discarded packets |
| A | 0 | 4 | 0 |
| B | 0 | 5 | 0 |
| C | 0 | 5 | 0 |
| D | 0 | 5 | 0 |
| Mode M0 | |||
|---|---|---|---|
| Quadrant | BADHDUFLAG | Total packets | Discarded packets |
| A | 0 | 16334 | 1 |
| B | 0 | 16422 | 1 |
| C | 0 | 18451 | 1 |
| D | 0 | 16563 | 1 |
| Quadrant | Total seconds | Saturated seconds | Saturation percentage |
|---|---|---|---|
| A | 7829 | 283 | 3.614766% |
| B | 7829 | 320 | 4.087367% |
| C | 7829 | 300 | 3.831907% |
| D | 7829 | 194 | 2.477967% |
Noise dominated data is calculated using 1-second bins in cleaned event files. If a bin has >2000 counts, and if more than 50% of those come from <1% of pixels, then it is considered to be noise-dominated and hence unusable.
| Quadrant | # 1 sec bins | Bins with >0 counts | Bins with >2000 counts | High rate bins dominated by noise | Noise dominated (total time) | Noise dominated (detector-on time) | Marked lightcurve |
|---|---|---|---|---|---|---|---|
| A | 7830 | 7830 | 1 | 1 | 0.01% | 0.01% | 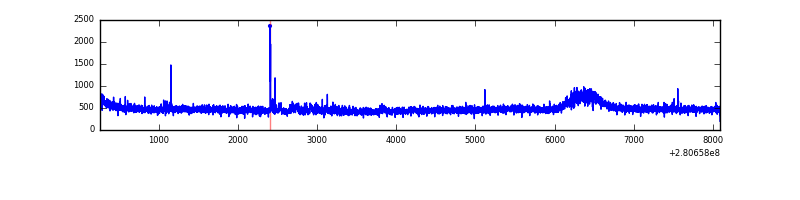 |
| B | 7830 | 7830 | 0 | 0 | 0.00% | 0.00% | 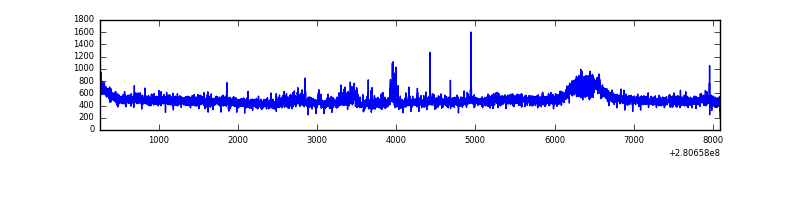 |
| C | 7830 | 7830 | 0 | 0 | 0.00% | 0.00% | 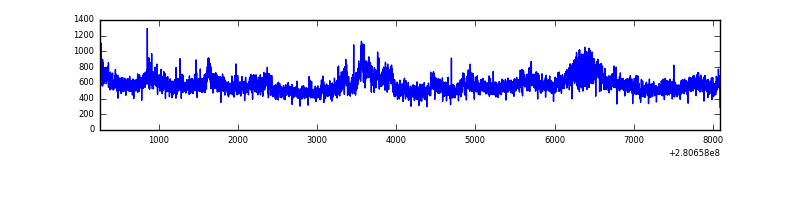 |
| D | 7830 | 7830 | 16 | 16 | 0.20% | 0.20% | 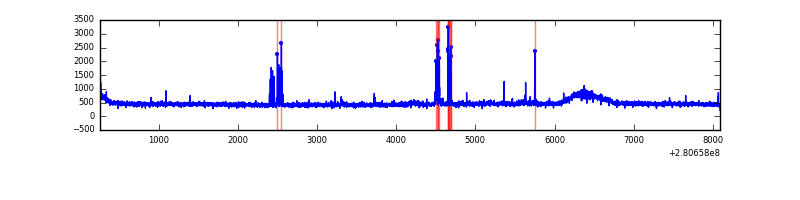 |
Top three noisy pixels from each quadrant. If the there are fewer than three noisy pixels in the level2.evt file, extra rows are filled as -1
| Pixel properties | Quadrant properties | ||||||
|---|---|---|---|---|---|---|---|
| Quadrant | DetID | PixID | Counts | Sigma | Mean | Median | Sigma |
| A | 3 | 254 | 42556 | 211.46 | 964 | 938 | 196.8 |
| A | 4 | 2 | 25316 | 123.87 | 964 | 938 | 196.8 |
| A | 0 | 226 | 8411 | 37.97 | 964 | 938 | 196.8 |
| B | 0 | 219 | 32703 | 169.74 | 964 | 938 | 187.1 |
| B | 12 | 111 | 22736 | 116.48 | 964 | 938 | 187.1 |
| B | 11 | 111 | 19779 | 100.68 | 964 | 938 | 187.1 |
| C | 3 | 233 | 789055 | 3640.32 | 922 | 927 | 216.5 |
| C | 14 | 238 | 140482 | 644.6 | 922 | 927 | 216.5 |
| C | 9 | 160 | 7055 | 28.3 | 922 | 927 | 216.5 |
| D | 10 | 70 | 111911 | 480.99 | 940 | 910 | 230.8 |
| D | 2 | 234 | 31240 | 131.43 | 940 | 910 | 230.8 |
| D | 5 | 222 | 20228 | 83.71 | 940 | 910 | 230.8 |
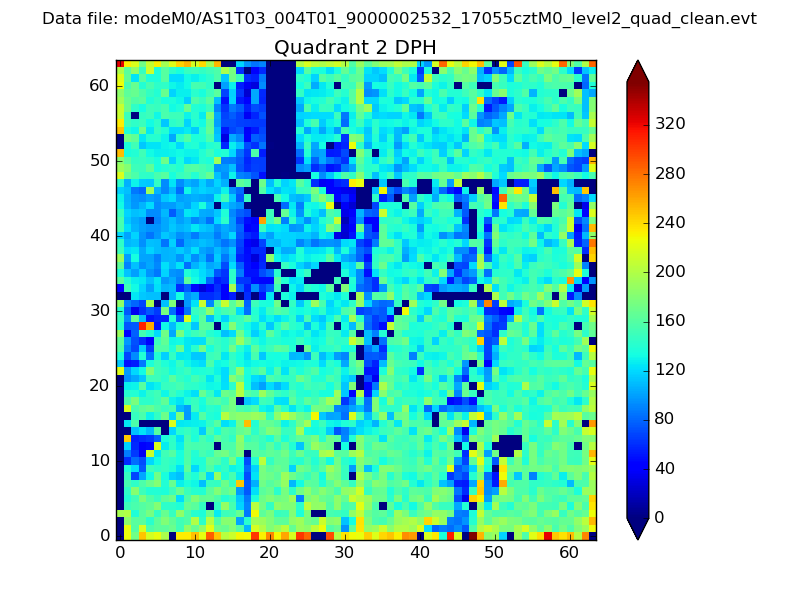
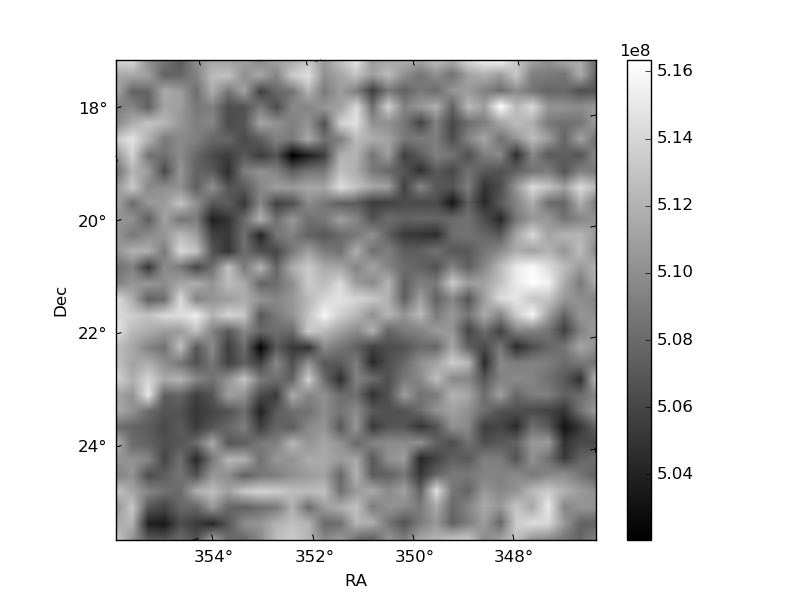
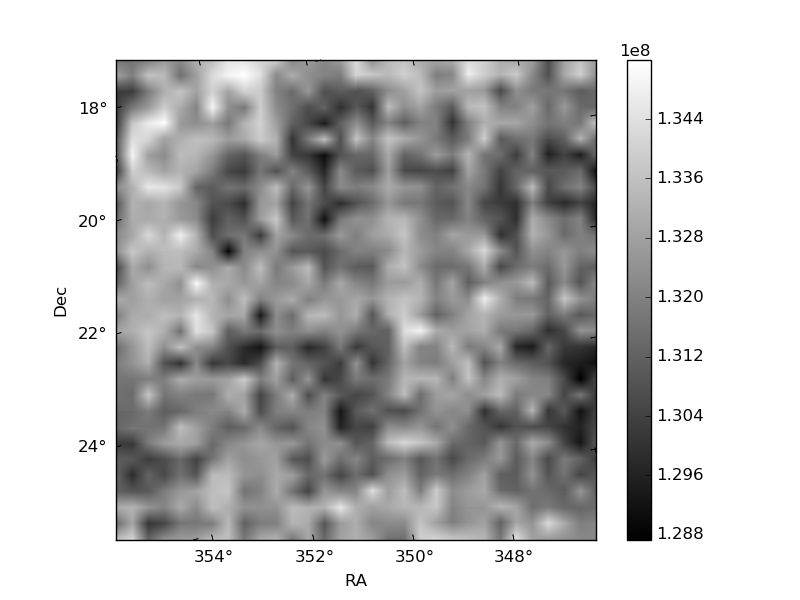
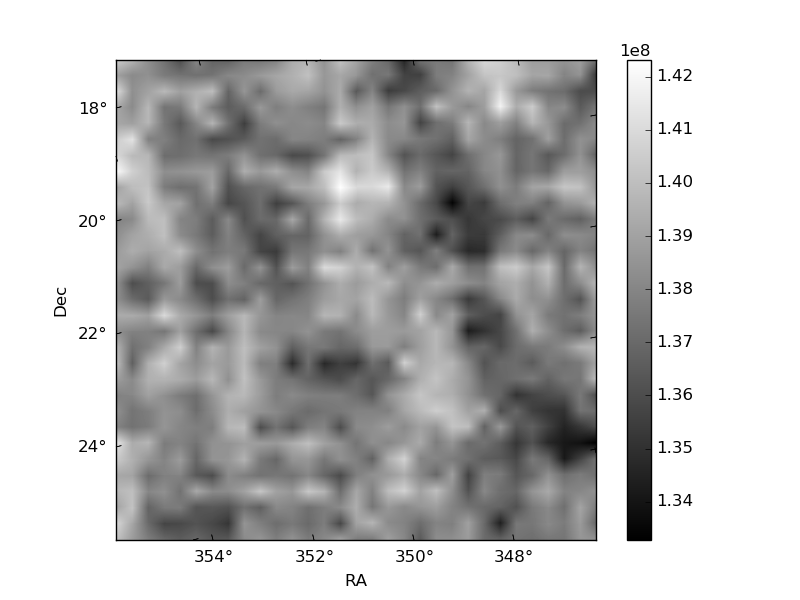
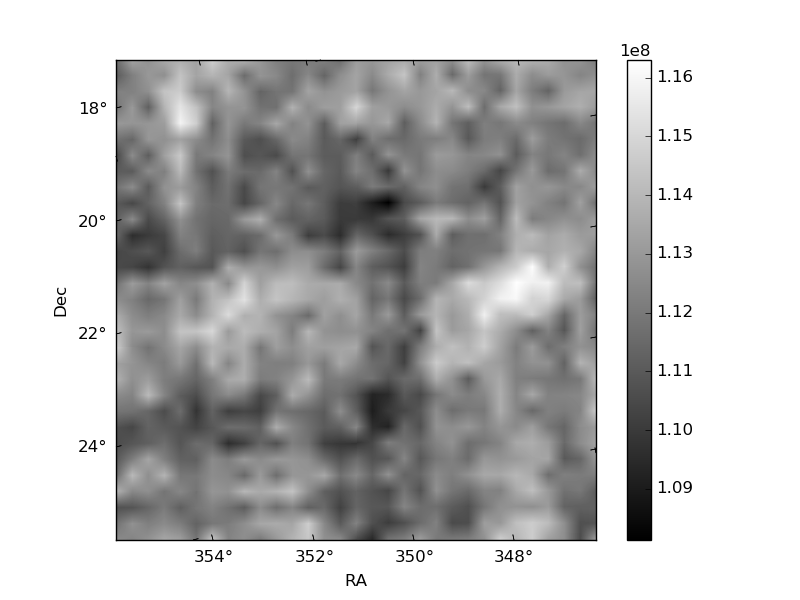
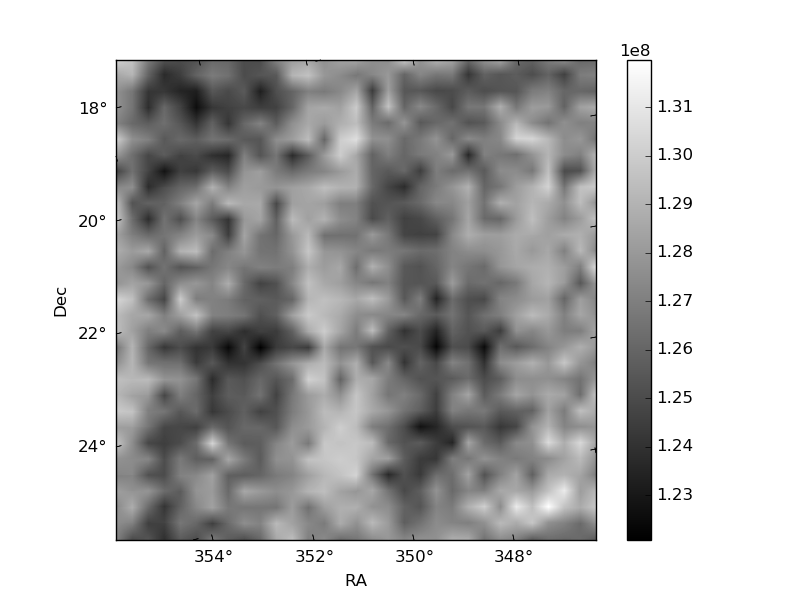
Histogram calculated using DETX and DETY for each event in the final _common_clean file
| Quadrant A | 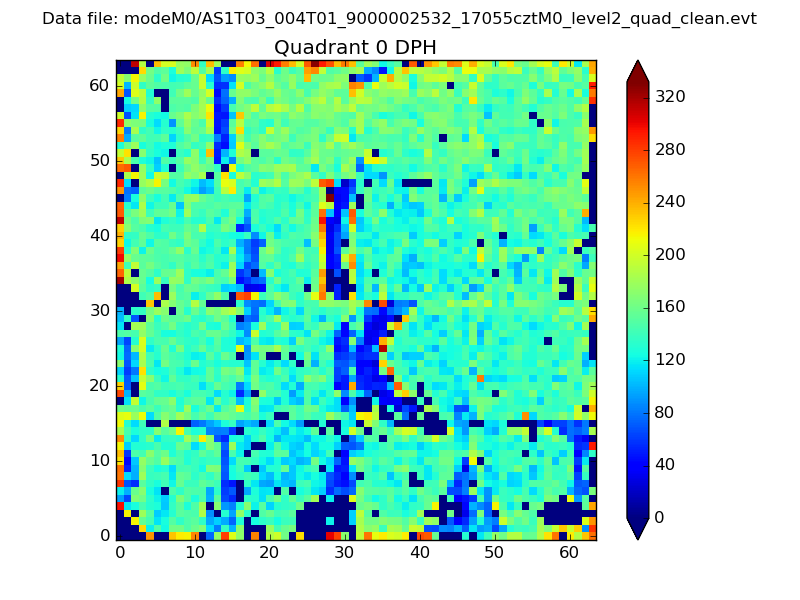 |
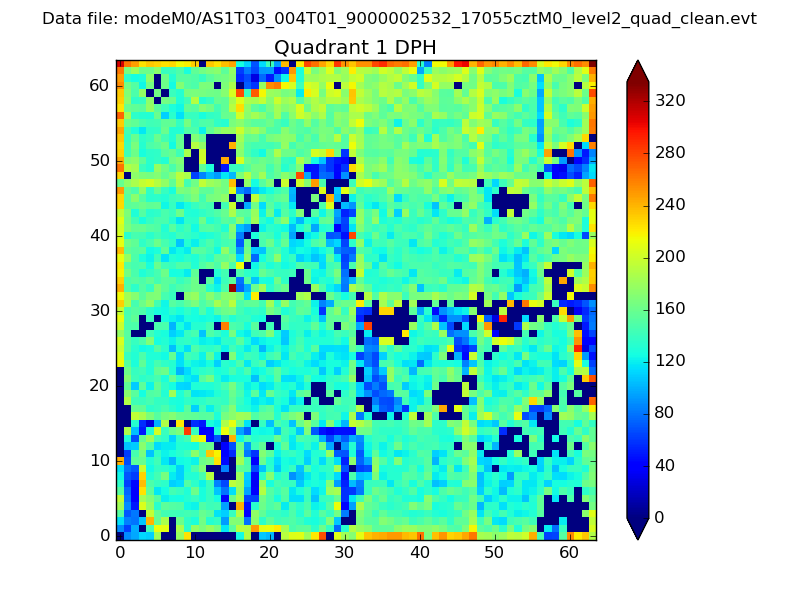 |
Quadrant B |
|---|---|---|---|
| Quadrant D | 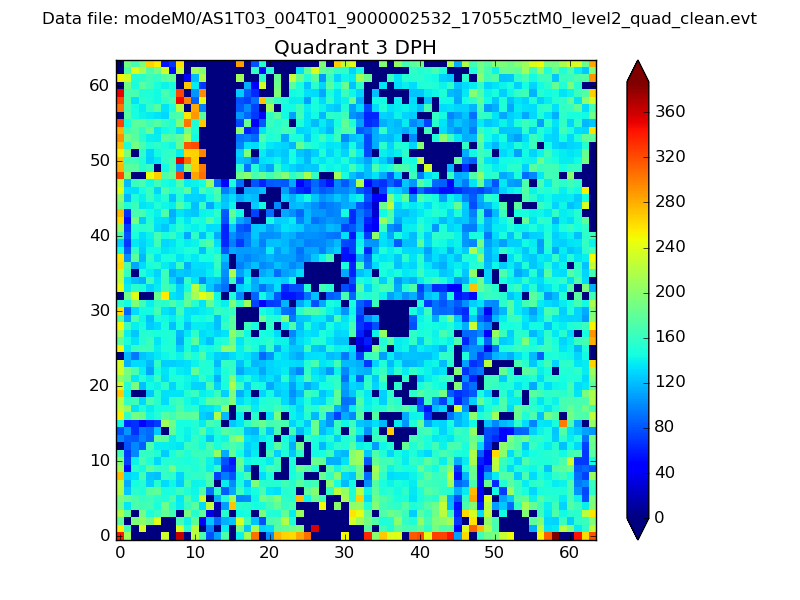 |
 |
Quadrant C |
| Plot type | Count rate plots | Images |
|---|---|---|
| Comparison with Poisson distribution Blue bars denote a histogram of data divided into 1 sec bins. Red curve is a Poisson curve with rate = median count rate of data. |
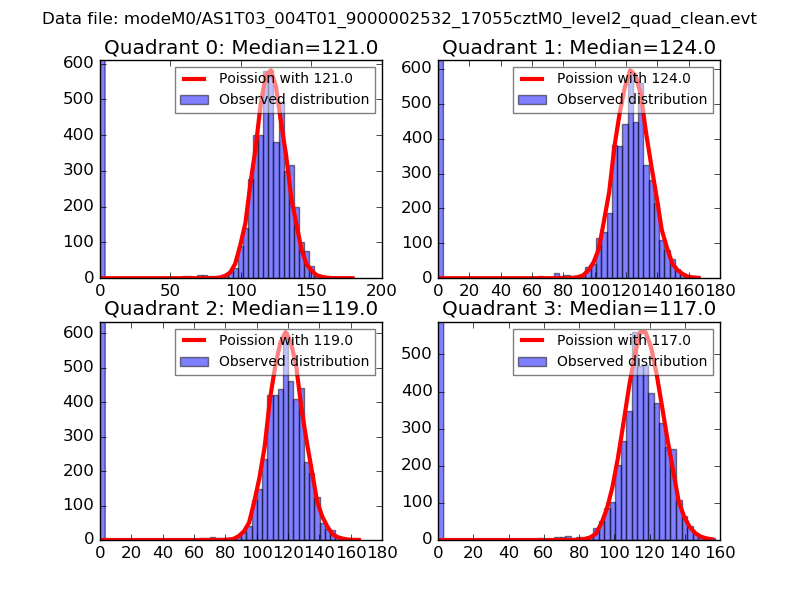 |
 |
| Quadrant-wise count rates Data is divided into 100 sec bins |
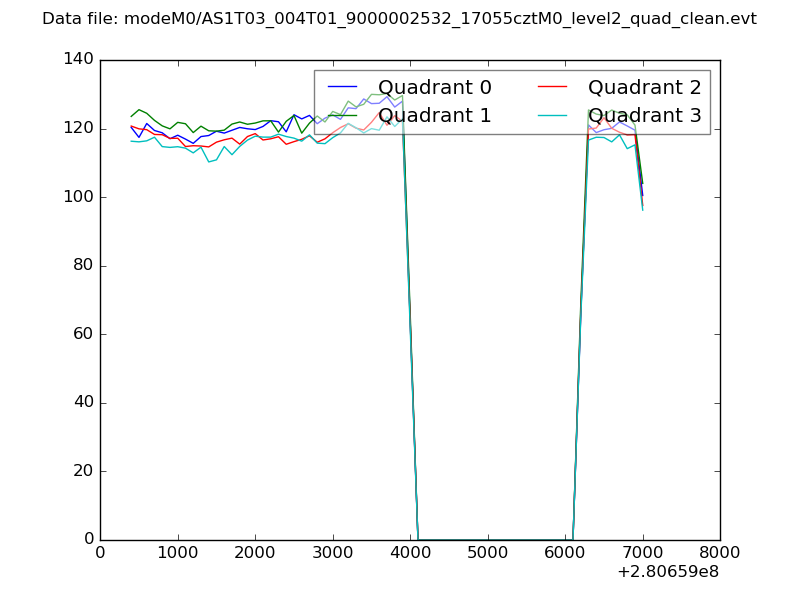 |
|
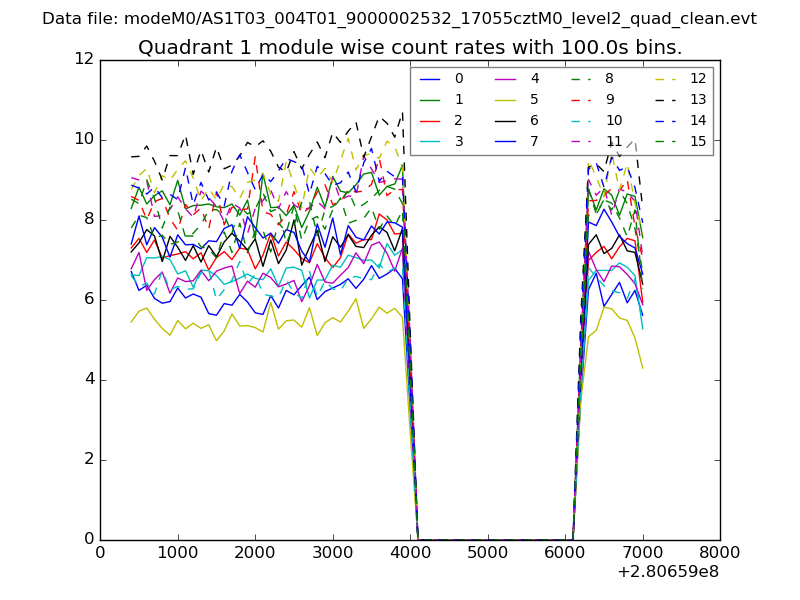
| Module-wise count rates for Quadrant A Data is divided into 100 sec bins |
 |
 |
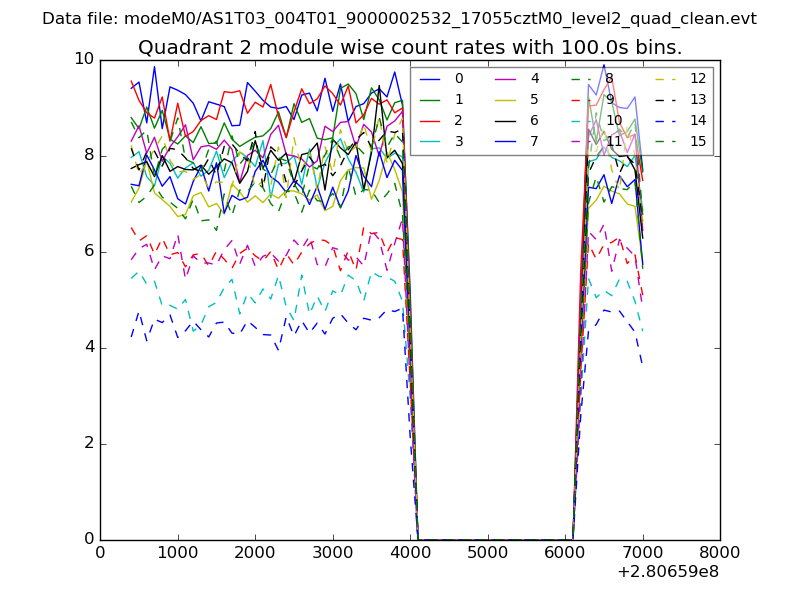
| Module-wise count rates for Quadrant B Data is divided into 100 sec bins |
 |
 |
| Module-wise count rates for Quadrant C Data is divided into 100 sec bins |
 |
 |
| Module-wise count rates for Quadrant D Data is divided into 100 sec bins |
 |
 |
| Parameter | Plot |
|---|---|
| CZT HV Monitor | 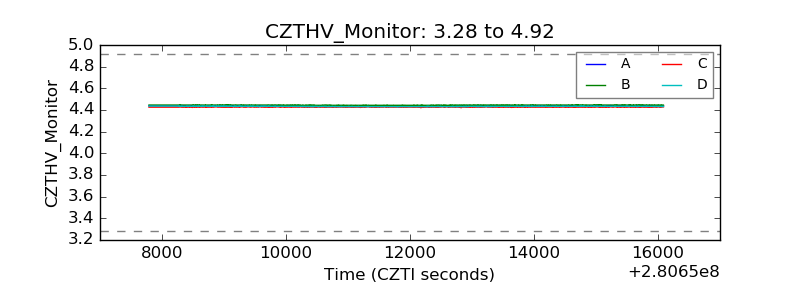 |
| D_VDD | 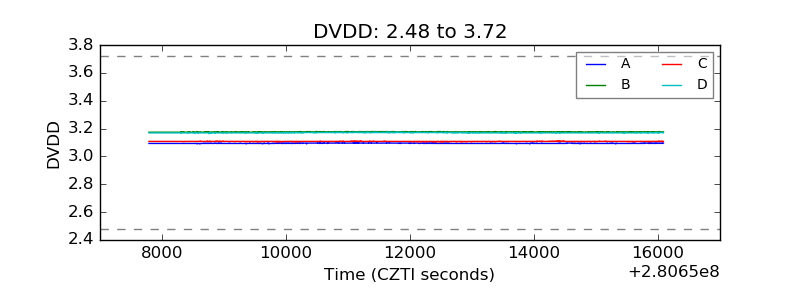 |
| Temperature 1 | 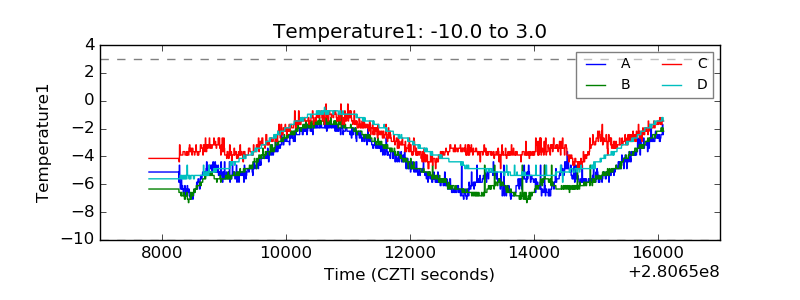 |
| Veto HV Monitor | 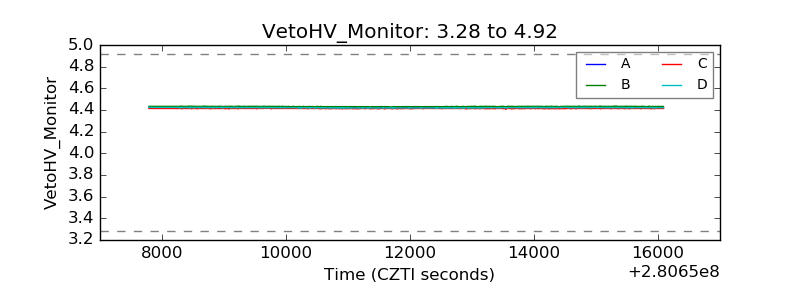 |
| Veto LLD |  |
| Alpha Counter | 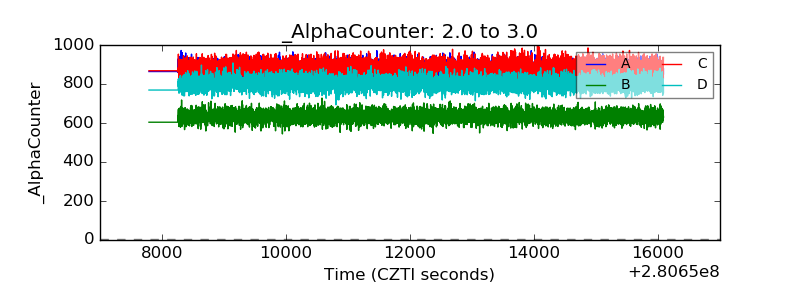 |
| _CPM_Rate | 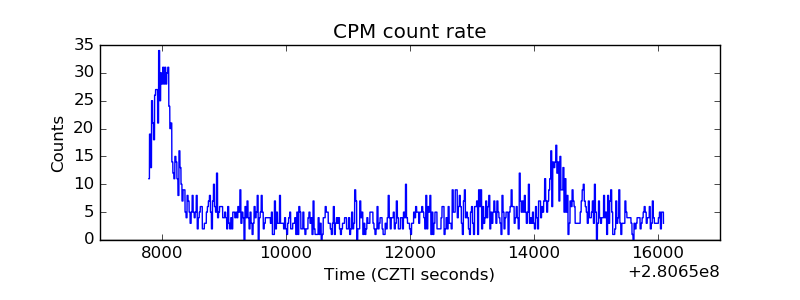 |
| CZT Counter | 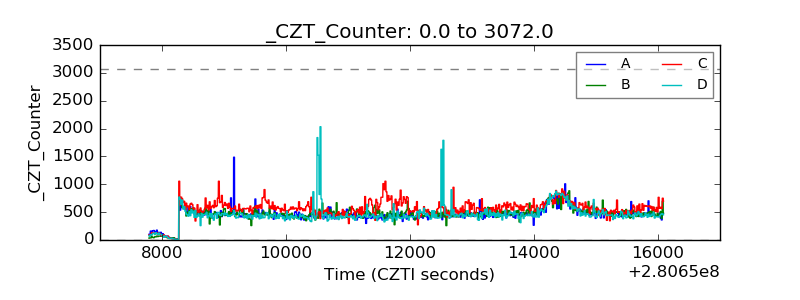 |
| +2.5 Volts monitor |  |
| +5 Volts monitor |  |
| _ROLL_ROT |  |
| _Roll_DEC | 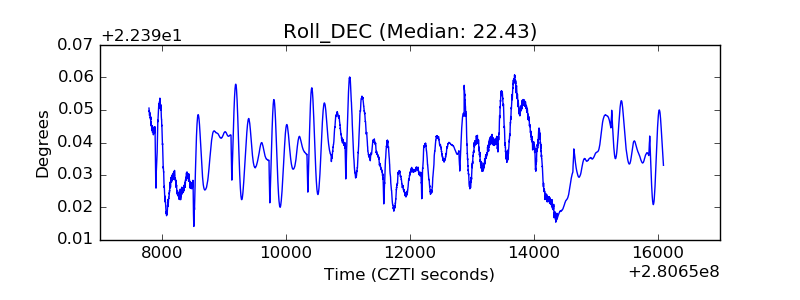 |
| _Roll_RA | 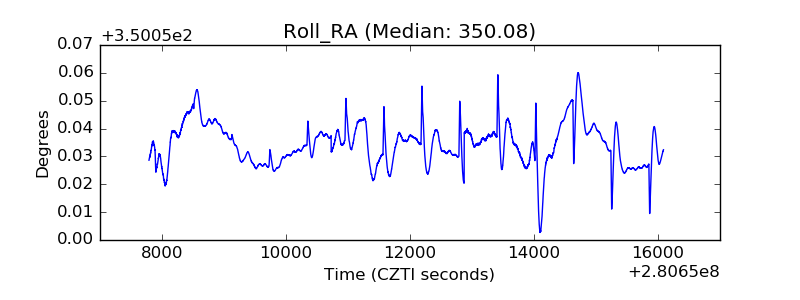 |
| Veto Counter | 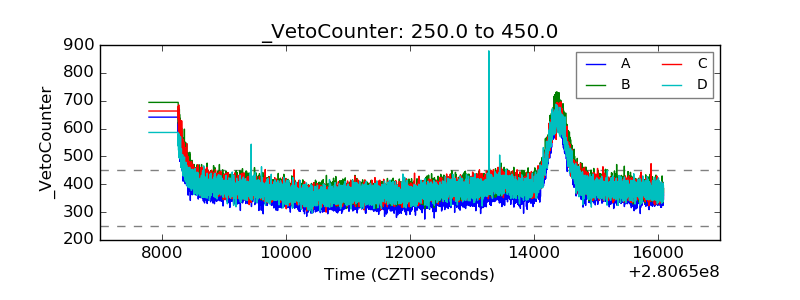 |