| Param | Original file | Final file |
|---|---|---|
| Filename | modeM0/AS1T03_004T01_9000002532_17056cztM0_level2.evt | modeM0/AS1T03_004T01_9000002532_17056cztM0_level2_quad_clean.evt |
| Size (bytes) | 490,440,960 | 85,017,600 |
| Size | 467.7 MB | 81.1 MB |
| Events in quadrant A | 3,116,694 | 542,166 |
| Events in quadrant B | 3,351,269 | 546,832 |
| Events in quadrant C | 4,713,018 | 512,706 |
| Events in quadrant D | 3,226,807 | 516,050 |
| Mode SS | |||
|---|---|---|---|
| Quadrant | BADHDUFLAG | Total packets | Discarded packets |
| A | 0 | 144 | 10 |
| B | 0 | 144 | 10 |
| C | 0 | 144 | 10 |
| D | 0 | 144 | 8 |
| Mode M9 | |||
|---|---|---|---|
| Quadrant | BADHDUFLAG | Total packets | Discarded packets |
| A | 0 | 1 | 0 |
| B | 0 | 1 | 0 |
| C | 0 | 1 | 0 |
| D | 0 | 1 | 0 |
| Mode M0 | |||
|---|---|---|---|
| Quadrant | BADHDUFLAG | Total packets | Discarded packets |
| A | 0 | 14816 | 1201 |
| B | 0 | 15297 | 1169 |
| C | 0 | 20309 | 1788 |
| D | 0 | 15460 | 1283 |
| Quadrant | Total seconds | Saturated seconds | Saturation percentage |
|---|---|---|---|
| A | 6539 | 192 | 2.936229% |
| B | 6573 | 243 | 3.696942% |
| C | 6474 | 313 | 4.834724% |
| D | 6551 | 182 | 2.778202% |
Noise dominated data is calculated using 1-second bins in cleaned event files. If a bin has >2000 counts, and if more than 50% of those come from <1% of pixels, then it is considered to be noise-dominated and hence unusable.
| Quadrant | # 1 sec bins | Bins with >0 counts | Bins with >2000 counts | High rate bins dominated by noise | Noise dominated (total time) | Noise dominated (detector-on time) | Marked lightcurve |
|---|---|---|---|---|---|---|---|
| A | 7217 | 6943 | 1 | 1 | 0.01% | 0.01% | 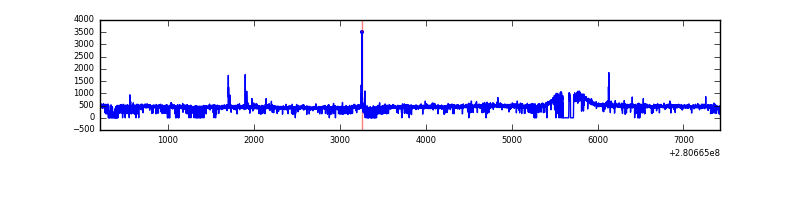 |
| B | 7218 | 6979 | 16 | 16 | 0.22% | 0.23% | 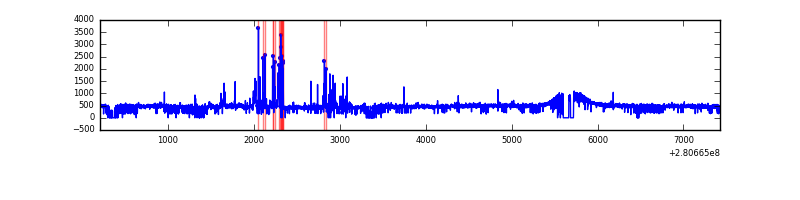 |
| C | 7216 | 6924 | 28 | 28 | 0.39% | 0.40% | 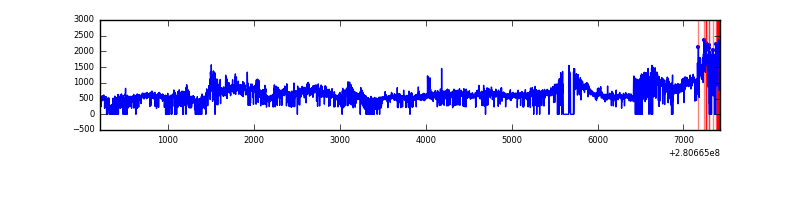 |
| D | 7217 | 6962 | 45 | 45 | 0.62% | 0.65% | 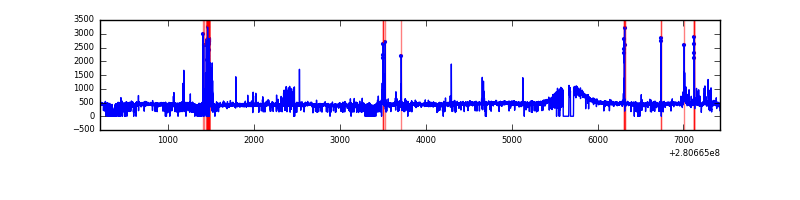 |
Top three noisy pixels from each quadrant. If the there are fewer than three noisy pixels in the level2.evt file, extra rows are filled as -1
| Pixel properties | Quadrant properties | ||||||
|---|---|---|---|---|---|---|---|
| Quadrant | DetID | PixID | Counts | Sigma | Mean | Median | Sigma |
| A | 4 | 2 | 25150 | 150.43 | 795 | 777 | 162.0 |
| A | 12 | 189 | 22775 | 135.77 | 795 | 777 | 162.0 |
| A | 0 | 226 | 7101 | 39.03 | 795 | 777 | 162.0 |
| B | 7 | 220 | 116220 | 745.5 | 798 | 777 | 154.9 |
| B | 0 | 197 | 41015 | 259.85 | 798 | 777 | 154.9 |
| B | 0 | 189 | 22791 | 142.16 | 798 | 777 | 154.9 |
| C | 3 | 233 | 1650886 | 9329.08 | 748 | 753 | 176.9 |
| C | 14 | 238 | 112627 | 632.48 | 748 | 753 | 176.9 |
| C | 9 | 160 | 12233 | 64.9 | 748 | 753 | 176.9 |
| D | 10 | 70 | 164170 | 863.71 | 775 | 751 | 189.2 |
| D | 15 | 0 | 84398 | 442.1 | 775 | 751 | 189.2 |
| D | 2 | 234 | 27685 | 142.35 | 775 | 751 | 189.2 |
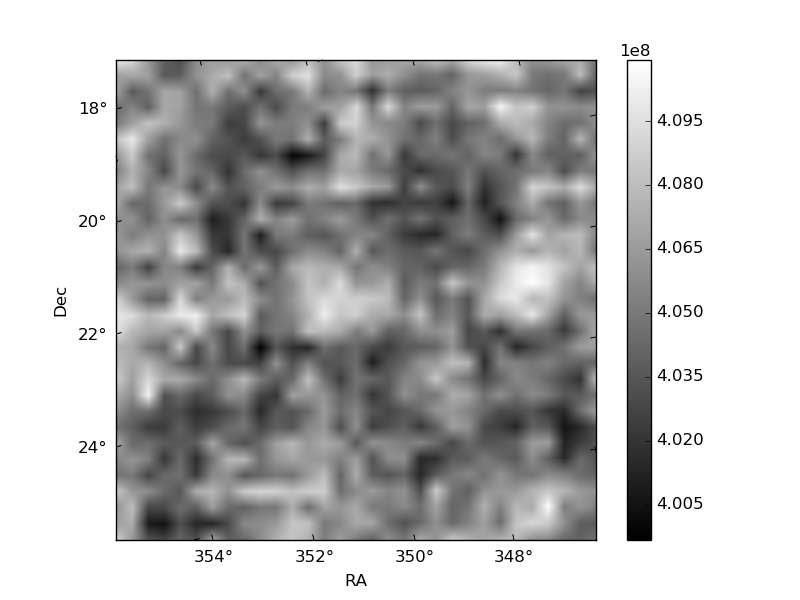
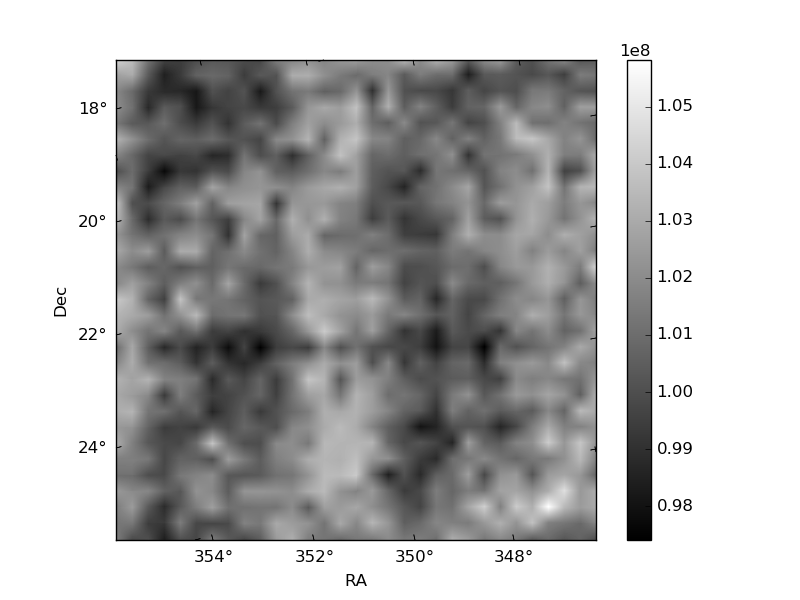
Histogram calculated using DETX and DETY for each event in the final _common_clean file
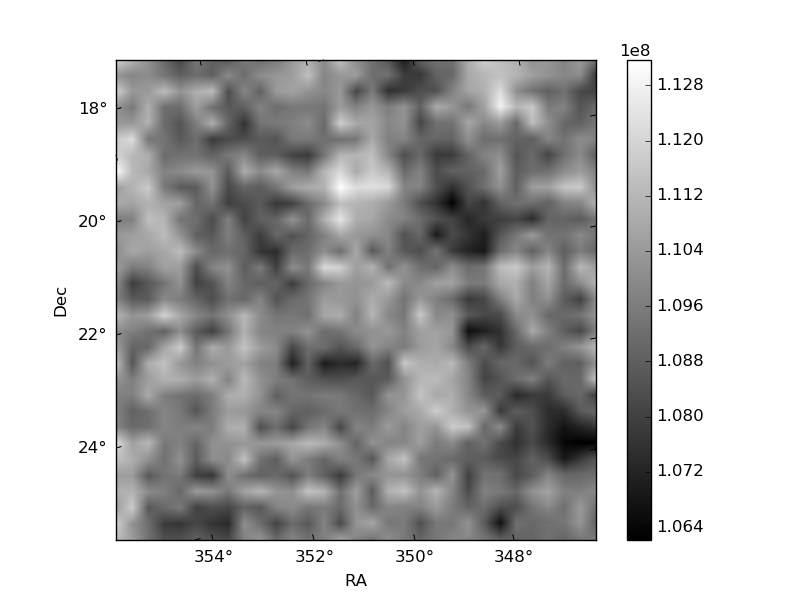
| Quadrant A | 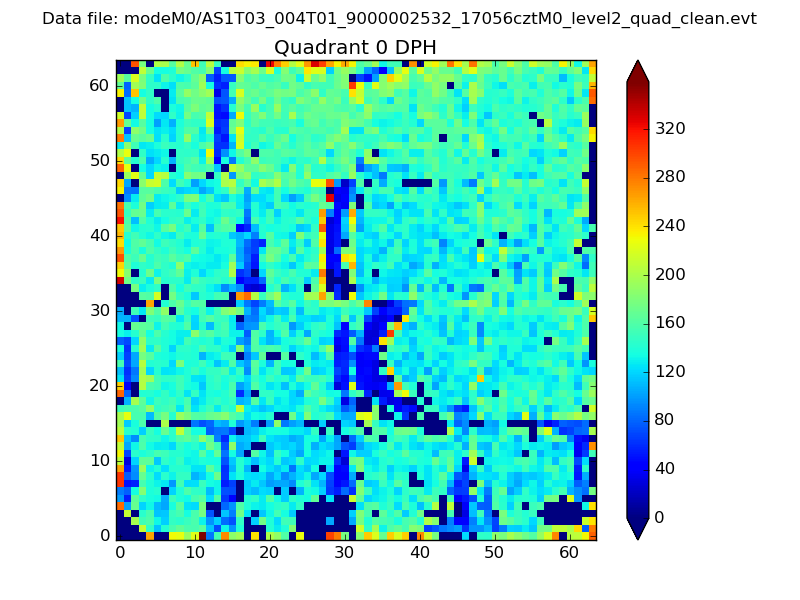 |
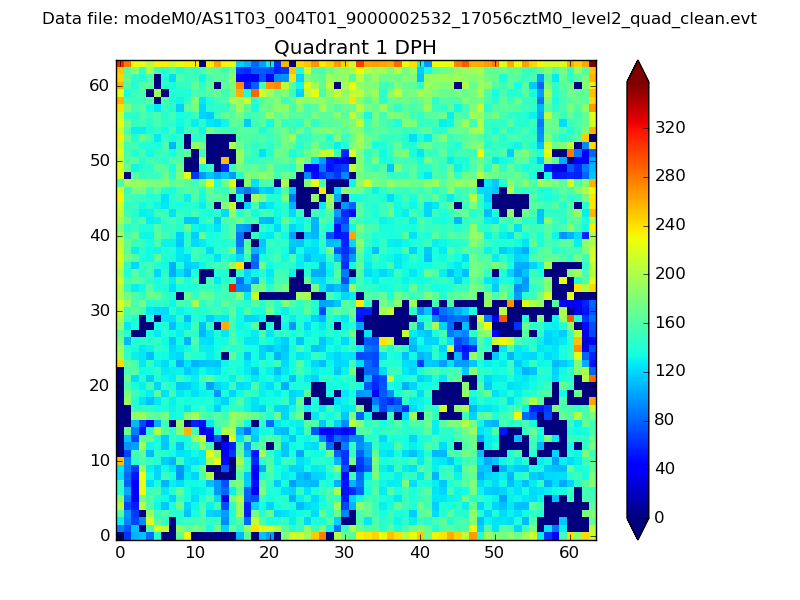 |
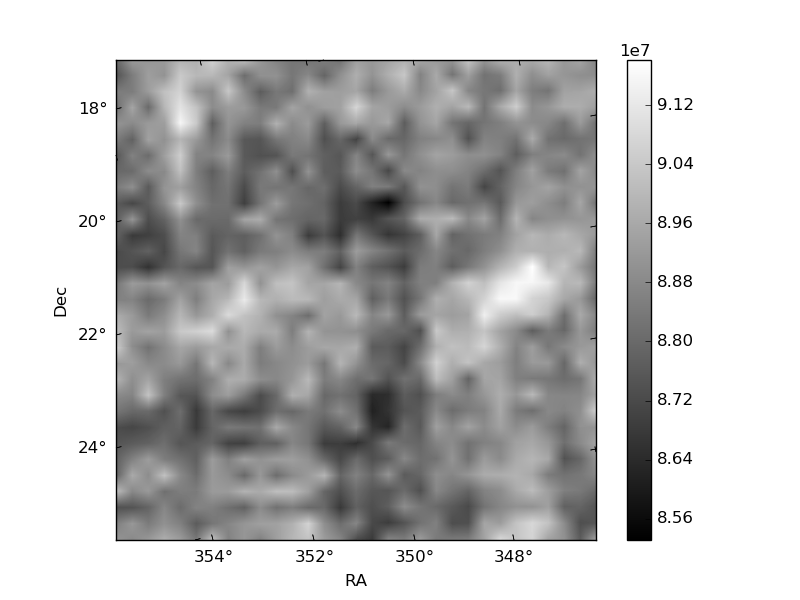
Quadrant B |
|---|---|---|---|
| Quadrant D | 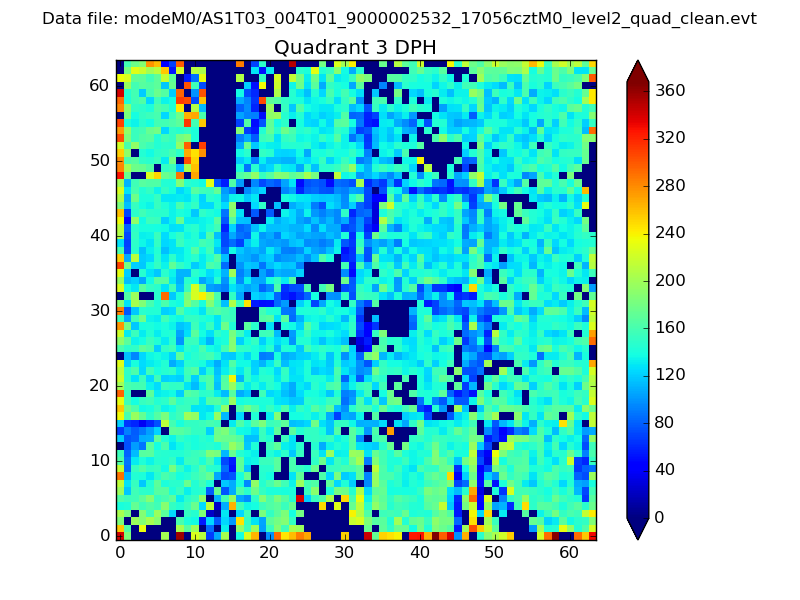 |
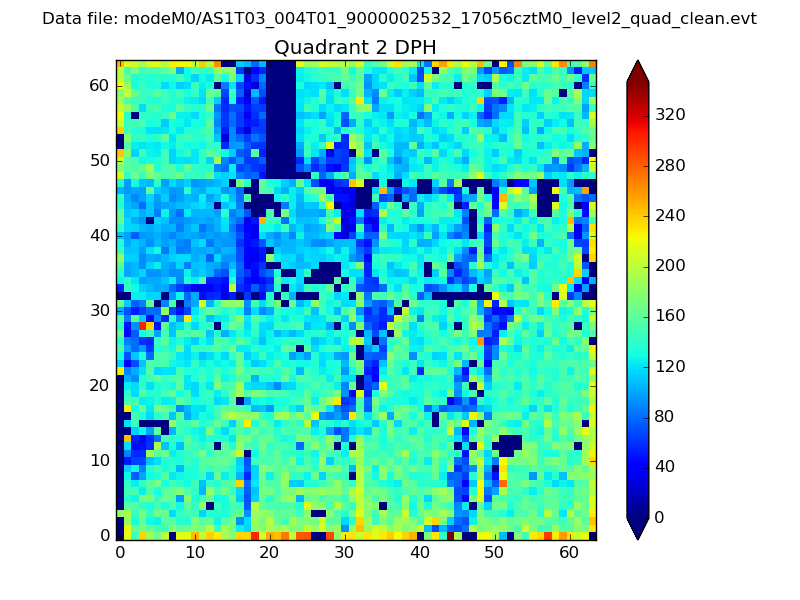 |
Quadrant C |
| Plot type | Count rate plots | Images |
|---|---|---|
| Comparison with Poisson distribution Blue bars denote a histogram of data divided into 1 sec bins. Red curve is a Poisson curve with rate = median count rate of data. |
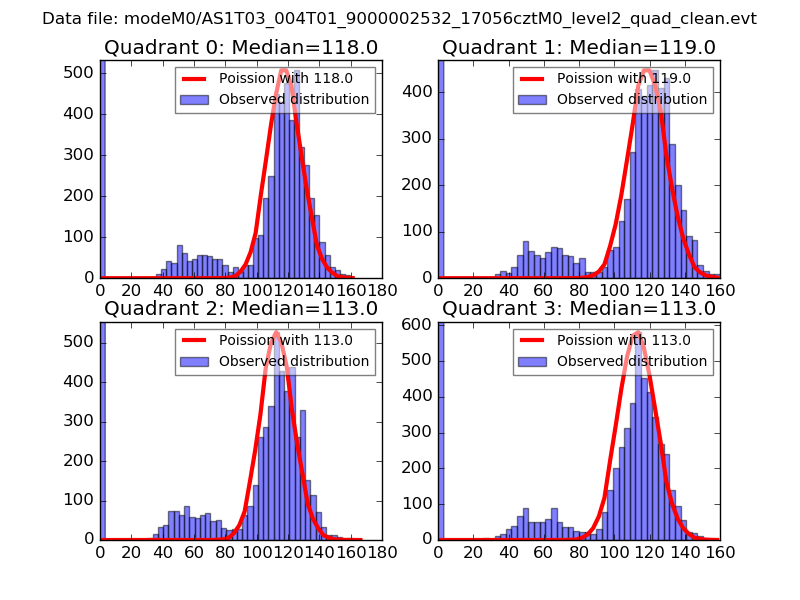 |
 |
| Quadrant-wise count rates Data is divided into 100 sec bins |
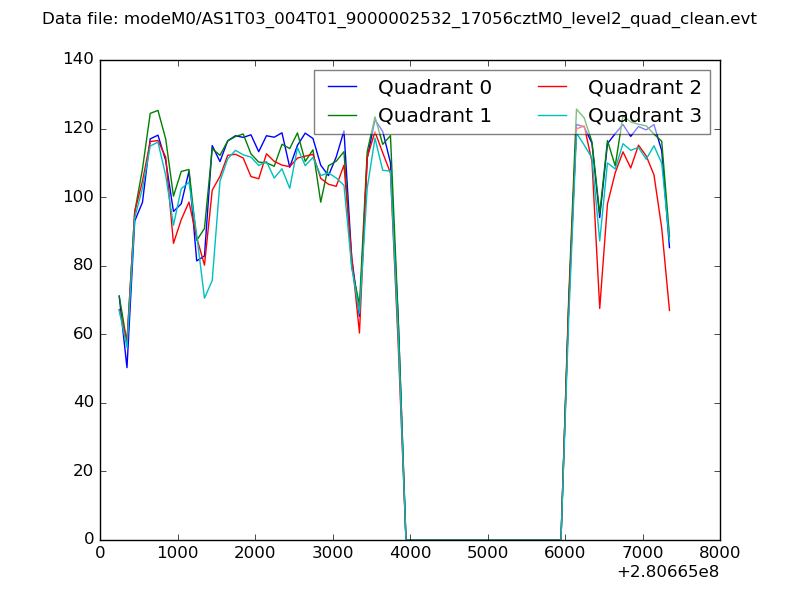 |
|
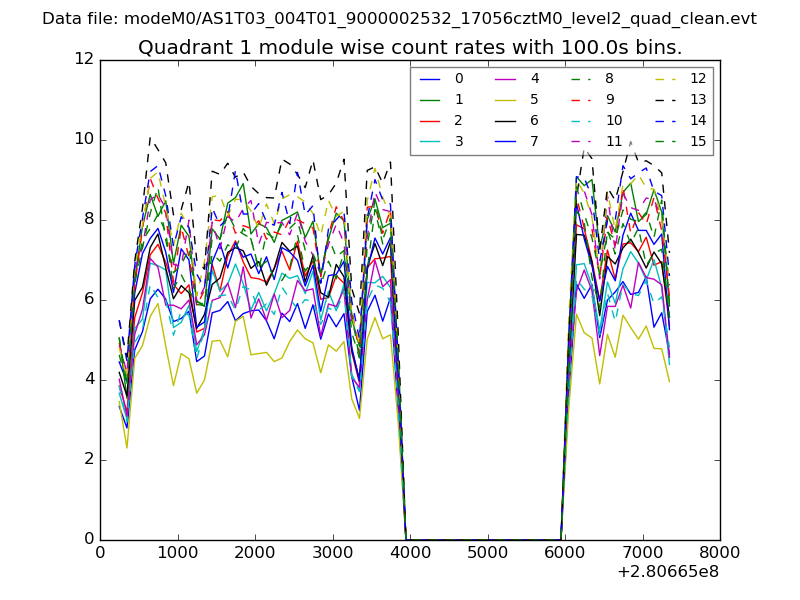
| Module-wise count rates for Quadrant A Data is divided into 100 sec bins |
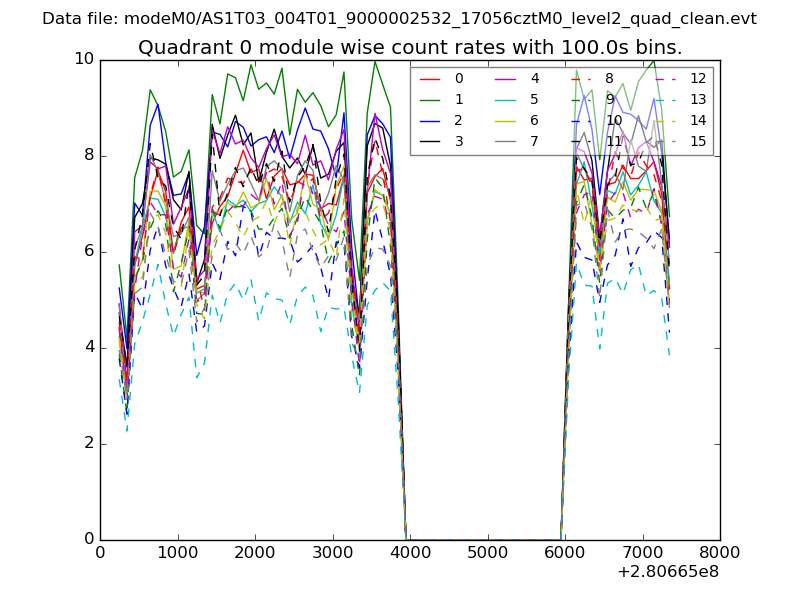 |
 |
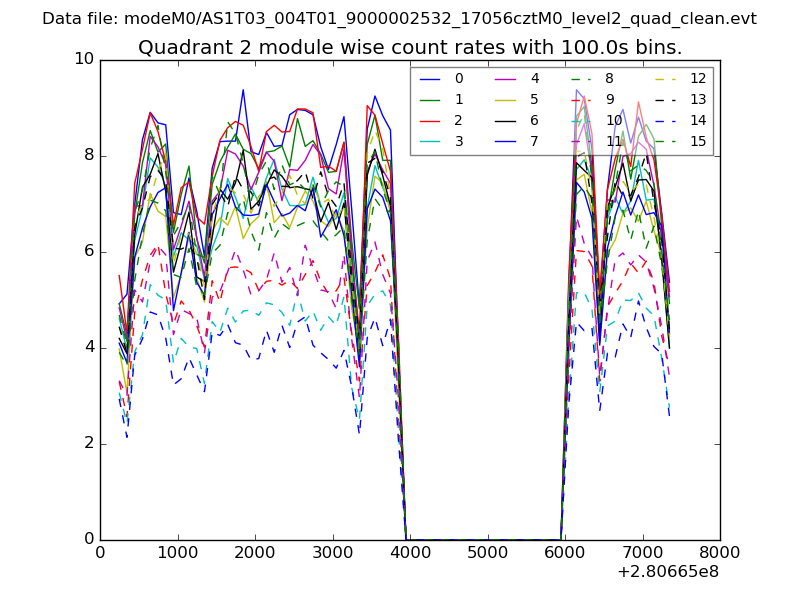
| Module-wise count rates for Quadrant B Data is divided into 100 sec bins |
 |
 |
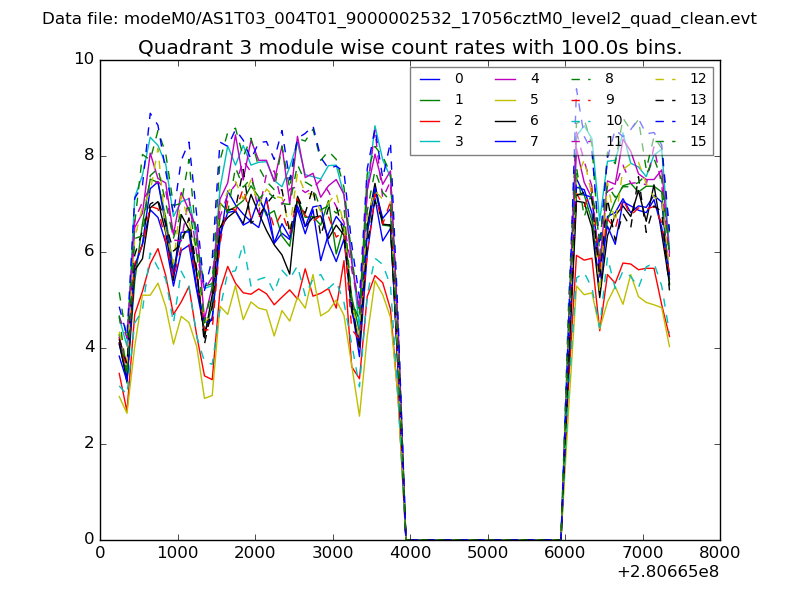
| Module-wise count rates for Quadrant C Data is divided into 100 sec bins |
 |
 |
| Module-wise count rates for Quadrant D Data is divided into 100 sec bins |
 |
 |
| Parameter | Plot |
|---|---|
| CZT HV Monitor | 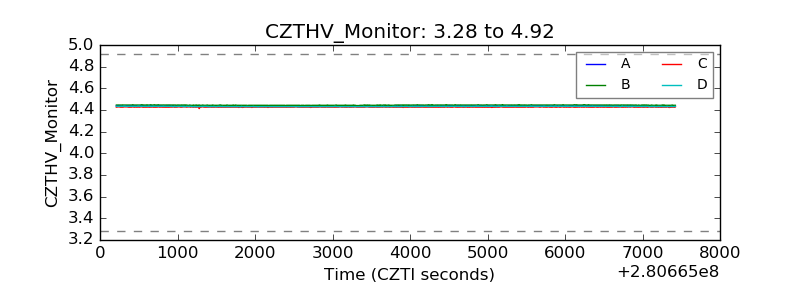 |
| D_VDD | 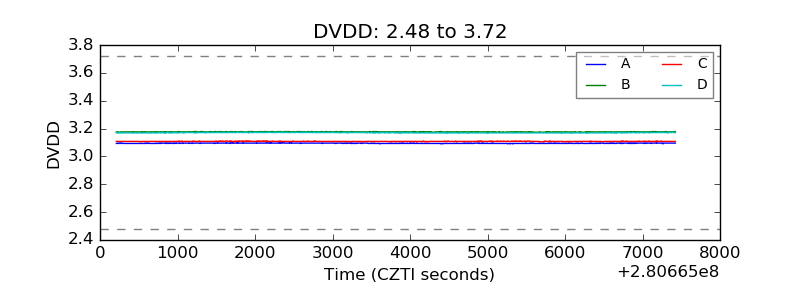 |
| Temperature 1 | 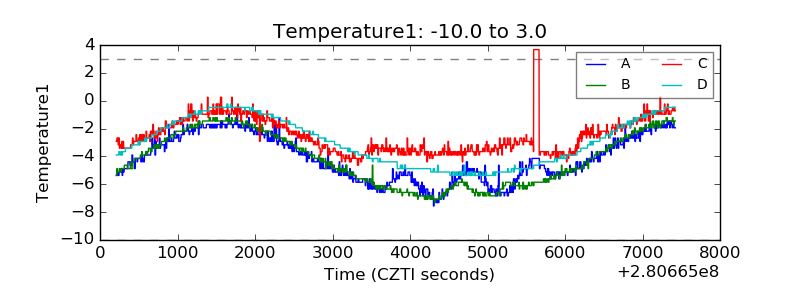 |
| Veto HV Monitor | 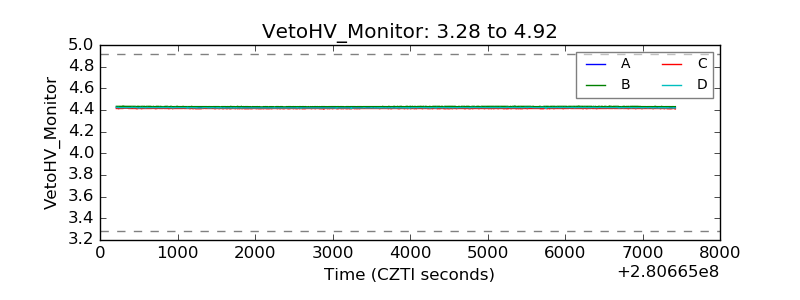 |
| Veto LLD | 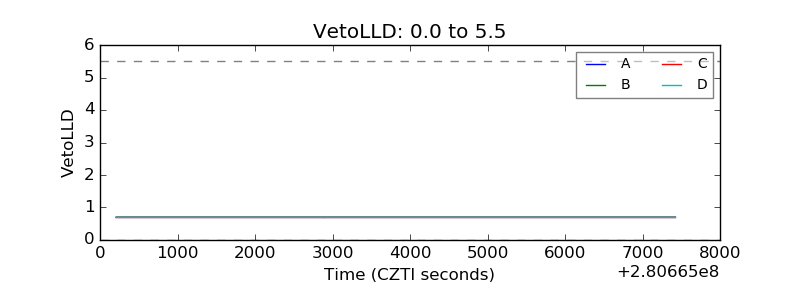 |
| Alpha Counter | 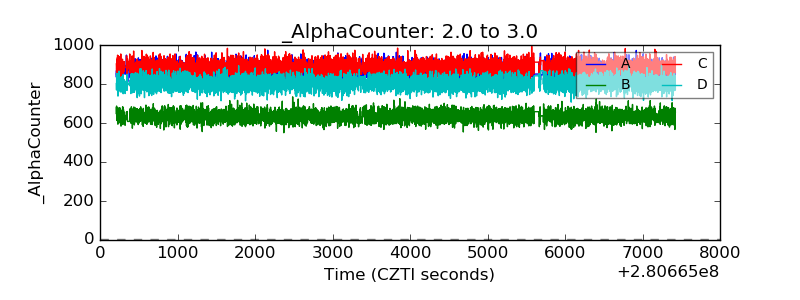 |
| _CPM_Rate | 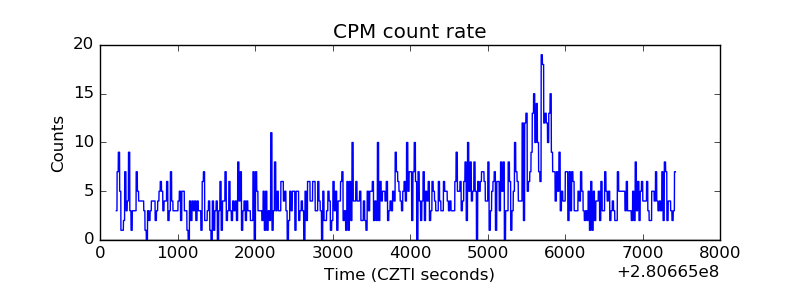 |
| CZT Counter | 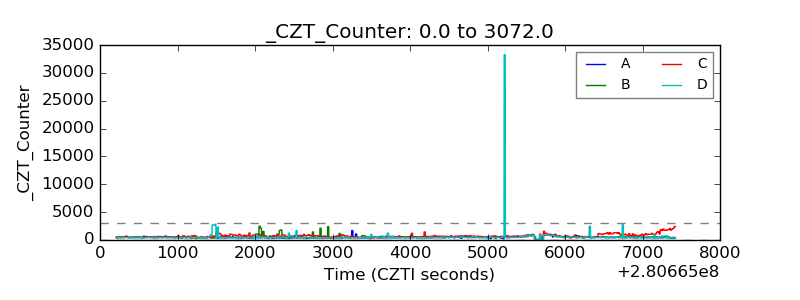 |
| +2.5 Volts monitor |  |
| +5 Volts monitor |  |
| _ROLL_ROT |  |
| _Roll_DEC | 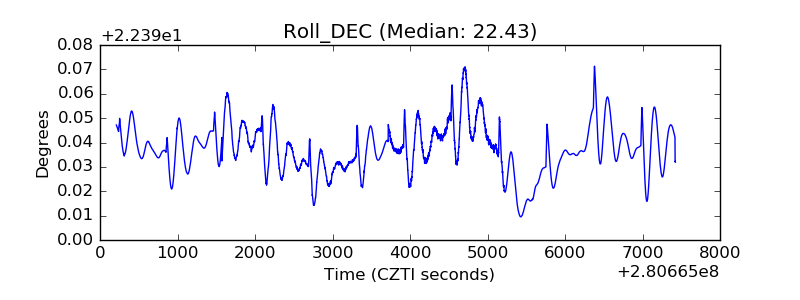 |
| _Roll_RA | 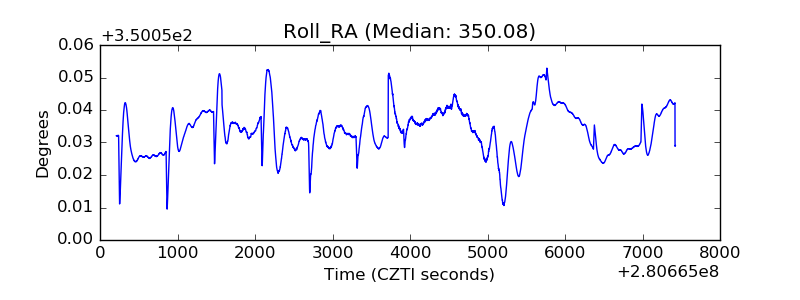 |
| Veto Counter | 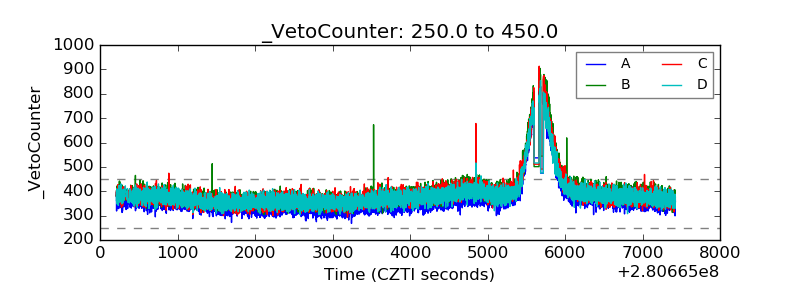 |