| Param | Original file | Final file |
|---|---|---|
| Filename | modeM0/AS1T03_004T01_9000002532_17059cztM0_level2.evt | modeM0/AS1T03_004T01_9000002532_17059cztM0_level2_quad_clean.evt |
| Size (bytes) | 1,521,437,760 | 229,642,560 |
| Size | 1.4 GB | 219.0 MB |
| Events in quadrant A | 8,508,964 | 1,458,612 |
| Events in quadrant B | 9,024,396 | 1,469,553 |
| Events in quadrant C | 17,969,586 | 1,363,334 |
| Events in quadrant D | 9,327,848 | 1,389,681 |
| Mode SS | |||
|---|---|---|---|
| Quadrant | BADHDUFLAG | Total packets | Discarded packets |
| A | 0 | 376 | 0 |
| B | 0 | 376 | 0 |
| C | 0 | 376 | 0 |
| D | 0 | 376 | 0 |
| Mode M9 | |||
|---|---|---|---|
| Quadrant | BADHDUFLAG | Total packets | Discarded packets |
| A | 0 | 19 | 0 |
| B | 0 | 19 | 0 |
| C | 0 | 19 | 0 |
| D | 0 | 19 | 0 |
| Mode M0 | |||
|---|---|---|---|
| Quadrant | BADHDUFLAG | Total packets | Discarded packets |
| A | 0 | 37856 | 3 |
| B | 0 | 38623 | 3 |
| C | 0 | 66679 | 4 |
| D | 0 | 40832 | 3 |
| Quadrant | Total seconds | Saturated seconds | Saturation percentage |
|---|---|---|---|
| A | 18480 | 126 | 0.681818% |
| B | 18481 | 179 | 0.968562% |
| C | 18480 | 1277 | 6.910173% |
| D | 18480 | 353 | 1.910173% |
Noise dominated data is calculated using 1-second bins in cleaned event files. If a bin has >2000 counts, and if more than 50% of those come from <1% of pixels, then it is considered to be noise-dominated and hence unusable.
| Quadrant | # 1 sec bins | Bins with >0 counts | Bins with >2000 counts | High rate bins dominated by noise | Noise dominated (total time) | Noise dominated (detector-on time) | Marked lightcurve |
|---|---|---|---|---|---|---|---|
| A | 20366 | 18484 | 0 | 0 | 0.00% | 0.00% | 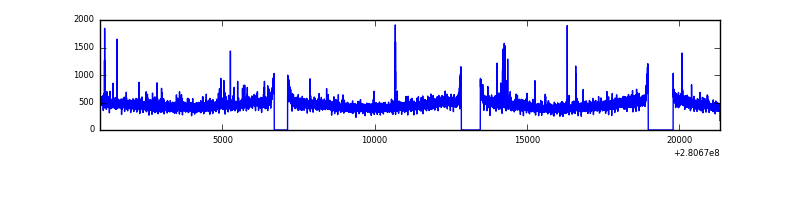 |
| B | 20367 | 18485 | 26 | 26 | 0.13% | 0.14% | 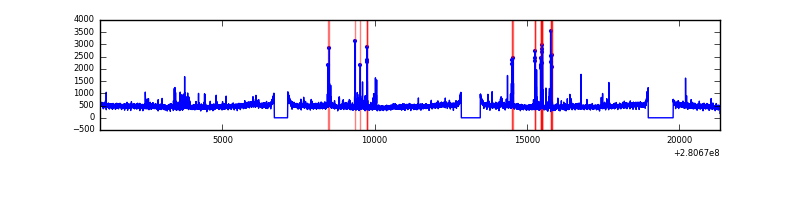 |
| C | 20366 | 18483 | 429 | 429 | 2.11% | 2.32% | 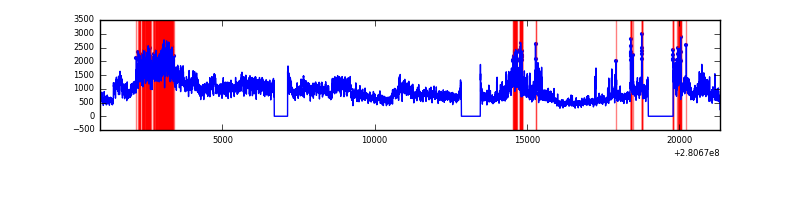 |
| D | 20366 | 18484 | 221 | 221 | 1.09% | 1.20% | 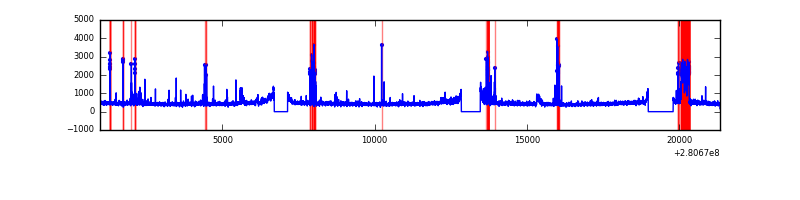 |
Top three noisy pixels from each quadrant. If the there are fewer than three noisy pixels in the level2.evt file, extra rows are filled as -1
| Pixel properties | Quadrant properties | ||||||
|---|---|---|---|---|---|---|---|
| Quadrant | DetID | PixID | Counts | Sigma | Mean | Median | Sigma |
| A | 4 | 2 | 76816 | 168.76 | 2183 | 2133 | 442.5 |
| A | 12 | 189 | 43358 | 93.16 | 2183 | 2133 | 442.5 |
| A | 0 | 226 | 19331 | 38.86 | 2183 | 2133 | 442.5 |
| B | 0 | 197 | 191972 | 456.15 | 2182 | 2128 | 416.2 |
| B | 0 | 219 | 95452 | 224.23 | 2182 | 2128 | 416.2 |
| B | 12 | 111 | 49729 | 114.37 | 2182 | 2128 | 416.2 |
| C | 3 | 233 | 9581019 | 19962.72 | 2063 | 2078 | 479.8 |
| C | 14 | 238 | 312314 | 646.54 | 2063 | 2078 | 479.8 |
| C | 9 | 54 | 18243 | 33.69 | 2063 | 2078 | 479.8 |
| D | 15 | 0 | 786564 | 1533.38 | 2119 | 2059 | 511.6 |
| D | 1 | 52 | 252645 | 489.79 | 2119 | 2059 | 511.6 |
| D | 10 | 70 | 222200 | 430.28 | 2119 | 2059 | 511.6 |
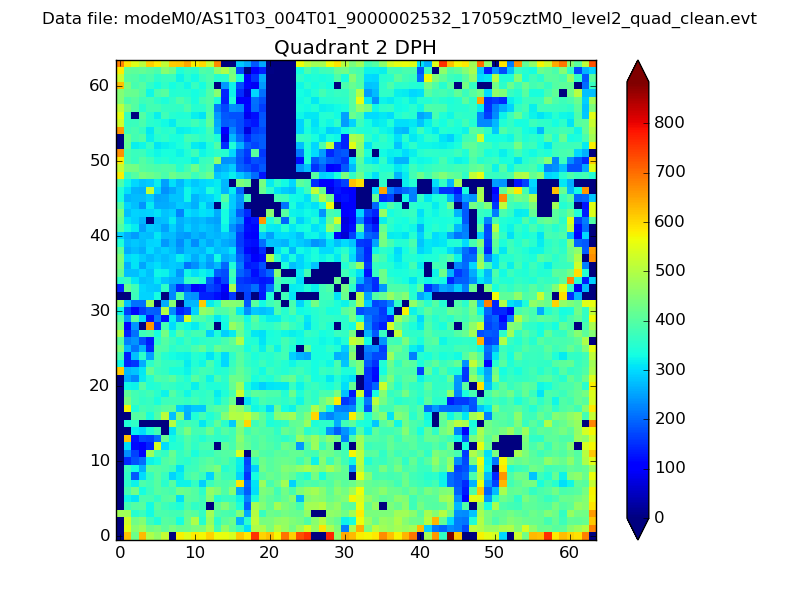
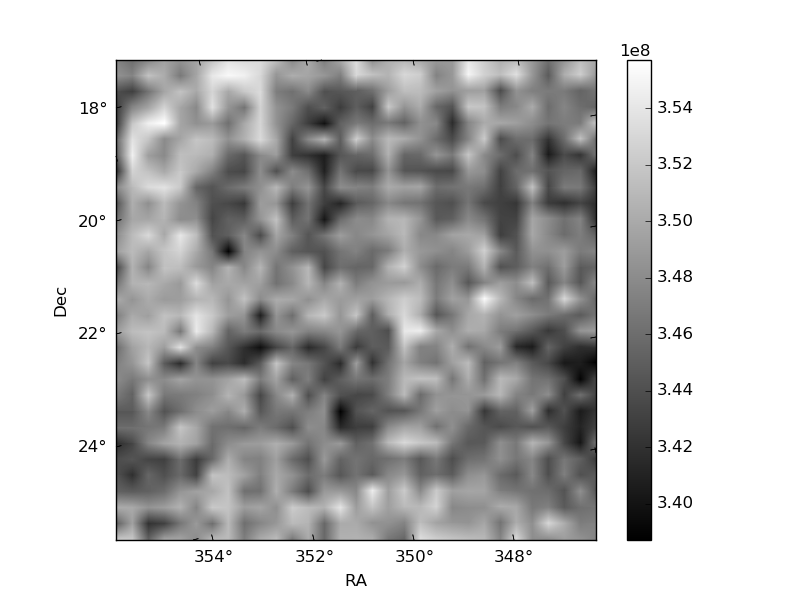
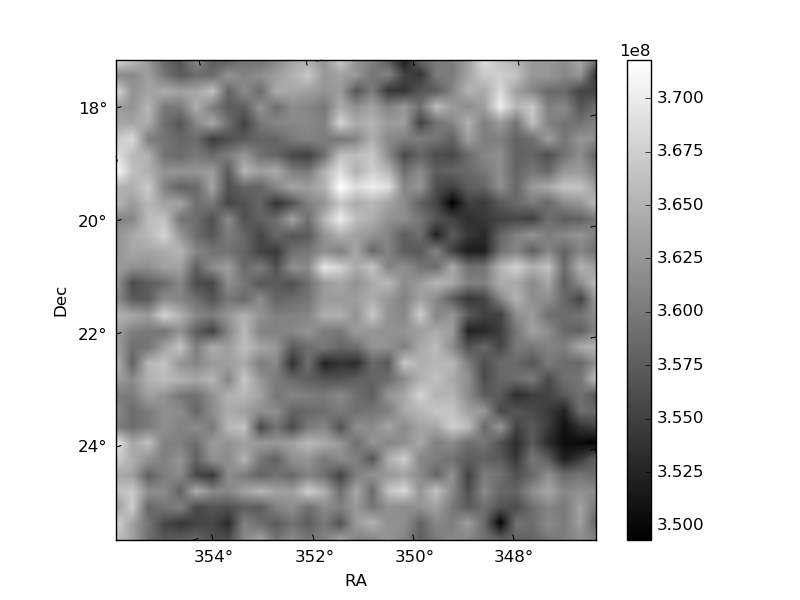
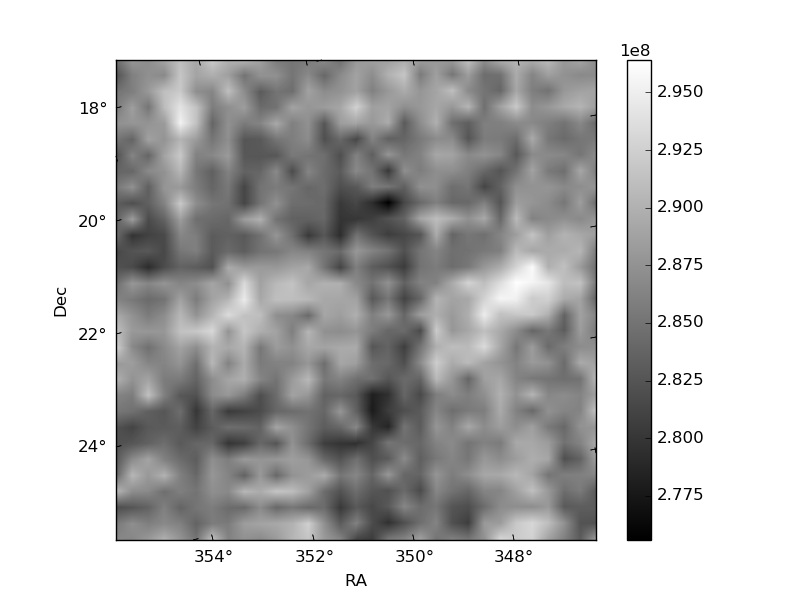
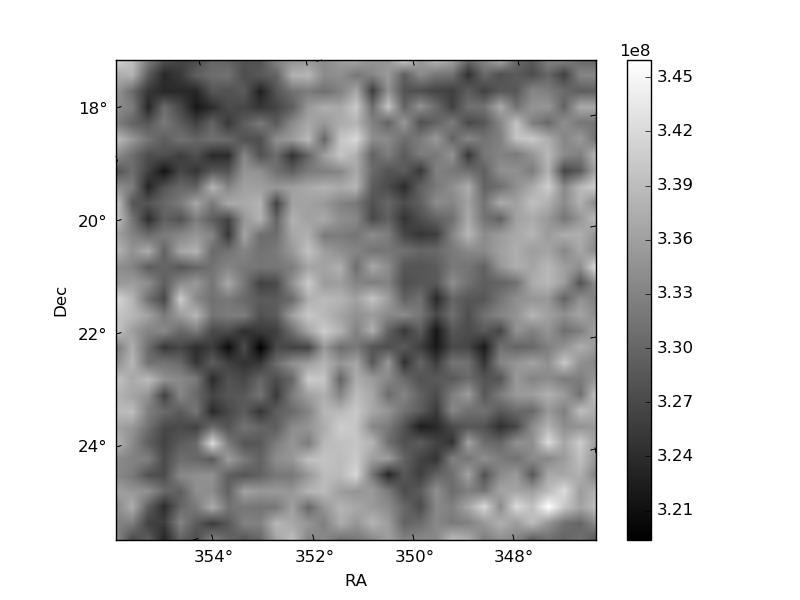
Histogram calculated using DETX and DETY for each event in the final _common_clean file
| Quadrant A | 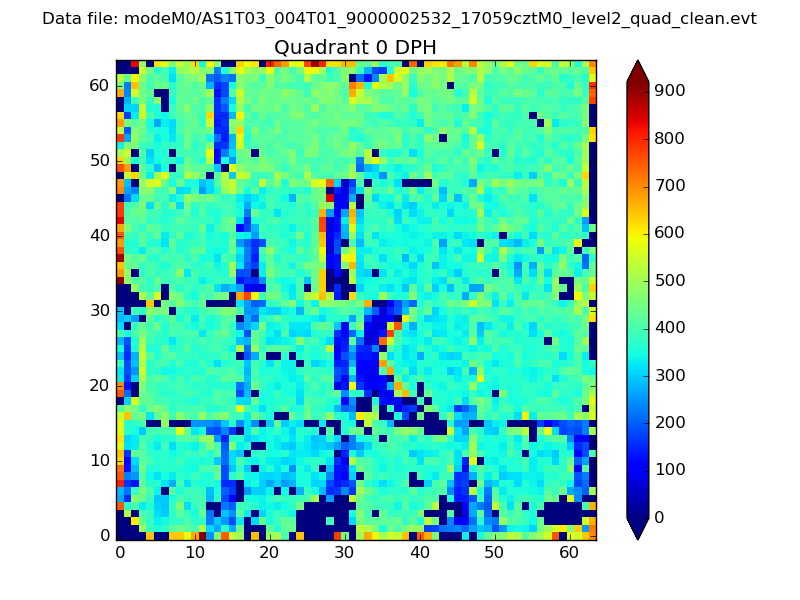 |
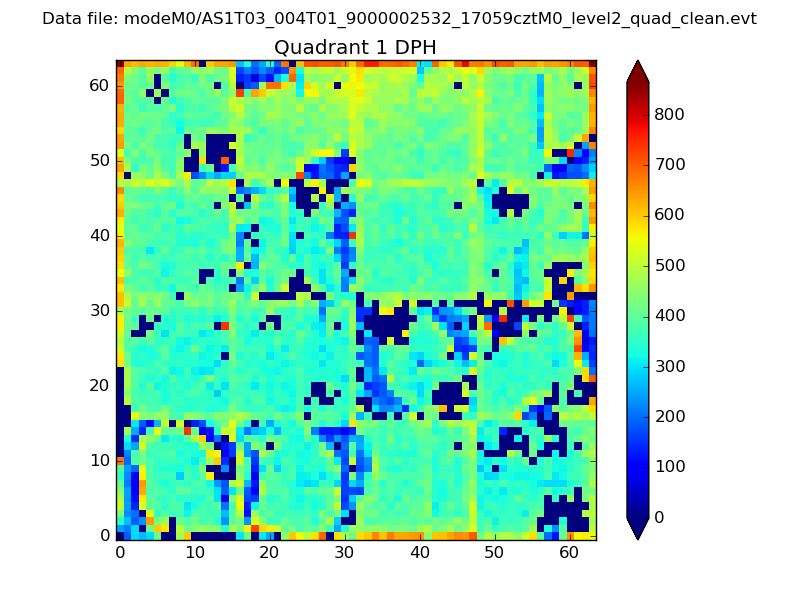 |
Quadrant B |
|---|---|---|---|
| Quadrant D | 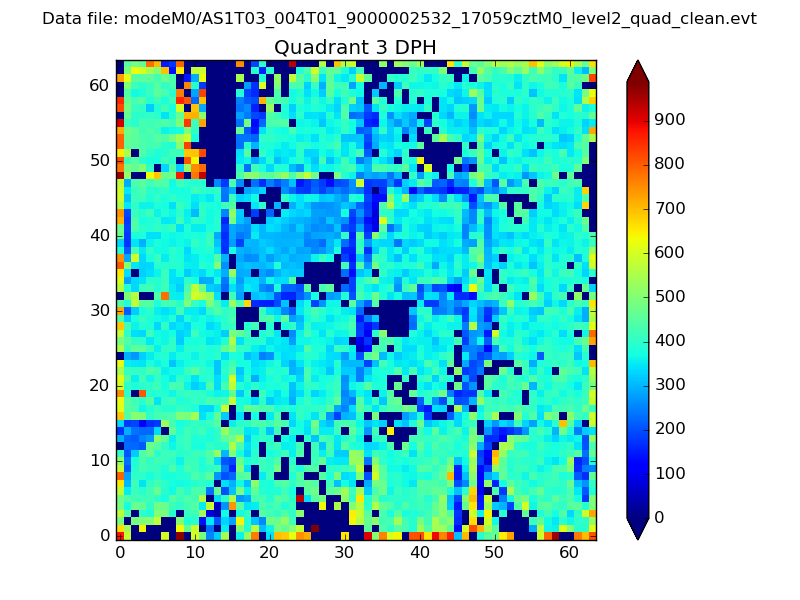 |
 |
Quadrant C |
| Plot type | Count rate plots | Images |
|---|---|---|
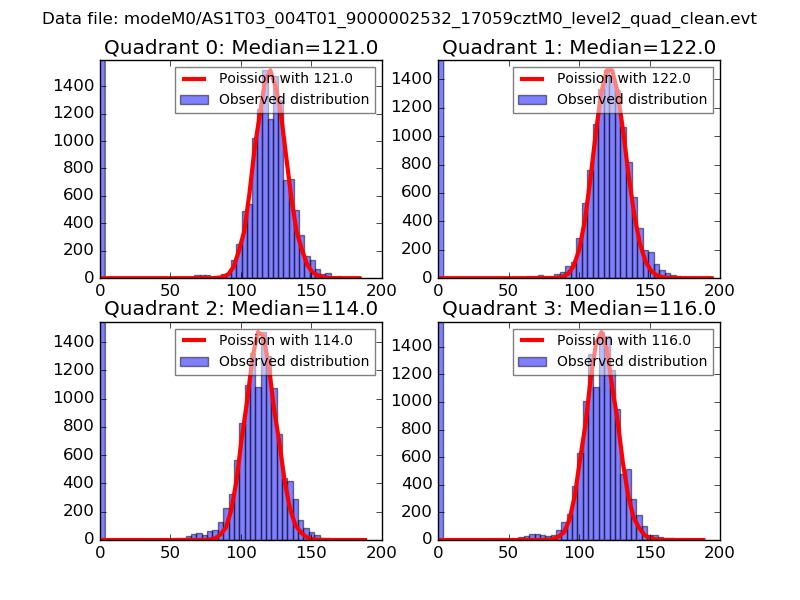
| Comparison with Poisson distribution Blue bars denote a histogram of data divided into 1 sec bins. Red curve is a Poisson curve with rate = median count rate of data. |
 |
 |
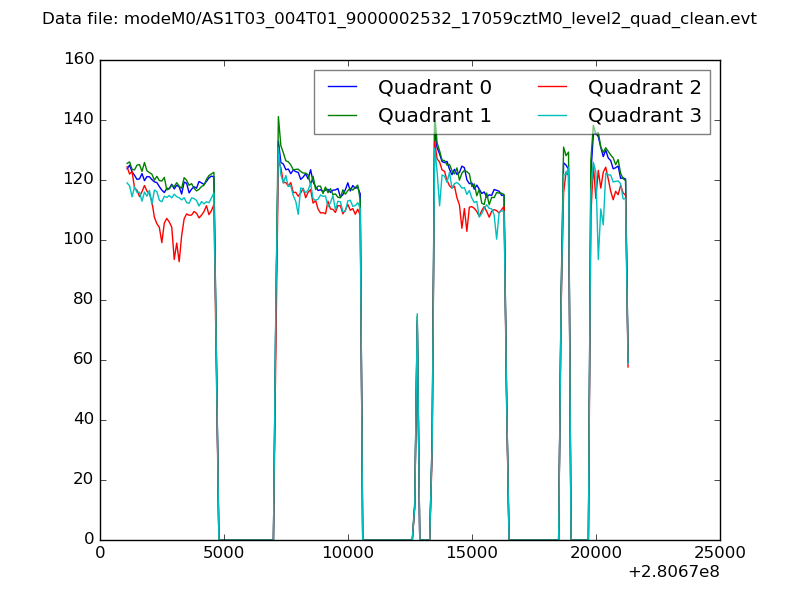
| Quadrant-wise count rates Data is divided into 100 sec bins |
 |
|
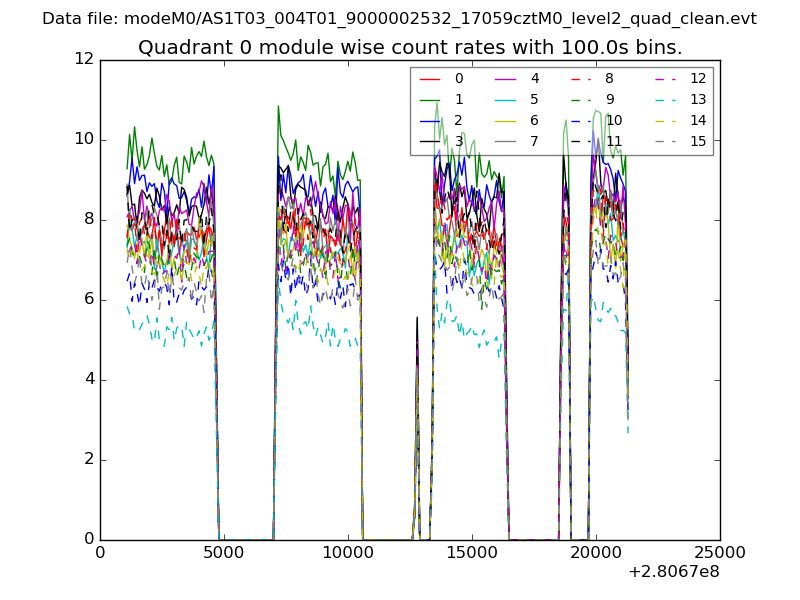
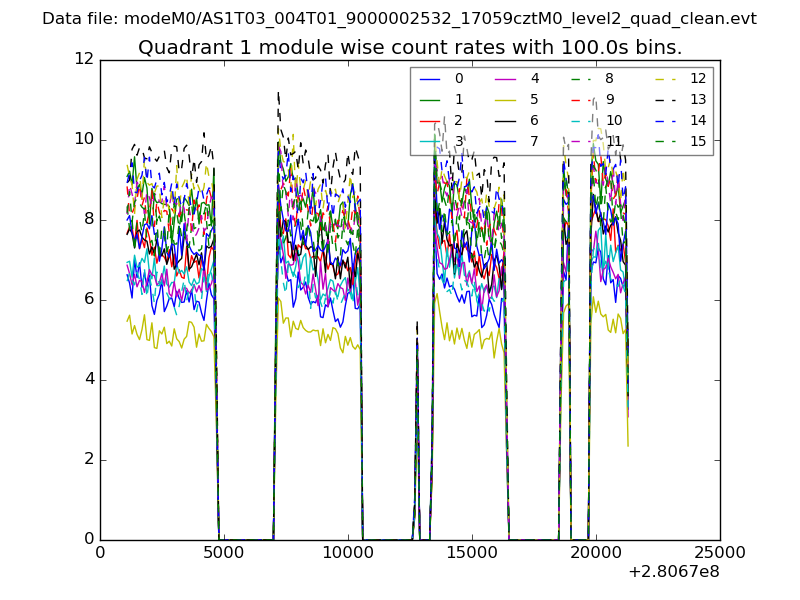
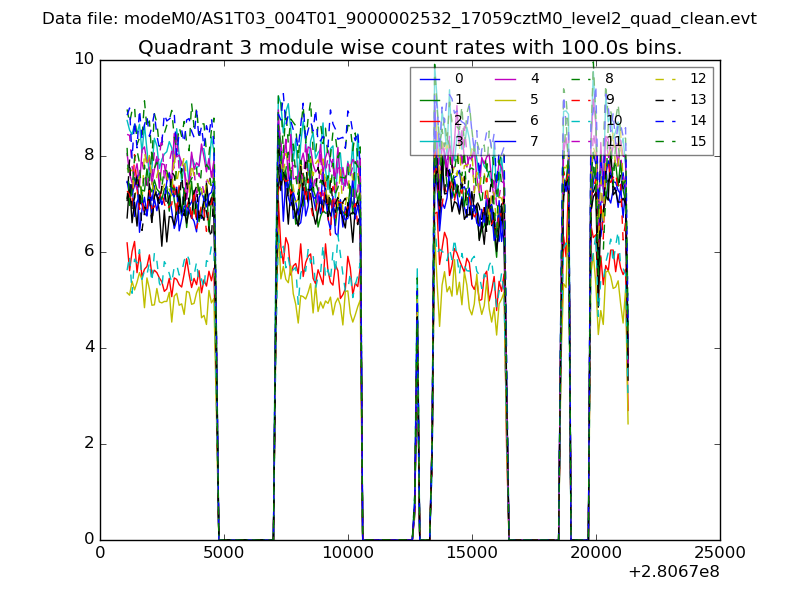
| Module-wise count rates for Quadrant A Data is divided into 100 sec bins |
 |
 |
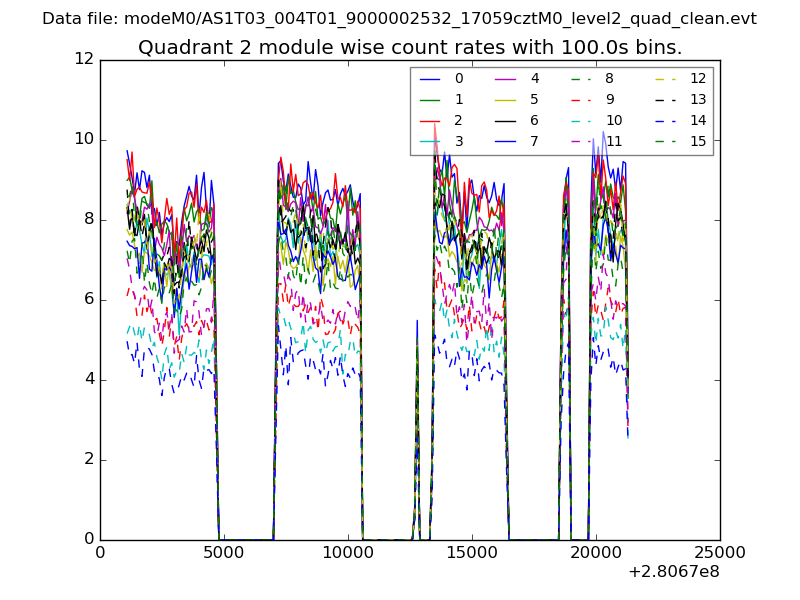
| Module-wise count rates for Quadrant B Data is divided into 100 sec bins |
 |
 |
| Module-wise count rates for Quadrant C Data is divided into 100 sec bins |
 |
 |
| Module-wise count rates for Quadrant D Data is divided into 100 sec bins |
 |
 |
| Parameter | Plot |
|---|---|
| CZT HV Monitor | 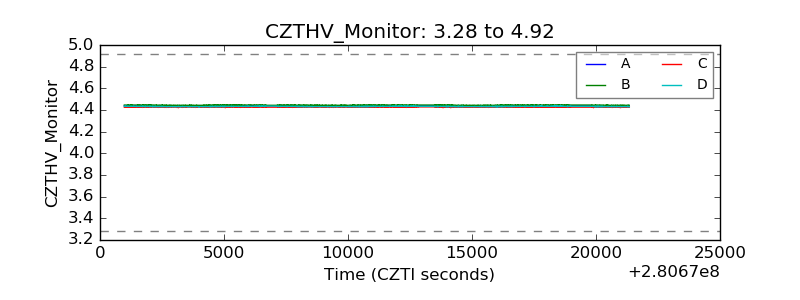 |
| D_VDD | 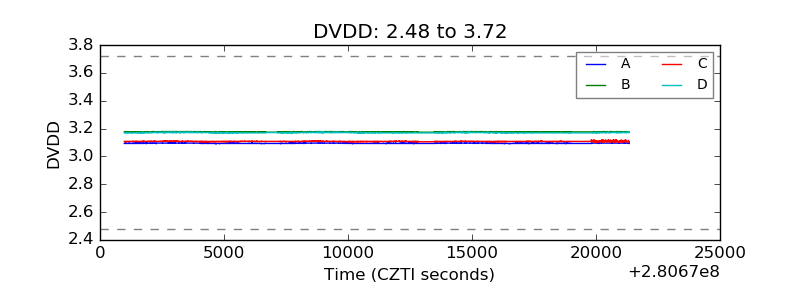 |
| Temperature 1 | 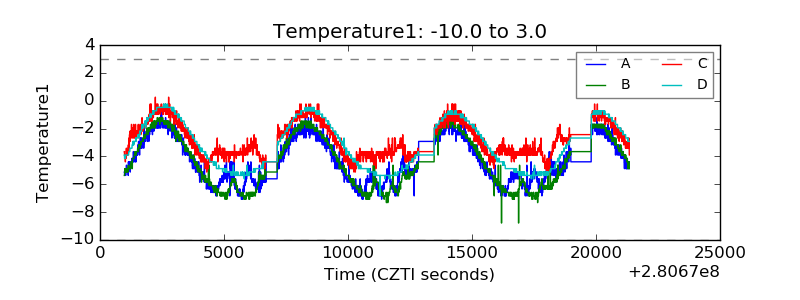 |
| Veto HV Monitor | 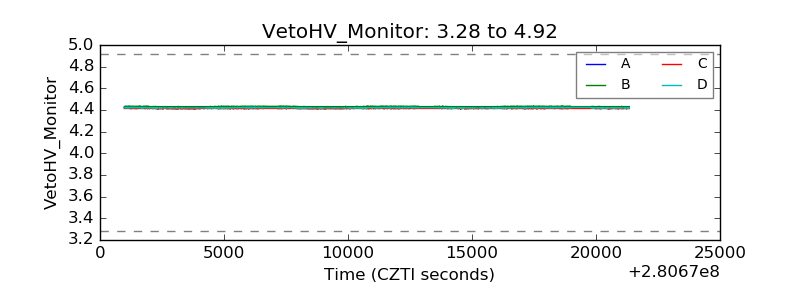 |
| Veto LLD | 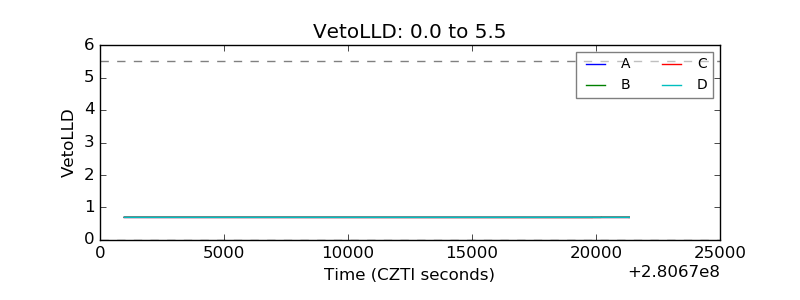 |
| Alpha Counter | 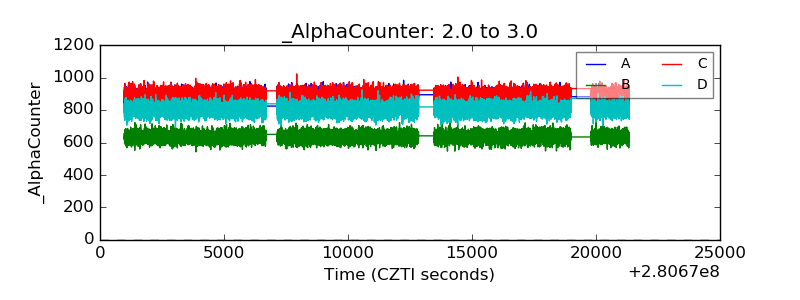 |
| _CPM_Rate | 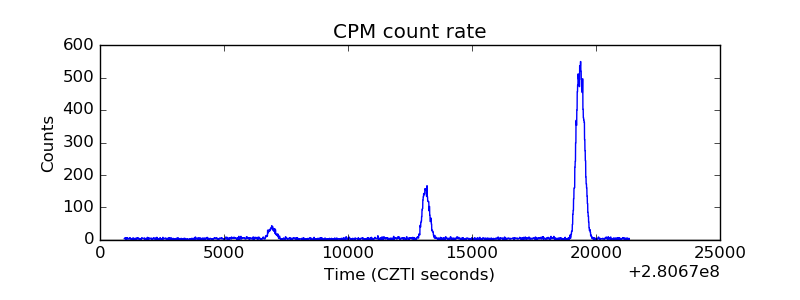 |
| CZT Counter | 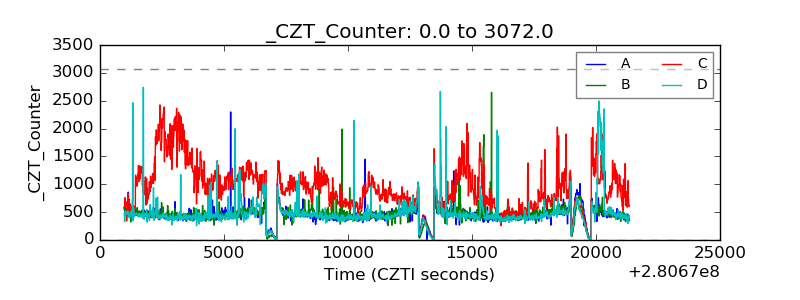 |
| +2.5 Volts monitor |  |
| +5 Volts monitor |  |
| _ROLL_ROT | 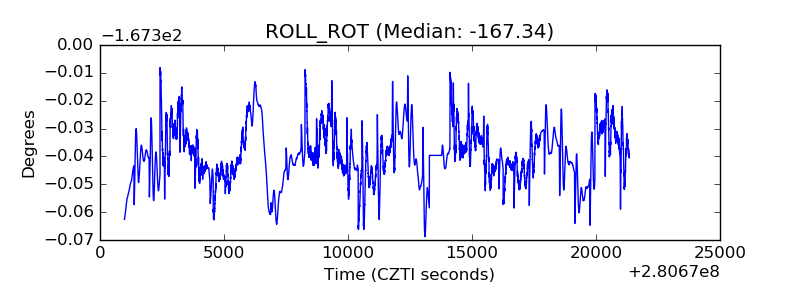 |
| _Roll_DEC | 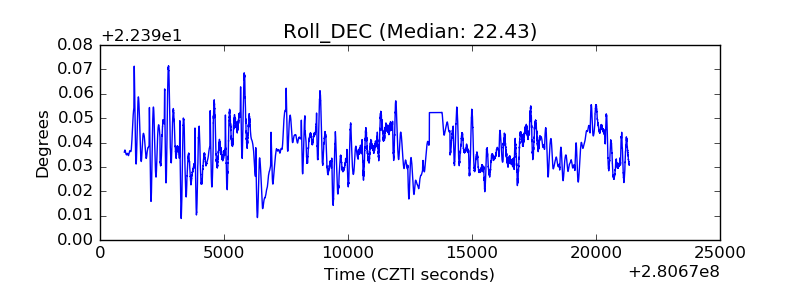 |
| _Roll_RA | 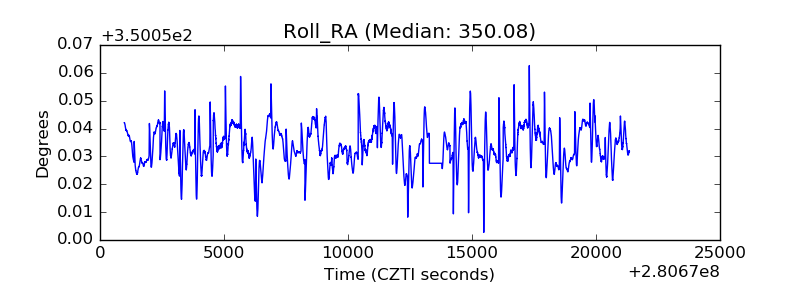 |
| Veto Counter | 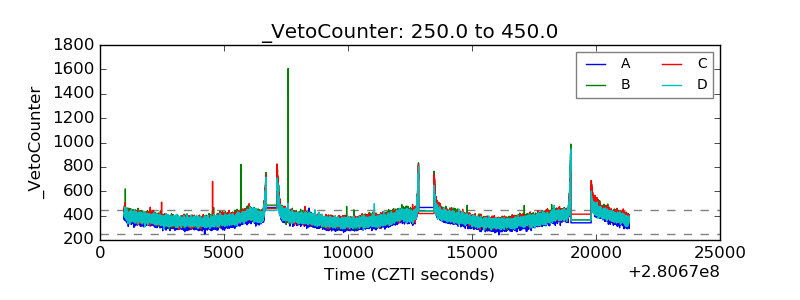 |