| Param | Original file | Final file |
|---|---|---|
| Filename | modeM0/AS1T03_004T01_9000002532_17060cztM0_level2.evt | modeM0/AS1T03_004T01_9000002532_17060cztM0_level2_quad_clean.evt |
| Size (bytes) | 541,820,160 | 86,443,200 |
| Size | 516.7 MB | 82.4 MB |
| Events in quadrant A | 3,040,108 | 559,597 |
| Events in quadrant B | 3,158,048 | 568,086 |
| Events in quadrant C | 6,045,999 | 516,694 |
| Events in quadrant D | 3,720,416 | 515,857 |
| Mode SS | |||
|---|---|---|---|
| Quadrant | BADHDUFLAG | Total packets | Discarded packets |
| A | 0 | 132 | 0 |
| B | 0 | 132 | 0 |
| C | 0 | 132 | 0 |
| D | 0 | 132 | 0 |
| Mode M9 | |||
|---|---|---|---|
| Quadrant | BADHDUFLAG | Total packets | Discarded packets |
| A | 0 | 17 | 0 |
| B | 0 | 18 | 0 |
| C | 0 | 18 | 0 |
| D | 0 | 18 | 0 |
| Mode M0 | |||
|---|---|---|---|
| Quadrant | BADHDUFLAG | Total packets | Discarded packets |
| A | 0 | 13461 | 3 |
| B | 0 | 13681 | 2 |
| C | 0 | 22487 | 2 |
| D | 0 | 15643 | 2 |
| Quadrant | Total seconds | Saturated seconds | Saturation percentage |
|---|---|---|---|
| A | 6557 | 27 | 0.411774% |
| B | 6557 | 44 | 0.671039% |
| C | 6557 | 541 | 8.250724% |
| D | 6557 | 338 | 5.154796% |
Noise dominated data is calculated using 1-second bins in cleaned event files. If a bin has >2000 counts, and if more than 50% of those come from <1% of pixels, then it is considered to be noise-dominated and hence unusable.
| Quadrant | # 1 sec bins | Bins with >0 counts | Bins with >2000 counts | High rate bins dominated by noise | Noise dominated (total time) | Noise dominated (detector-on time) | Marked lightcurve |
|---|---|---|---|---|---|---|---|
| A | 7543 | 6559 | 1 | 1 | 0.01% | 0.02% | 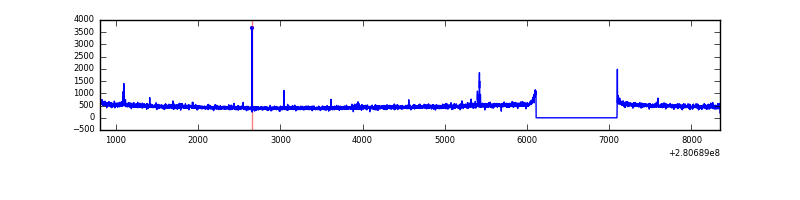 |
| B | 7543 | 6559 | 0 | 0 | 0.00% | 0.00% | 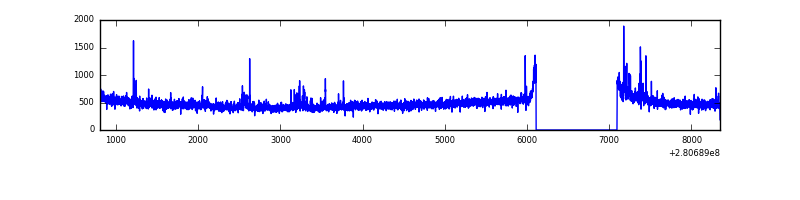 |
| C | 7543 | 6559 | 192 | 192 | 2.55% | 2.93% | 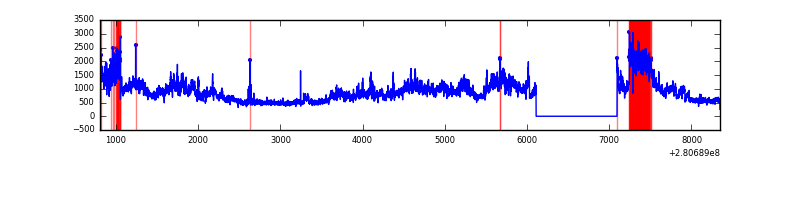 |
| D | 7543 | 6559 | 265 | 265 | 3.51% | 4.04% | 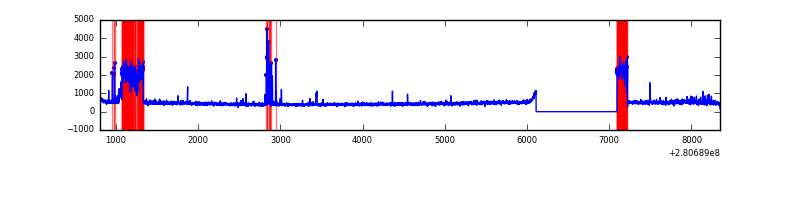 |
Top three noisy pixels from each quadrant. If the there are fewer than three noisy pixels in the level2.evt file, extra rows are filled as -1
| Pixel properties | Quadrant properties | ||||||
|---|---|---|---|---|---|---|---|
| Quadrant | DetID | PixID | Counts | Sigma | Mean | Median | Sigma |
| A | 4 | 2 | 30228 | 187.56 | 779 | 759 | 157.1 |
| A | 0 | 226 | 6947 | 39.38 | 779 | 759 | 157.1 |
| A | 11 | 29 | 6042 | 33.62 | 779 | 759 | 157.1 |
| B | 6 | 36 | 43871 | 286.85 | 781 | 760 | 150.3 |
| B | 0 | 197 | 18551 | 118.38 | 781 | 760 | 150.3 |
| B | 12 | 111 | 17276 | 109.89 | 781 | 760 | 150.3 |
| C | 3 | 233 | 3022854 | 17629.42 | 733 | 739 | 171.4 |
| C | 14 | 238 | 110627 | 641.03 | 733 | 739 | 171.4 |
| C | 9 | 54 | 17809 | 99.58 | 733 | 739 | 171.4 |
| D | 15 | 0 | 714522 | 3935.31 | 745 | 723 | 181.4 |
| D | 10 | 70 | 69695 | 380.26 | 745 | 723 | 181.4 |
| D | 5 | 222 | 45834 | 248.71 | 745 | 723 | 181.4 |
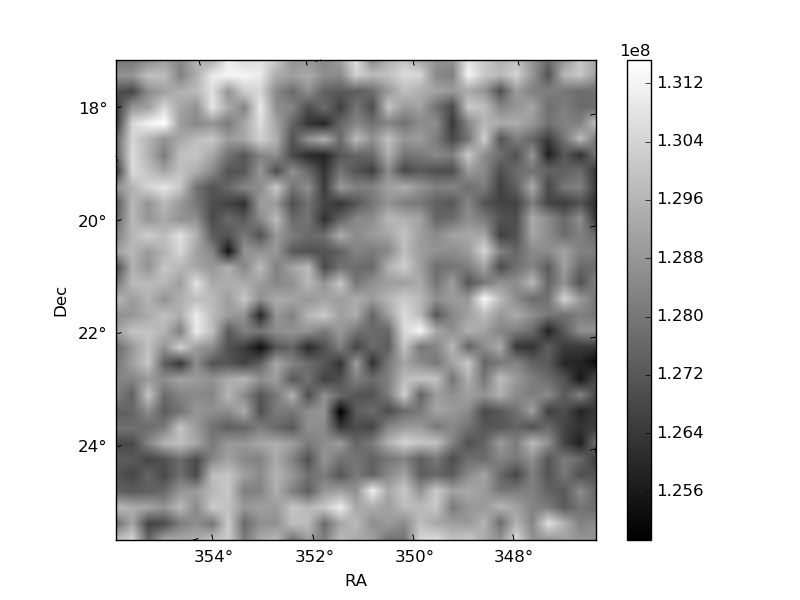
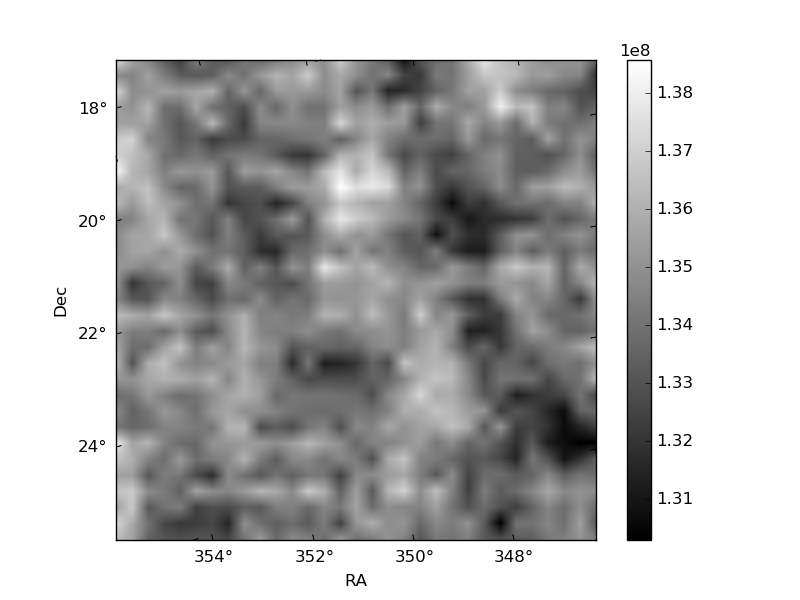
Histogram calculated using DETX and DETY for each event in the final _common_clean file
| Quadrant A |  |
 |
Quadrant B |
|---|---|---|---|
| Quadrant D |  |
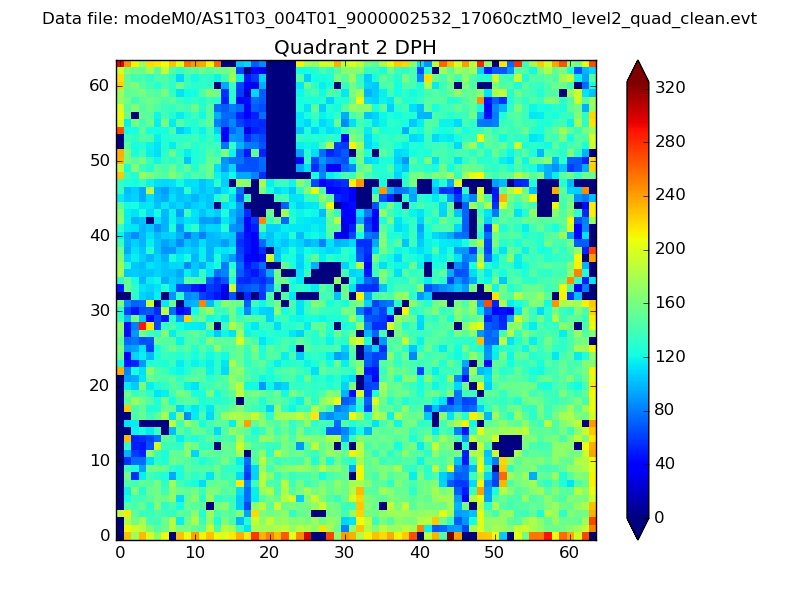 |
Quadrant C |
| Plot type | Count rate plots | Images |
|---|---|---|
| Comparison with Poisson distribution Blue bars denote a histogram of data divided into 1 sec bins. Red curve is a Poisson curve with rate = median count rate of data. |
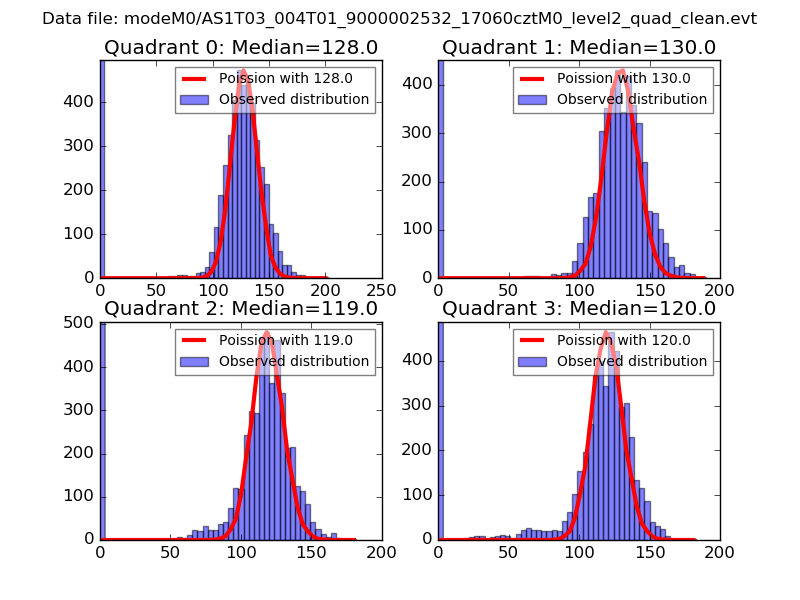 |
 |
| Quadrant-wise count rates Data is divided into 100 sec bins |
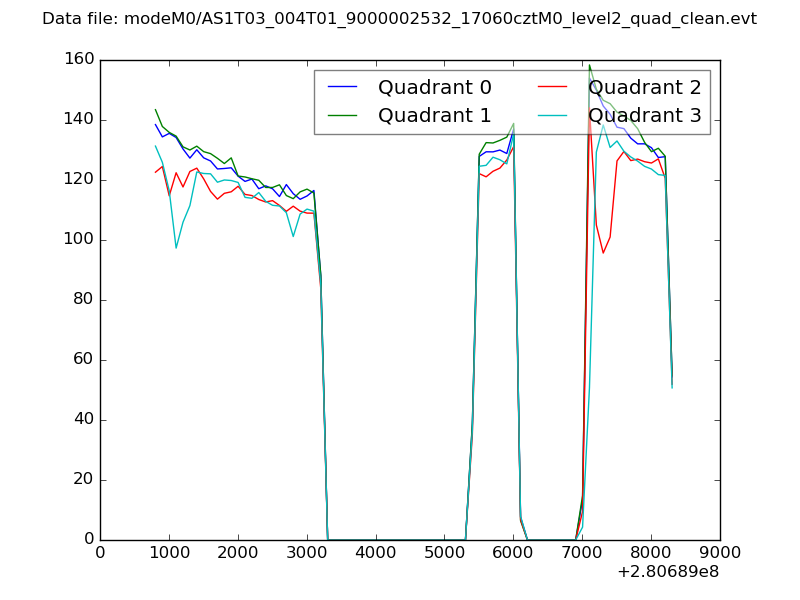 |
|
| Module-wise count rates for Quadrant A Data is divided into 100 sec bins |
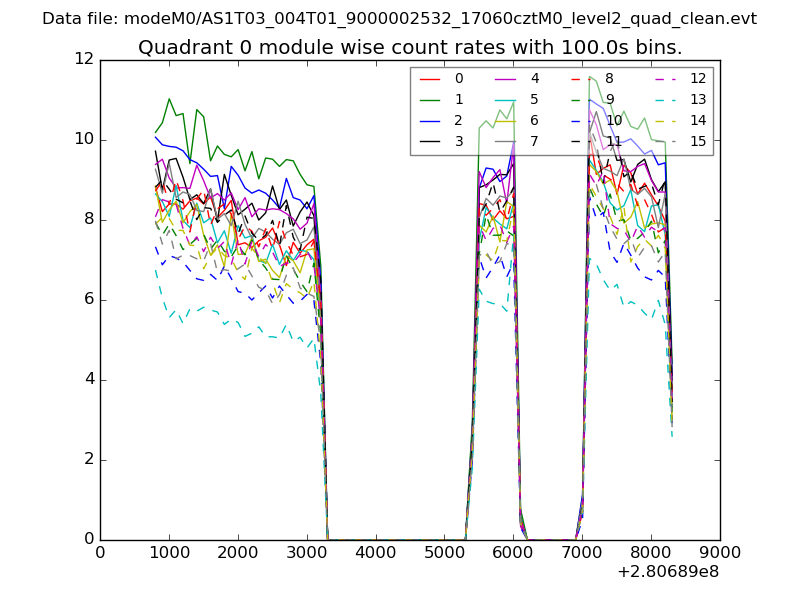 |
 |
| Module-wise count rates for Quadrant B Data is divided into 100 sec bins |
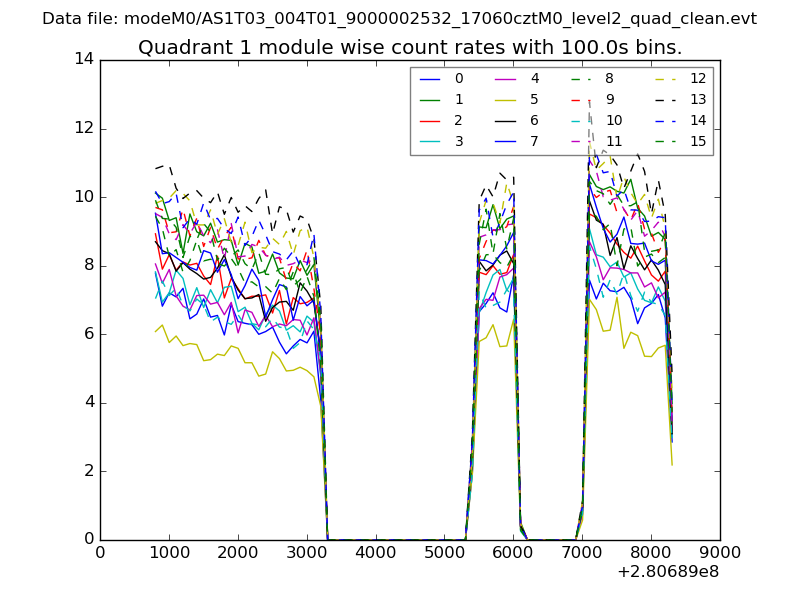 |
 |
| Module-wise count rates for Quadrant C Data is divided into 100 sec bins |
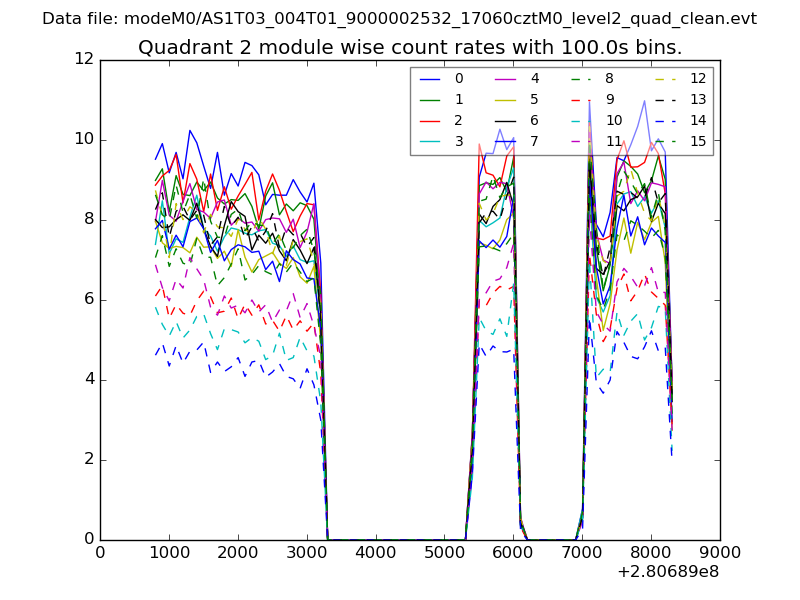 |
 |
| Module-wise count rates for Quadrant D Data is divided into 100 sec bins |
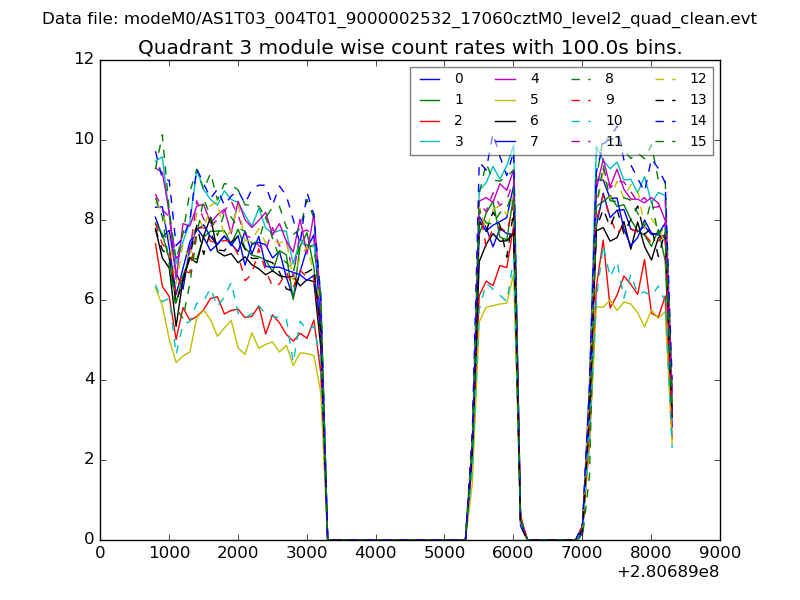 |
 |
| Parameter | Plot |
|---|---|
| CZT HV Monitor | 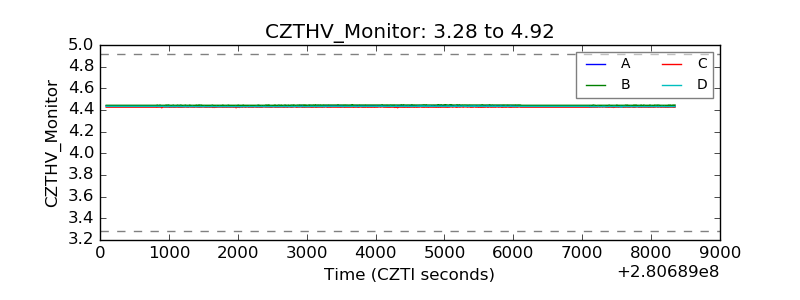 |
| D_VDD | 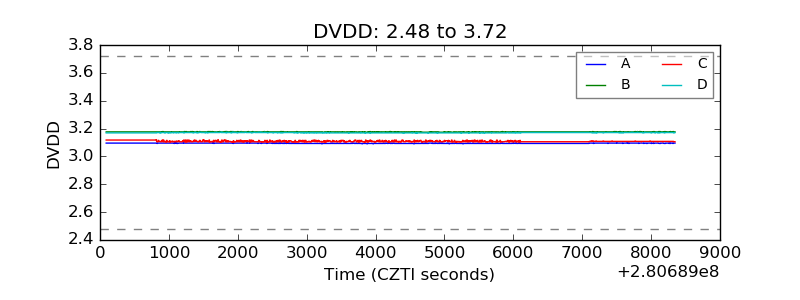 |
| Temperature 1 | 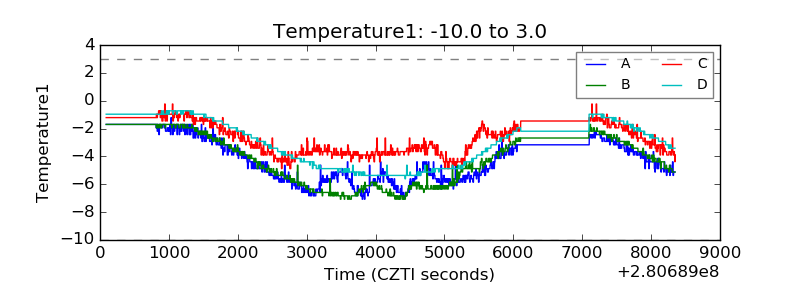 |
| Veto HV Monitor | 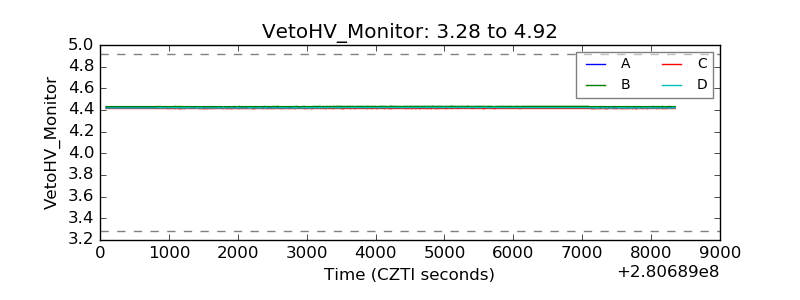 |
| Veto LLD |  |
| Alpha Counter | 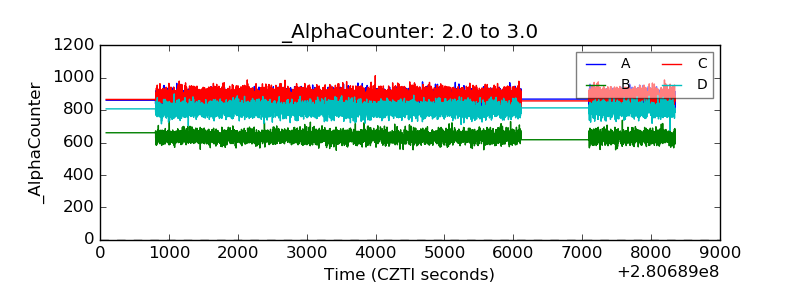 |
| _CPM_Rate | 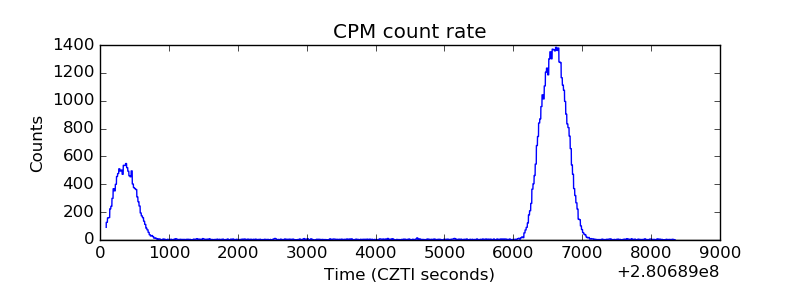 |
| CZT Counter | 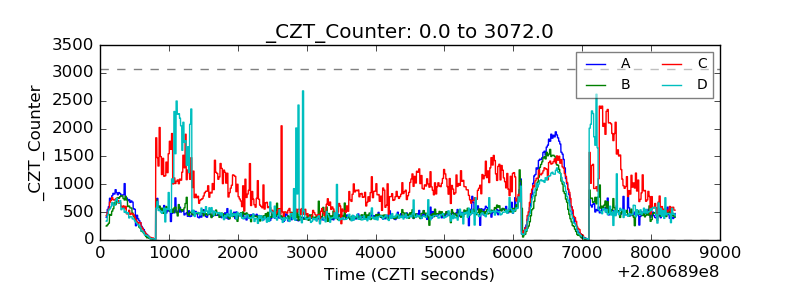 |
| +2.5 Volts monitor |  |
| +5 Volts monitor | 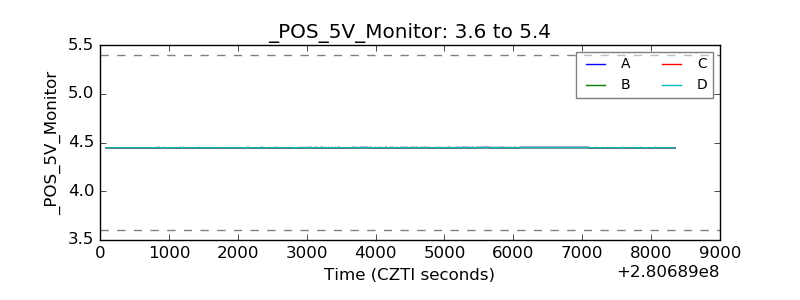 |
| _ROLL_ROT | 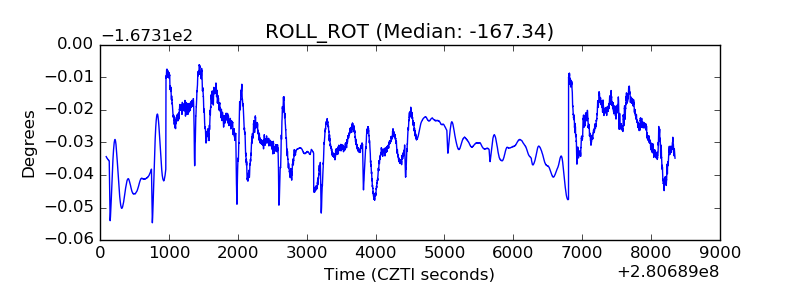 |
| _Roll_DEC | 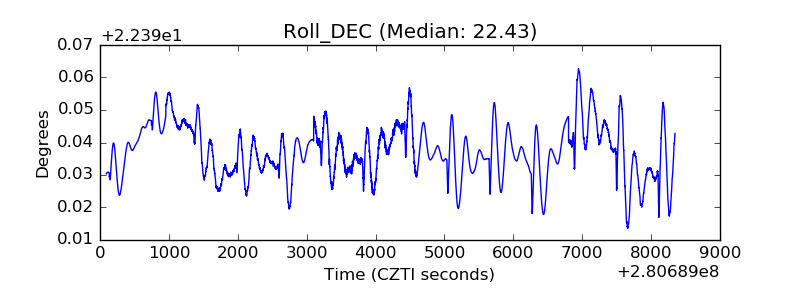 |
| _Roll_RA | 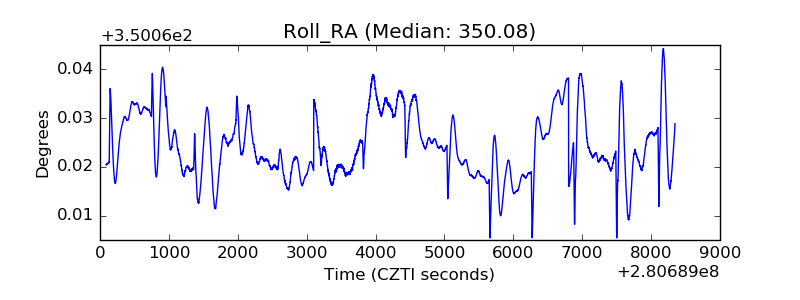 |
| Veto Counter | 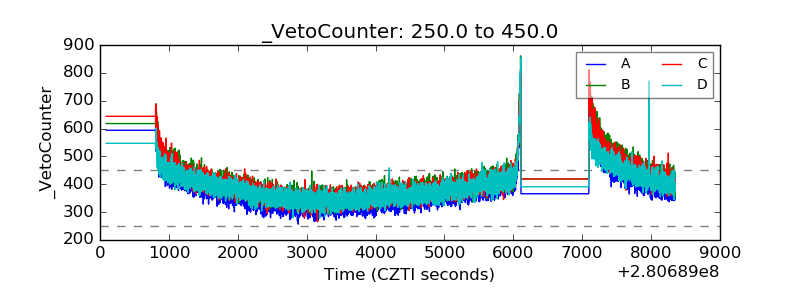 |