| Param | Original file | Final file |
|---|---|---|
| Filename | modeM0/AS1T03_004T01_9000002532_17062cztM0_level2.evt | modeM0/AS1T03_004T01_9000002532_17062cztM0_level2_quad_clean.evt |
| Size (bytes) | 502,269,120 | 93,631,680 |
| Size | 479.0 MB | 89.3 MB |
| Events in quadrant A | 3,172,986 | 608,144 |
| Events in quadrant B | 3,405,373 | 620,377 |
| Events in quadrant C | 4,695,760 | 573,361 |
| Events in quadrant D | 3,483,187 | 567,314 |
| Mode SS | |||
|---|---|---|---|
| Quadrant | BADHDUFLAG | Total packets | Discarded packets |
| A | 0 | 136 | 0 |
| B | 0 | 136 | 0 |
| C | 0 | 136 | 0 |
| D | 0 | 136 | 0 |
| Mode M9 | |||
|---|---|---|---|
| Quadrant | BADHDUFLAG | Total packets | Discarded packets |
| A | 0 | 22 | 0 |
| B | 0 | 22 | 0 |
| C | 0 | 22 | 0 |
| D | 0 | 22 | 0 |
| Mode M0 | |||
|---|---|---|---|
| Quadrant | BADHDUFLAG | Total packets | Discarded packets |
| A | 0 | 13813 | 2 |
| B | 0 | 14460 | 2 |
| C | 0 | 18362 | 2 |
| D | 0 | 14895 | 2 |
| Quadrant | Total seconds | Saturated seconds | Saturation percentage |
|---|---|---|---|
| A | 6691 | 49 | 0.732327% |
| B | 6692 | 76 | 1.135684% |
| C | 6692 | 401 | 5.992230% |
| D | 6692 | 178 | 2.659892% |
Noise dominated data is calculated using 1-second bins in cleaned event files. If a bin has >2000 counts, and if more than 50% of those come from <1% of pixels, then it is considered to be noise-dominated and hence unusable.
| Quadrant | # 1 sec bins | Bins with >0 counts | Bins with >2000 counts | High rate bins dominated by noise | Noise dominated (total time) | Noise dominated (detector-on time) | Marked lightcurve |
|---|---|---|---|---|---|---|---|
| A | 8812 | 6694 | 0 | 0 | 0.00% | 0.00% | 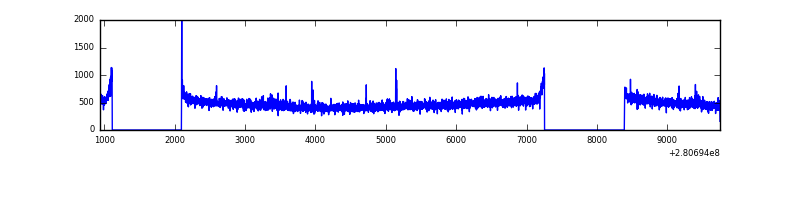 |
| B | 8813 | 6695 | 1 | 1 | 0.01% | 0.01% | 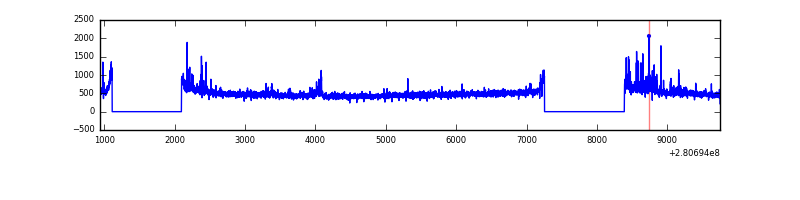 |
| C | 8813 | 6695 | 165 | 165 | 1.87% | 2.46% | 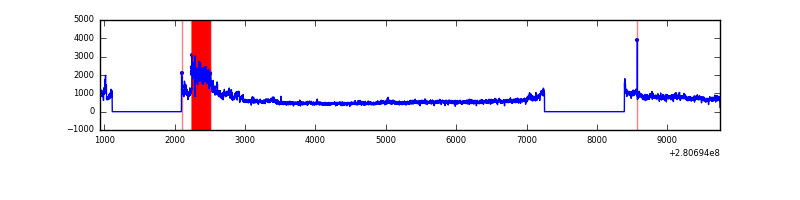 |
| D | 8813 | 6695 | 146 | 146 | 1.66% | 2.18% | 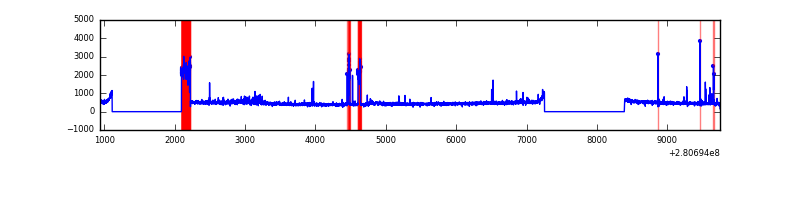 |
Top three noisy pixels from each quadrant. If the there are fewer than three noisy pixels in the level2.evt file, extra rows are filled as -1
| Pixel properties | Quadrant properties | ||||||
|---|---|---|---|---|---|---|---|
| Quadrant | DetID | PixID | Counts | Sigma | Mean | Median | Sigma |
| A | 12 | 189 | 16952 | 97.77 | 817 | 800 | 165.2 |
| A | 4 | 2 | 13116 | 74.55 | 817 | 800 | 165.2 |
| A | 0 | 226 | 7179 | 38.61 | 817 | 800 | 165.2 |
| B | 6 | 36 | 103195 | 659.51 | 819 | 797 | 155.3 |
| B | 0 | 197 | 30801 | 193.25 | 819 | 797 | 155.3 |
| B | 0 | 219 | 27835 | 174.14 | 819 | 797 | 155.3 |
| C | 3 | 233 | 1539902 | 8503.46 | 775 | 779 | 181.0 |
| C | 14 | 238 | 118619 | 651.05 | 775 | 779 | 181.0 |
| C | 9 | 160 | 8011 | 39.96 | 775 | 779 | 181.0 |
| D | 15 | 0 | 256266 | 1339.66 | 784 | 762 | 190.7 |
| D | 1 | 52 | 138130 | 720.25 | 784 | 762 | 190.7 |
| D | 5 | 222 | 70070 | 363.4 | 784 | 762 | 190.7 |
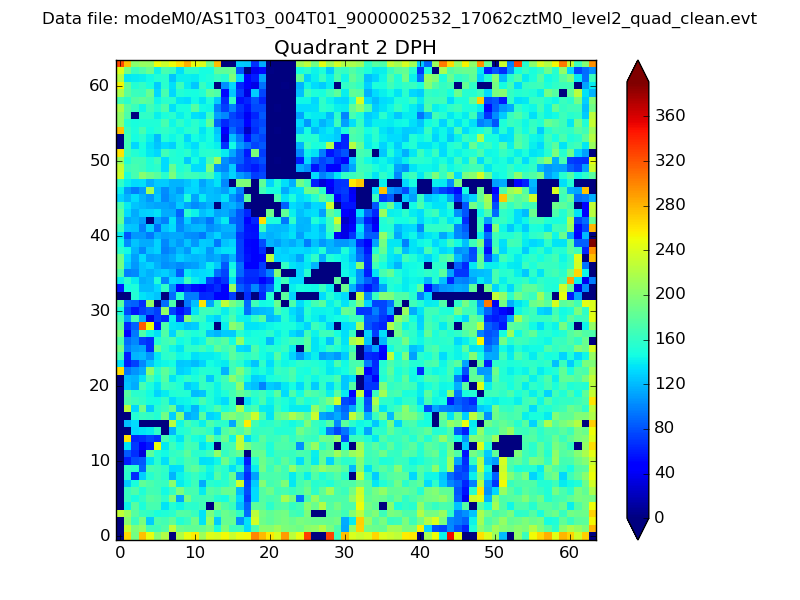
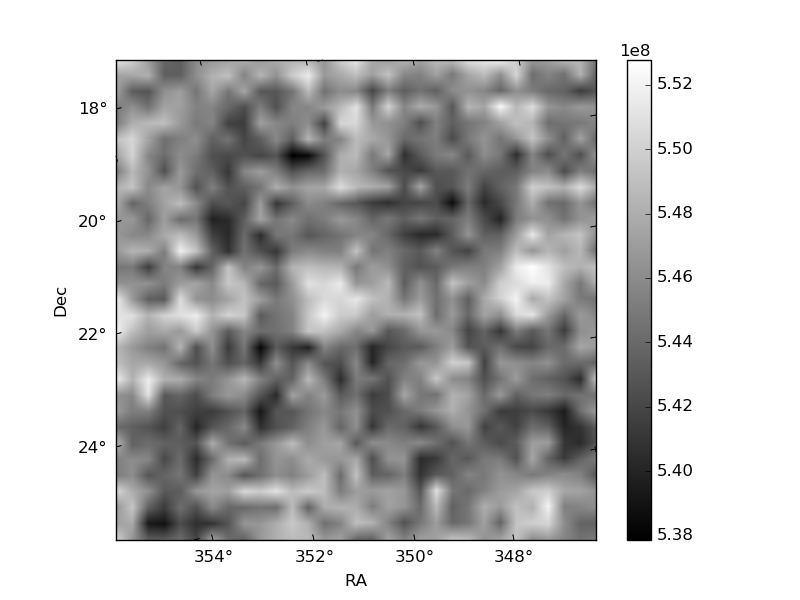
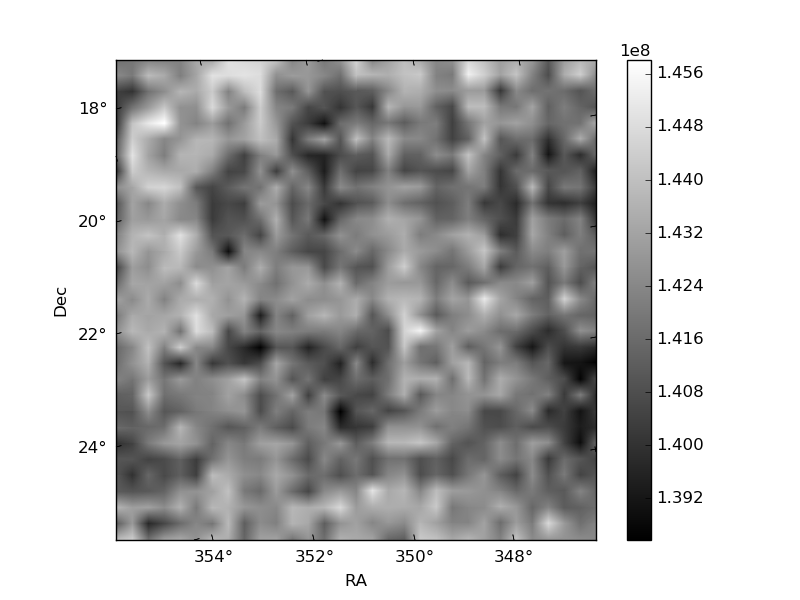
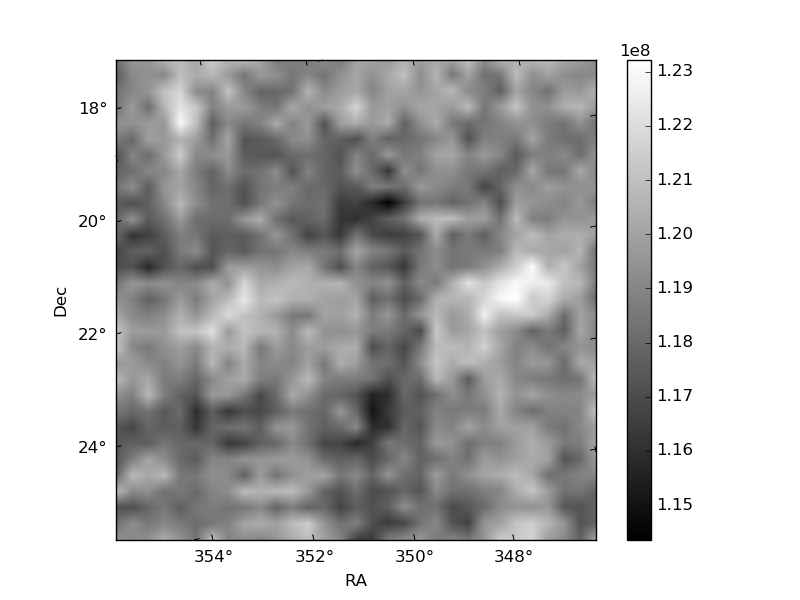
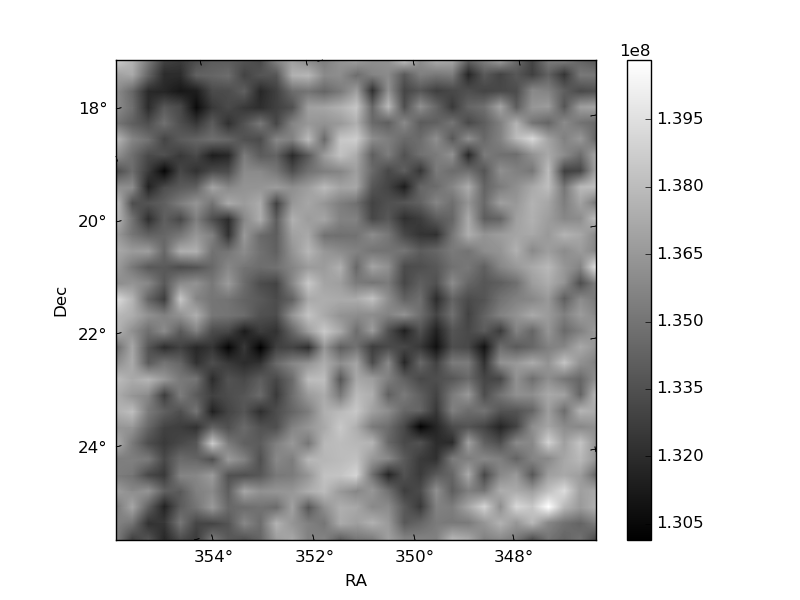
Histogram calculated using DETX and DETY for each event in the final _common_clean file
| Quadrant A | 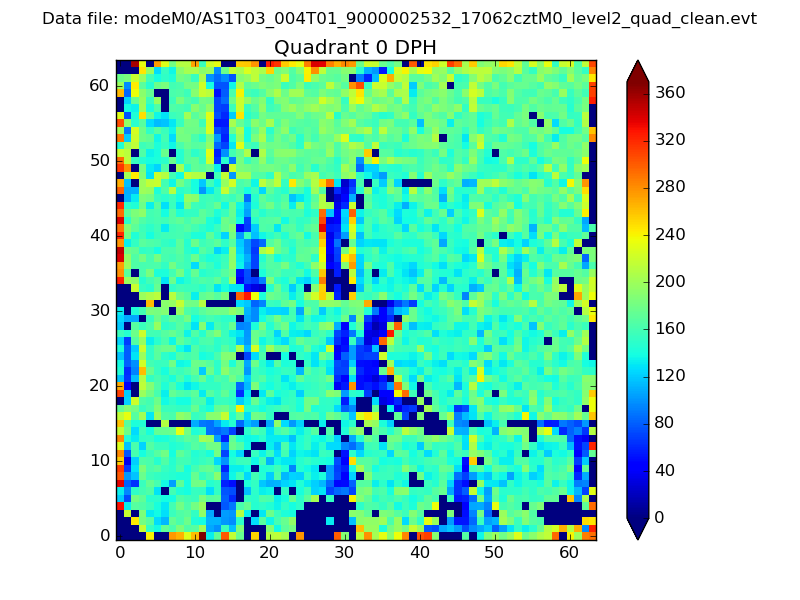 |
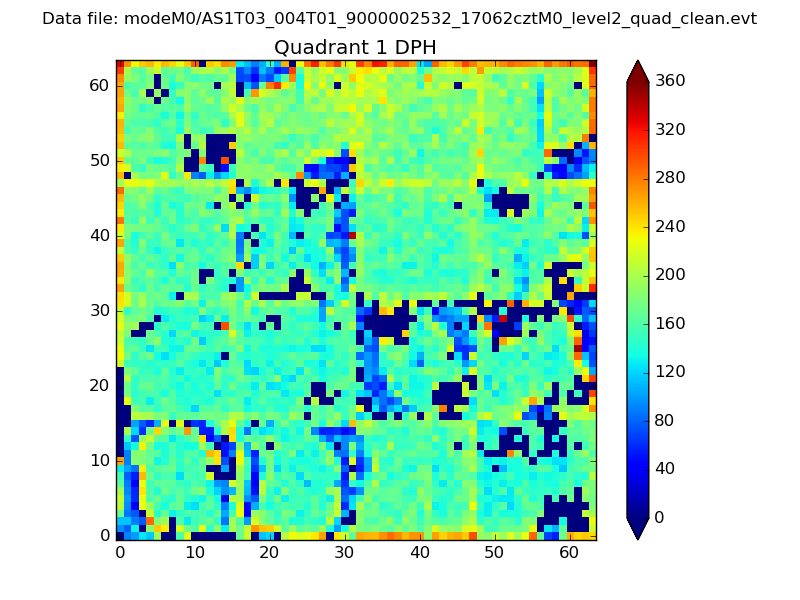 |
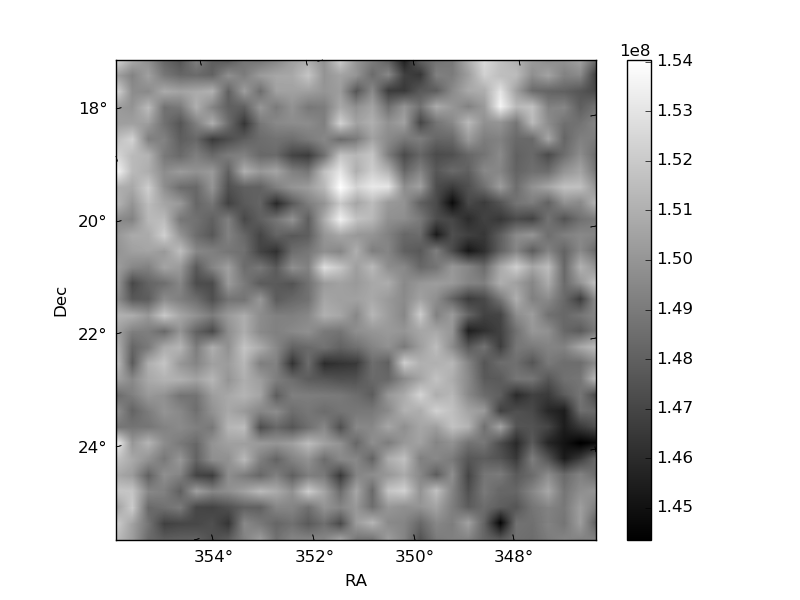
Quadrant B |
|---|---|---|---|
| Quadrant D | 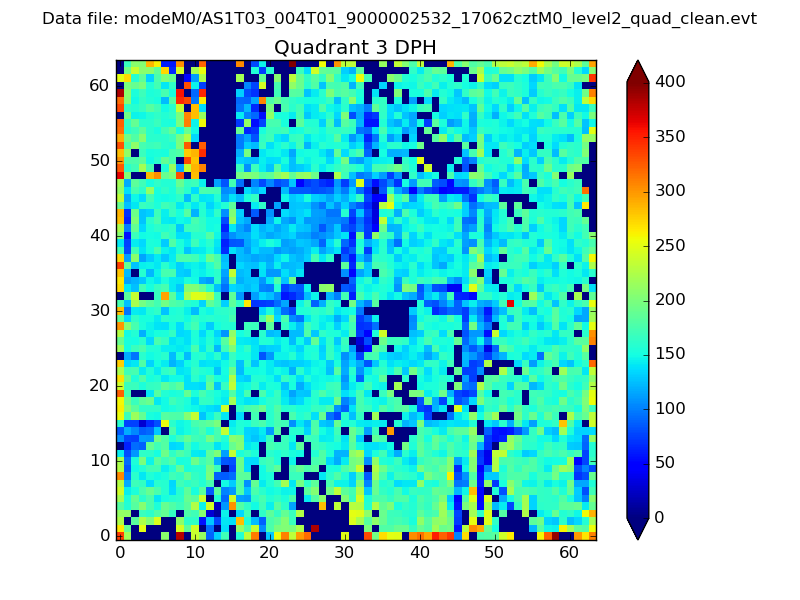 |
 |
Quadrant C |
| Plot type | Count rate plots | Images |
|---|---|---|
| Comparison with Poisson distribution Blue bars denote a histogram of data divided into 1 sec bins. Red curve is a Poisson curve with rate = median count rate of data. |
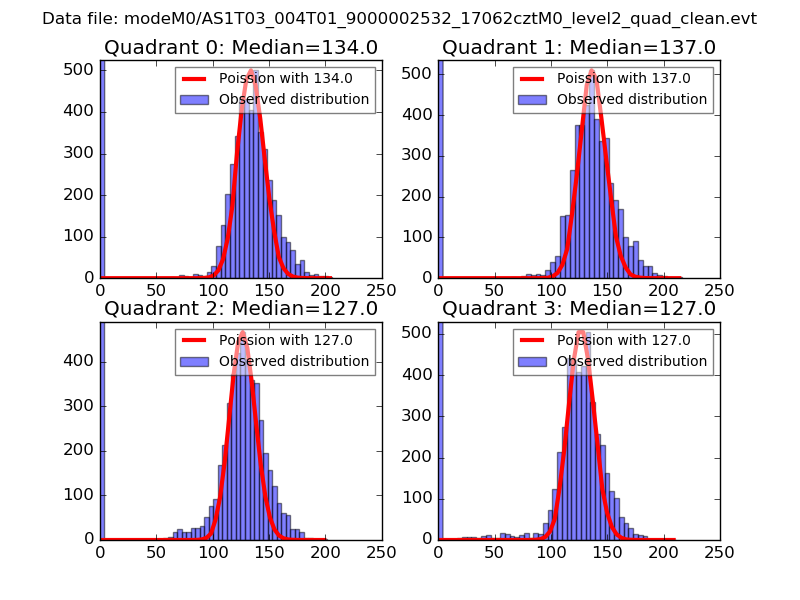 |
 |
| Quadrant-wise count rates Data is divided into 100 sec bins |
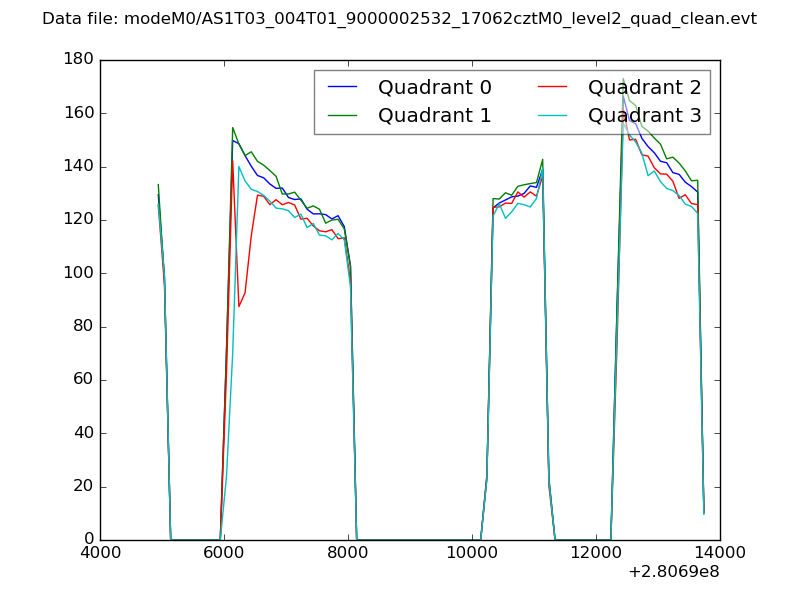 |
|
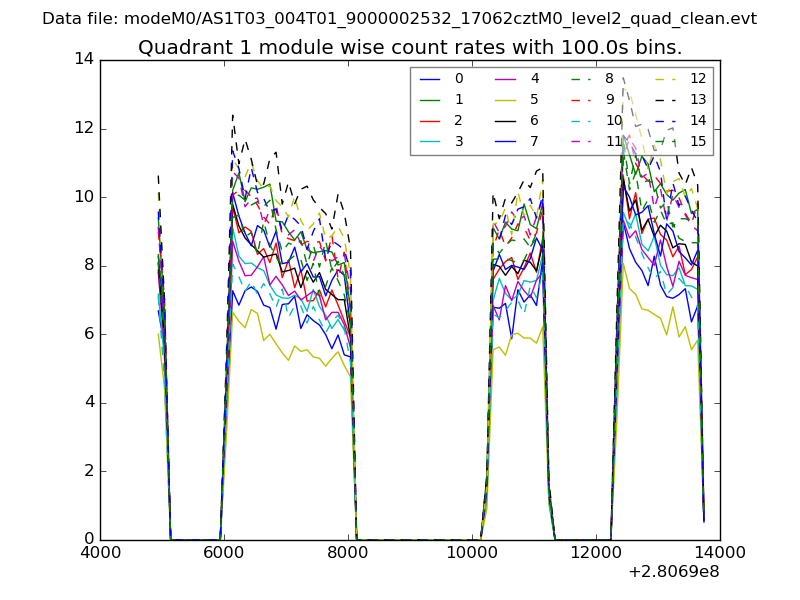
| Module-wise count rates for Quadrant A Data is divided into 100 sec bins |
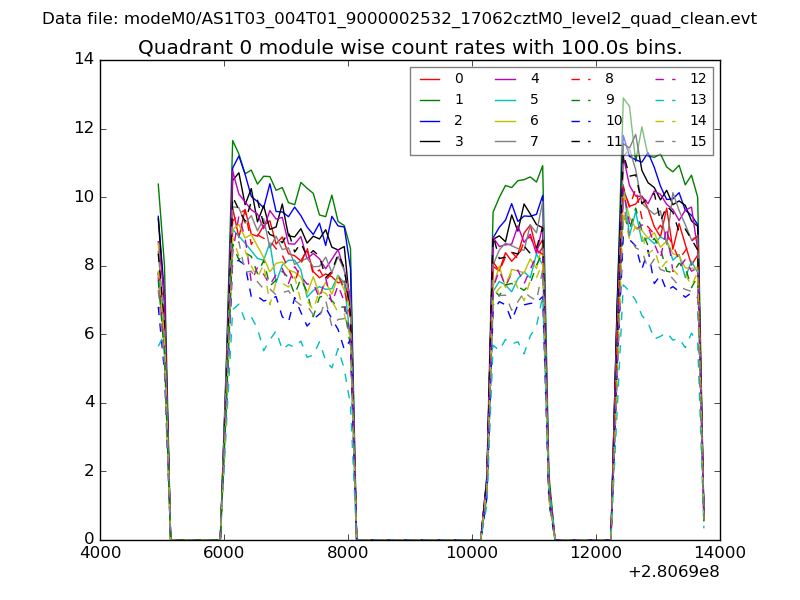 |
 |
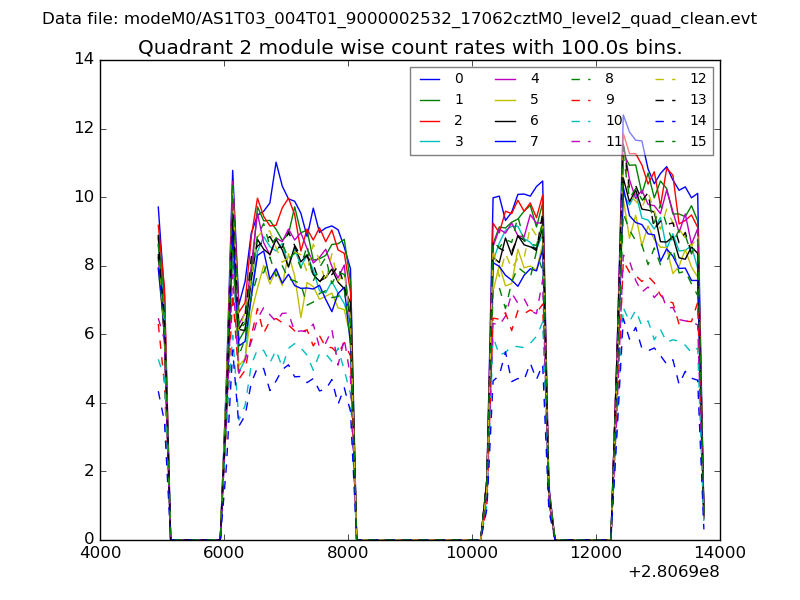
| Module-wise count rates for Quadrant B Data is divided into 100 sec bins |
 |
 |
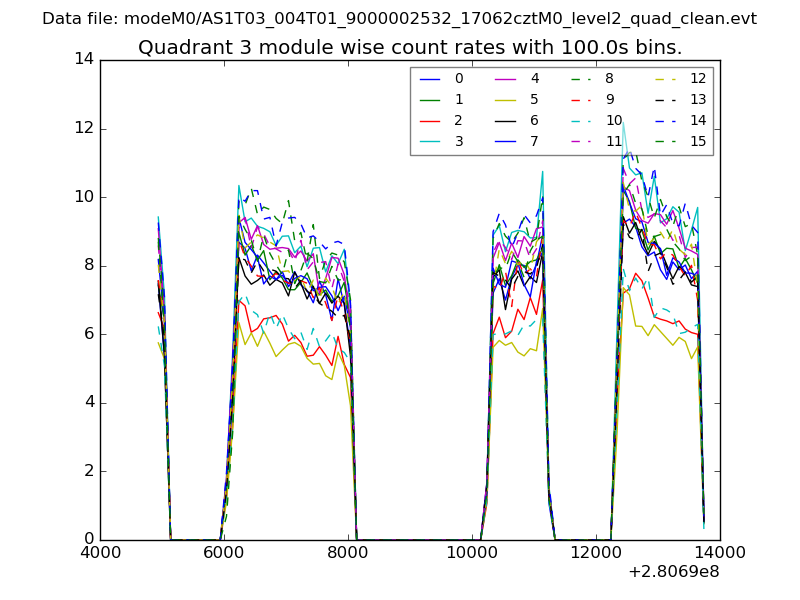
| Module-wise count rates for Quadrant C Data is divided into 100 sec bins |
 |
 |
| Module-wise count rates for Quadrant D Data is divided into 100 sec bins |
 |
 |
| Parameter | Plot |
|---|---|
| CZT HV Monitor | 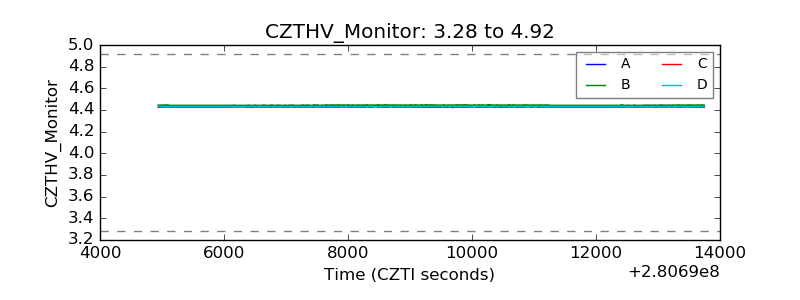 |
| D_VDD | 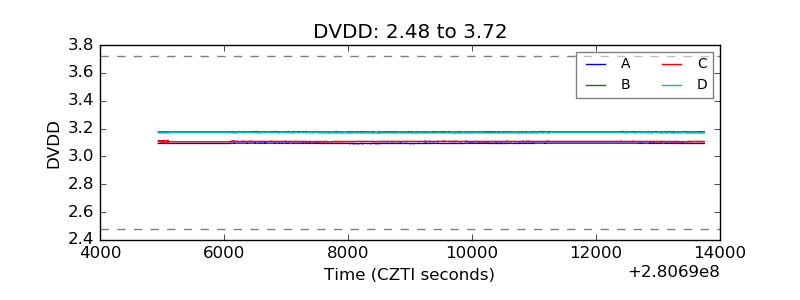 |
| Temperature 1 | 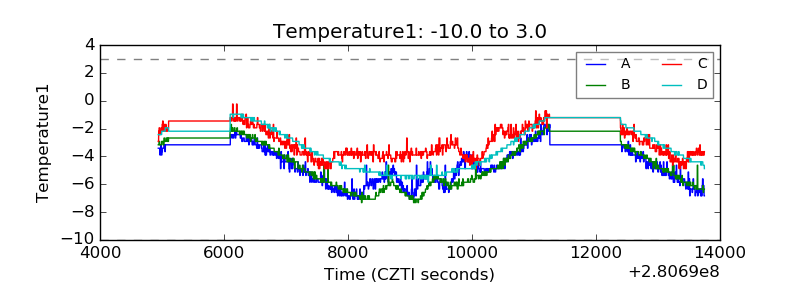 |
| Veto HV Monitor | 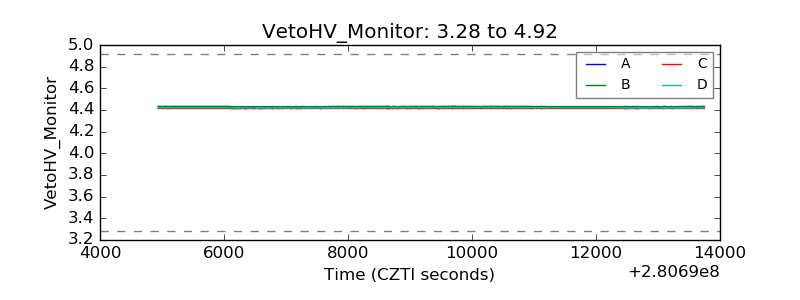 |
| Veto LLD | 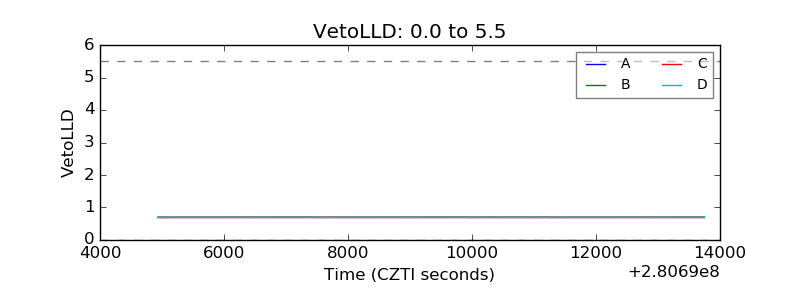 |
| Alpha Counter | 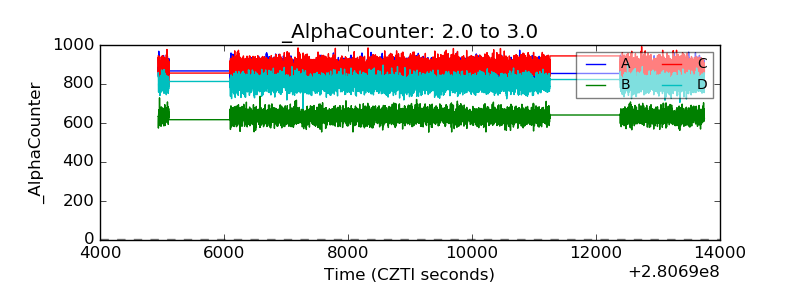 |
| _CPM_Rate | 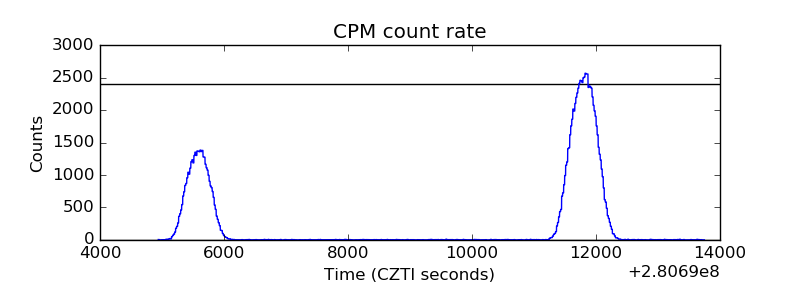 |
| CZT Counter | 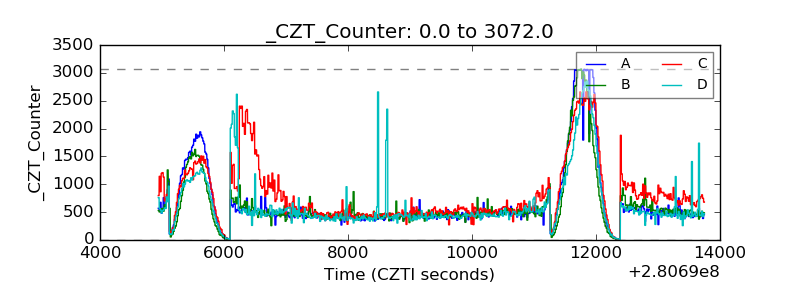 |
| +2.5 Volts monitor | 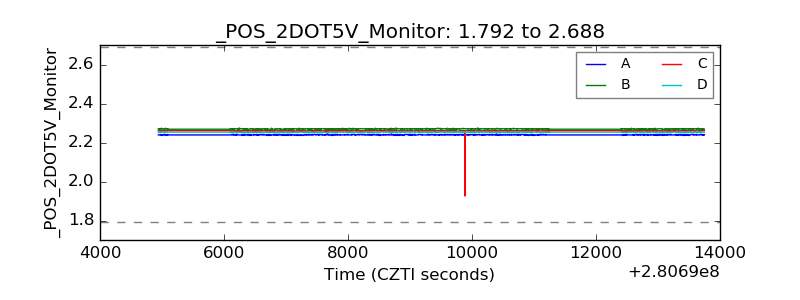 |
| +5 Volts monitor | 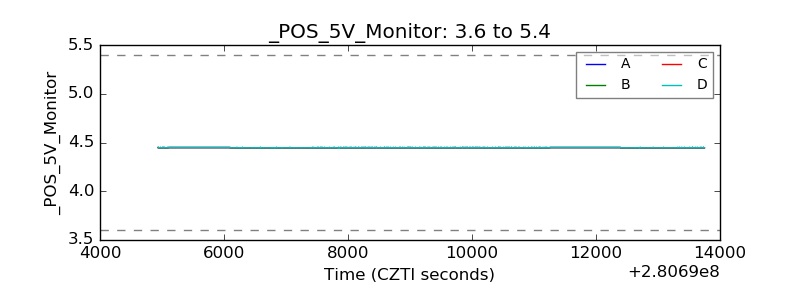 |
| _ROLL_ROT | 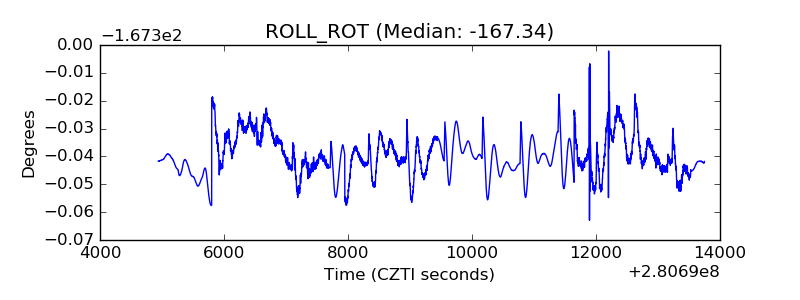 |
| _Roll_DEC | 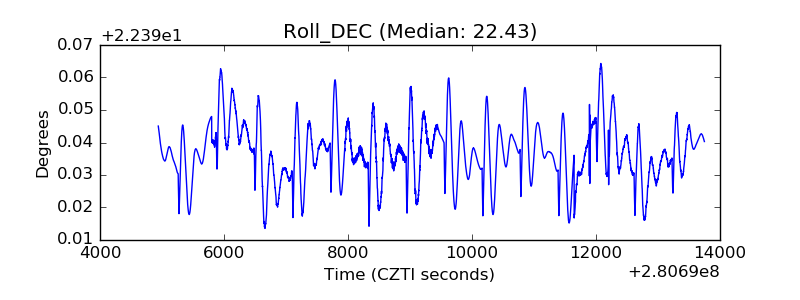 |
| _Roll_RA | 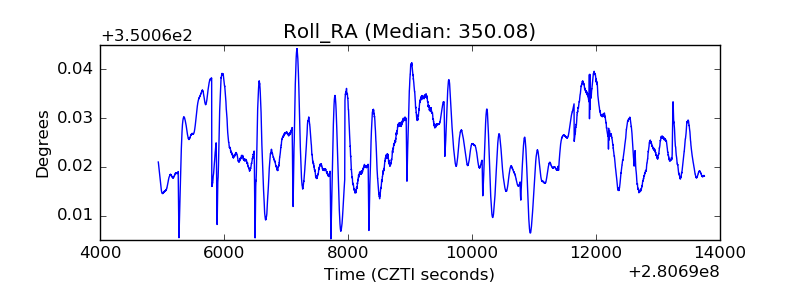 |
| Veto Counter | 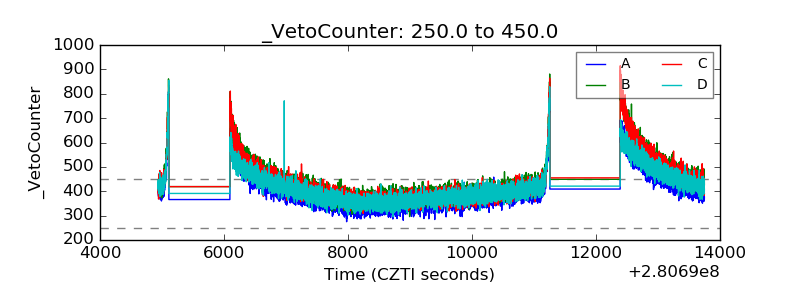 |