| Param | Original file | Final file |
|---|---|---|
| Filename | modeM0/AS1T03_004T01_9000002532_17063cztM0_level2.evt | modeM0/AS1T03_004T01_9000002532_17063cztM0_level2_quad_clean.evt |
| Size (bytes) | 474,304,320 | 89,766,720 |
| Size | 452.3 MB | 85.6 MB |
| Events in quadrant A | 3,040,838 | 580,876 |
| Events in quadrant B | 3,214,624 | 600,555 |
| Events in quadrant C | 4,532,499 | 559,104 |
| Events in quadrant D | 3,151,808 | 541,196 |
| Mode SS | |||
|---|---|---|---|
| Quadrant | BADHDUFLAG | Total packets | Discarded packets |
| A | 0 | 126 | 0 |
| B | 0 | 126 | 0 |
| C | 0 | 126 | 0 |
| D | 0 | 126 | 0 |
| Mode M9 | |||
|---|---|---|---|
| Quadrant | BADHDUFLAG | Total packets | Discarded packets |
| A | 0 | 16 | 0 |
| B | 0 | 17 | 0 |
| C | 0 | 17 | 0 |
| D | 0 | 17 | 0 |
| Mode M0 | |||
|---|---|---|---|
| Quadrant | BADHDUFLAG | Total packets | Discarded packets |
| A | 0 | 13027 | 2 |
| B | 0 | 13500 | 2 |
| C | 0 | 18326 | 2 |
| D | 0 | 13599 | 2 |
| Quadrant | Total seconds | Saturated seconds | Saturation percentage |
|---|---|---|---|
| A | 6261 | 20 | 0.319438% |
| B | 6261 | 37 | 0.590960% |
| C | 6261 | 93 | 1.485386% |
| D | 6261 | 98 | 1.565245% |
Noise dominated data is calculated using 1-second bins in cleaned event files. If a bin has >2000 counts, and if more than 50% of those come from <1% of pixels, then it is considered to be noise-dominated and hence unusable.
| Quadrant | # 1 sec bins | Bins with >0 counts | Bins with >2000 counts | High rate bins dominated by noise | Noise dominated (total time) | Noise dominated (detector-on time) | Marked lightcurve |
|---|---|---|---|---|---|---|---|
| A | 7497 | 6263 | 1 | 1 | 0.01% | 0.02% | 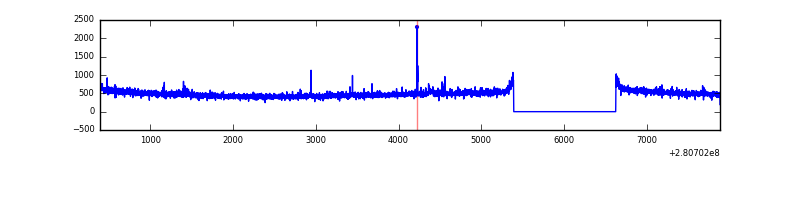 |
| B | 7497 | 6263 | 1 | 1 | 0.01% | 0.02% | 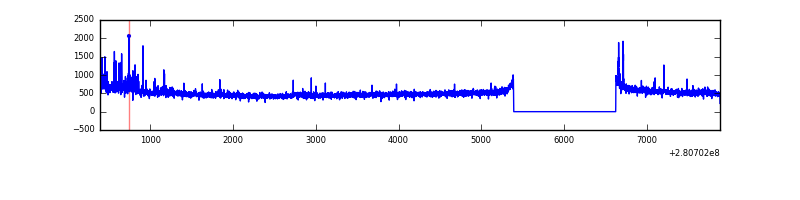 |
| C | 7497 | 6263 | 1 | 1 | 0.01% | 0.02% |  |
| D | 7497 | 6263 | 65 | 65 | 0.87% | 1.04% | 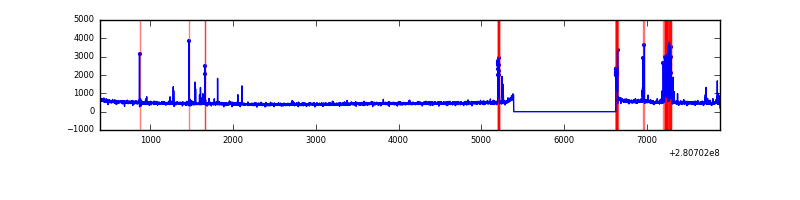 |
Top three noisy pixels from each quadrant. If the there are fewer than three noisy pixels in the level2.evt file, extra rows are filled as -1
| Pixel properties | Quadrant properties | ||||||
|---|---|---|---|---|---|---|---|
| Quadrant | DetID | PixID | Counts | Sigma | Mean | Median | Sigma |
| A | 4 | 2 | 28855 | 180.32 | 782 | 766 | 155.8 |
| A | 12 | 189 | 9291 | 54.73 | 782 | 766 | 155.8 |
| A | 0 | 226 | 6700 | 38.09 | 782 | 766 | 155.8 |
| B | 6 | 36 | 61342 | 404.4 | 791 | 773 | 149.8 |
| B | 0 | 197 | 43049 | 282.27 | 791 | 773 | 149.8 |
| B | 12 | 111 | 17193 | 109.63 | 791 | 773 | 149.8 |
| C | 3 | 233 | 1467358 | 8350.6 | 754 | 762 | 175.6 |
| C | 14 | 238 | 115775 | 654.87 | 754 | 762 | 175.6 |
| C | 13 | 61 | 5397 | 26.39 | 754 | 762 | 175.6 |
| D | 10 | 70 | 181267 | 982.21 | 753 | 731 | 183.8 |
| D | 5 | 222 | 33535 | 178.47 | 753 | 731 | 183.8 |
| D | 12 | 110 | 33394 | 177.7 | 753 | 731 | 183.8 |
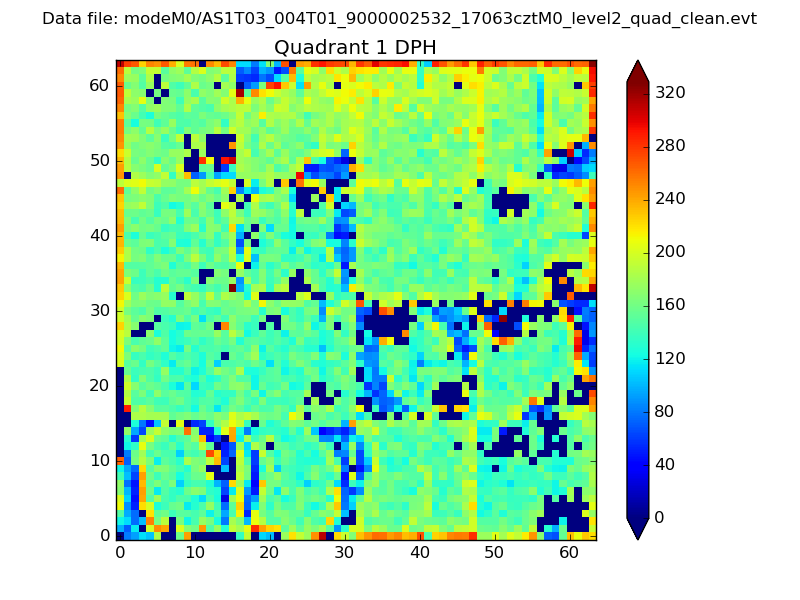
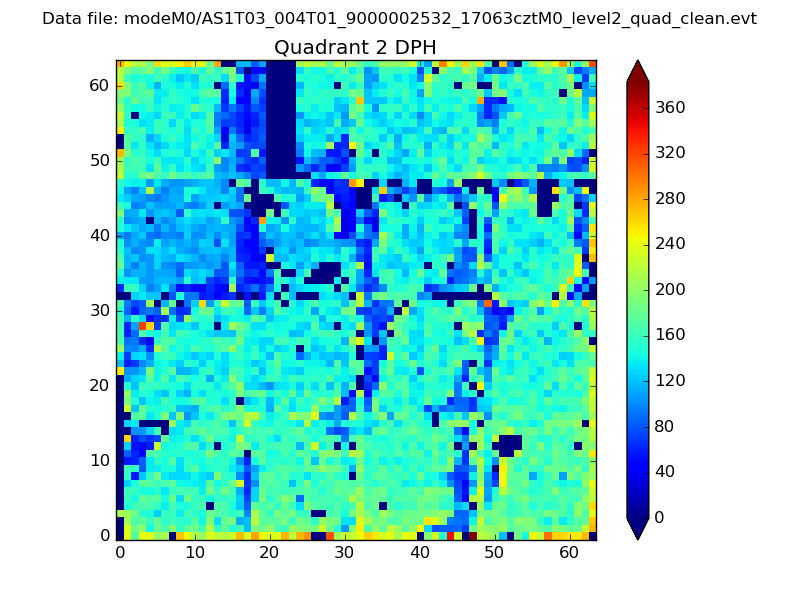
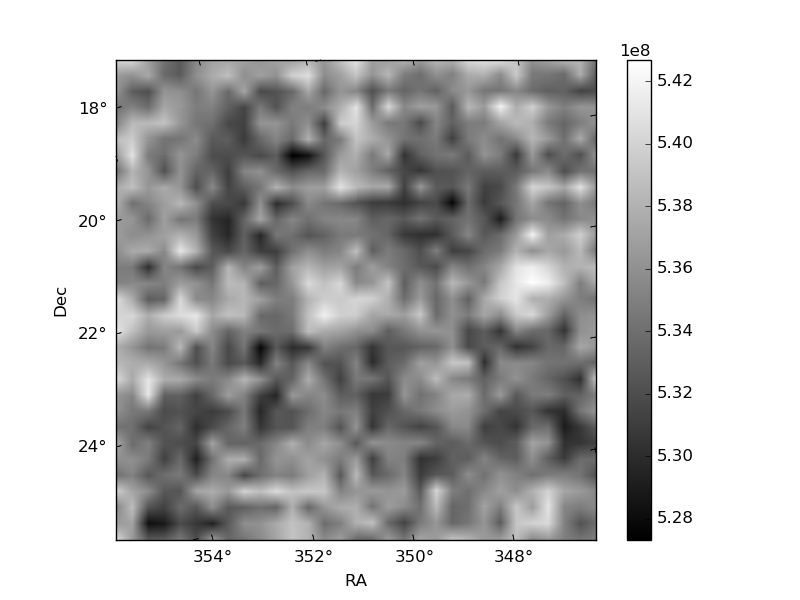
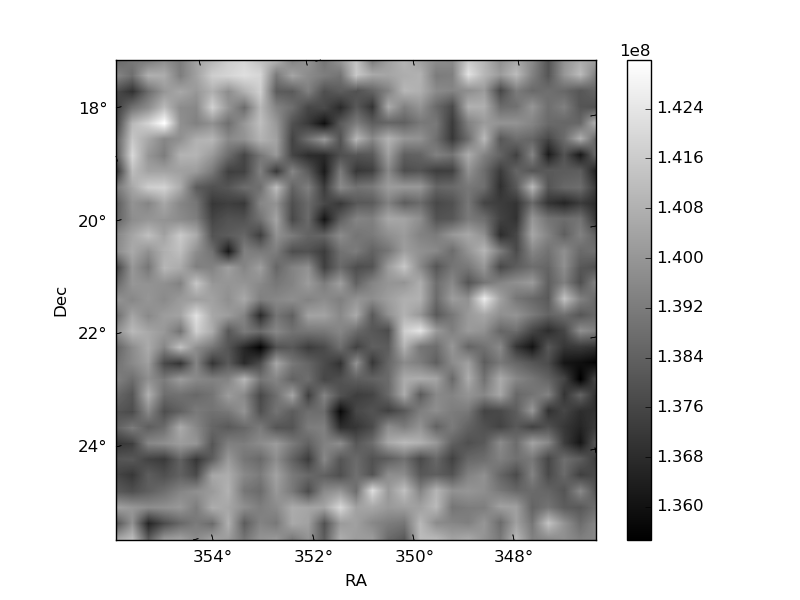
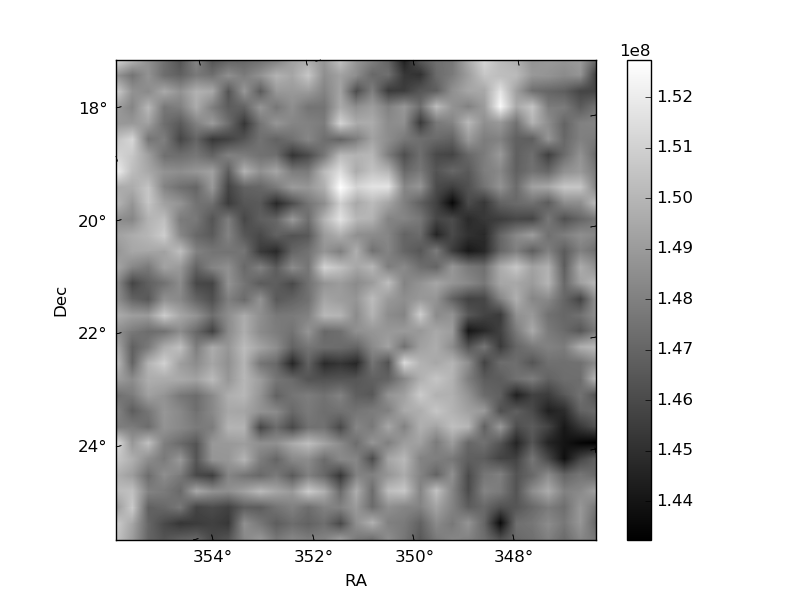
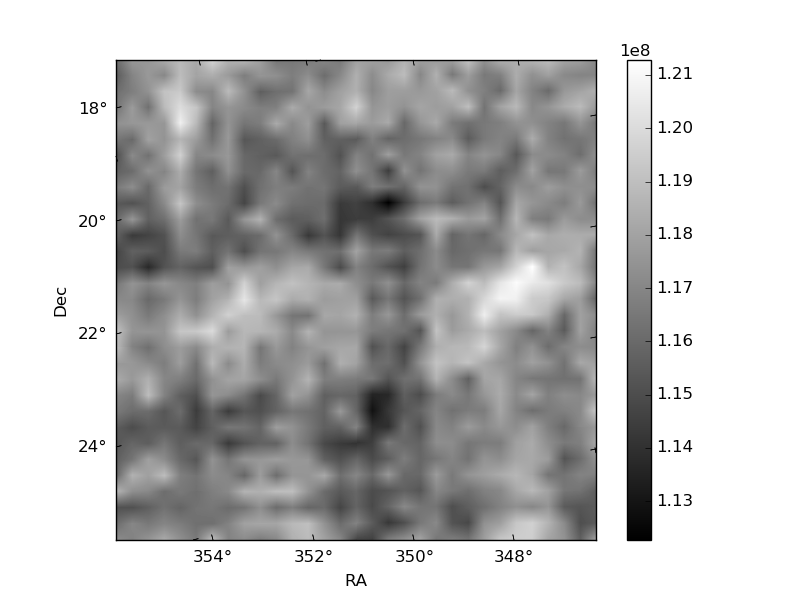
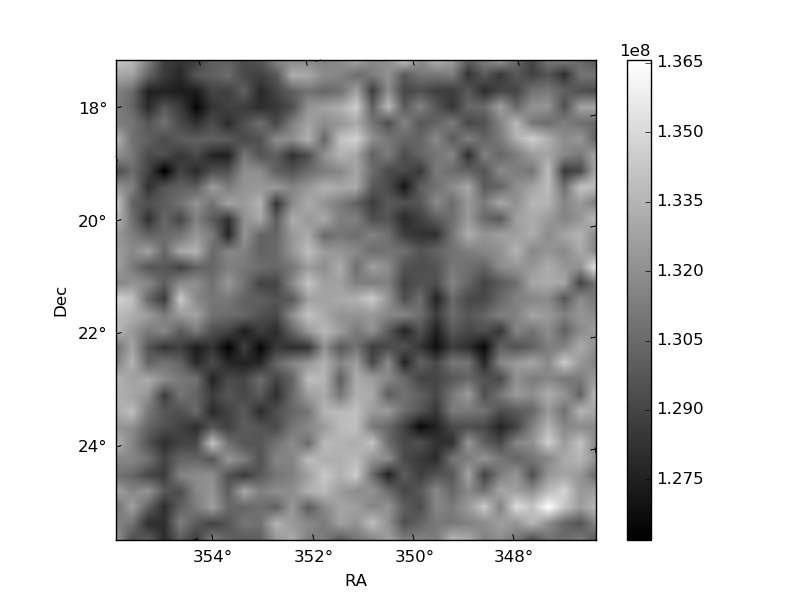
Histogram calculated using DETX and DETY for each event in the final _common_clean file
| Quadrant A | 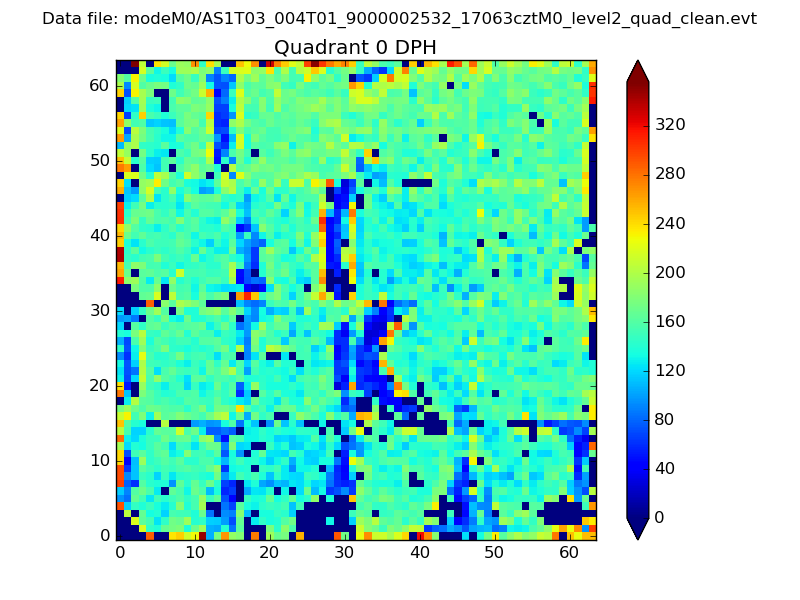 |
 |
Quadrant B |
|---|---|---|---|
| Quadrant D | 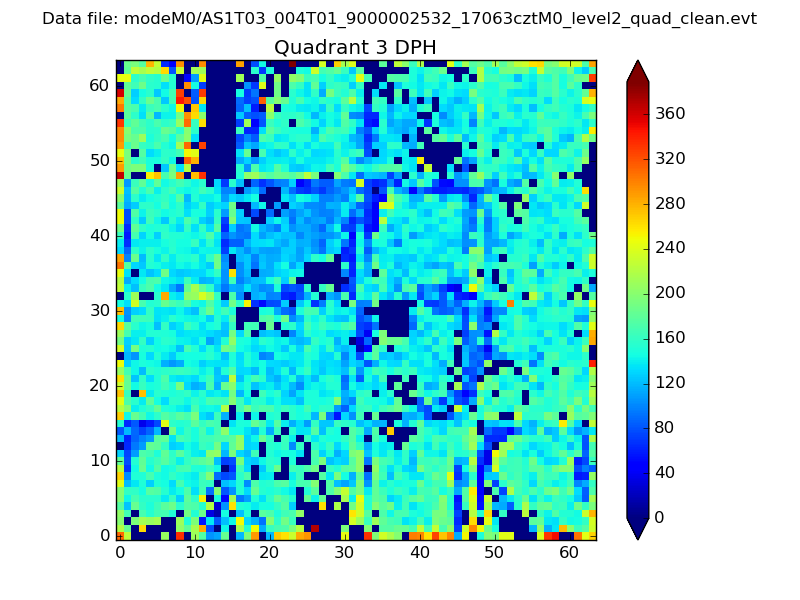 |
 |
Quadrant C |
| Plot type | Count rate plots | Images |
|---|---|---|
| Comparison with Poisson distribution Blue bars denote a histogram of data divided into 1 sec bins. Red curve is a Poisson curve with rate = median count rate of data. |
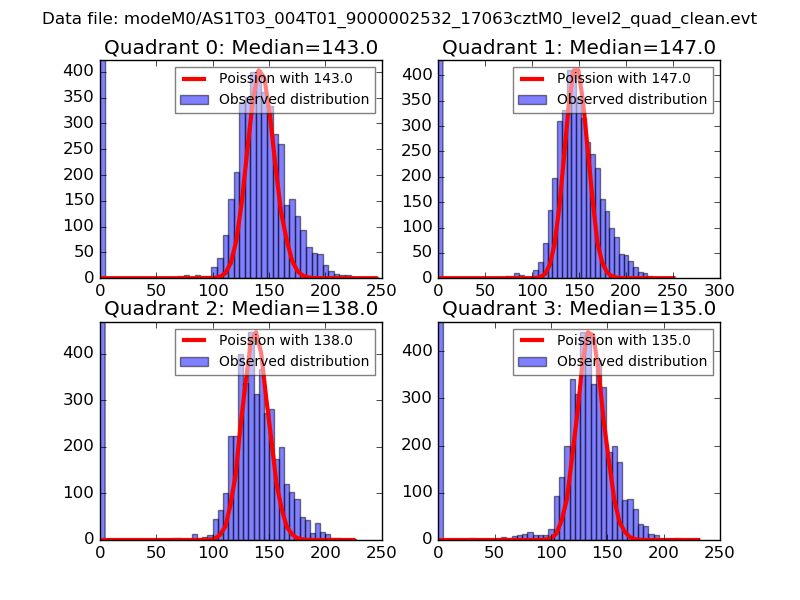 |
 |
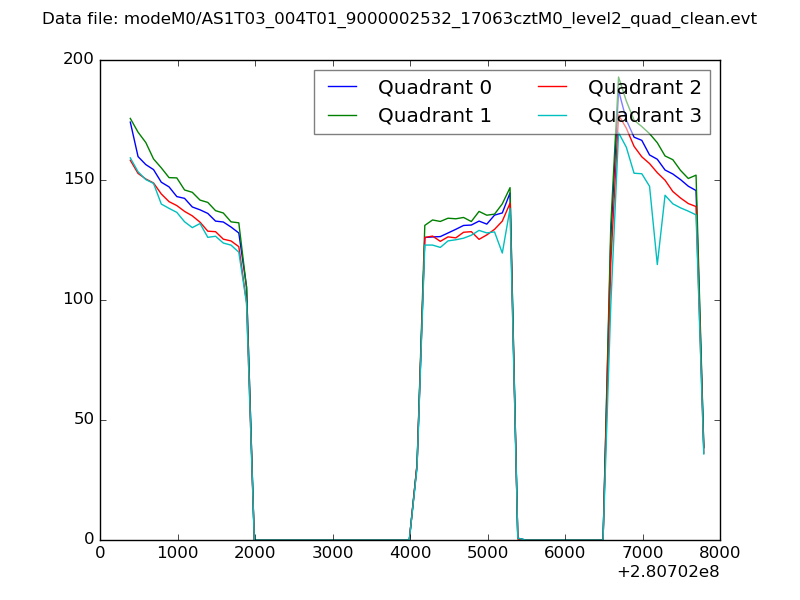
| Quadrant-wise count rates Data is divided into 100 sec bins |
 |
|
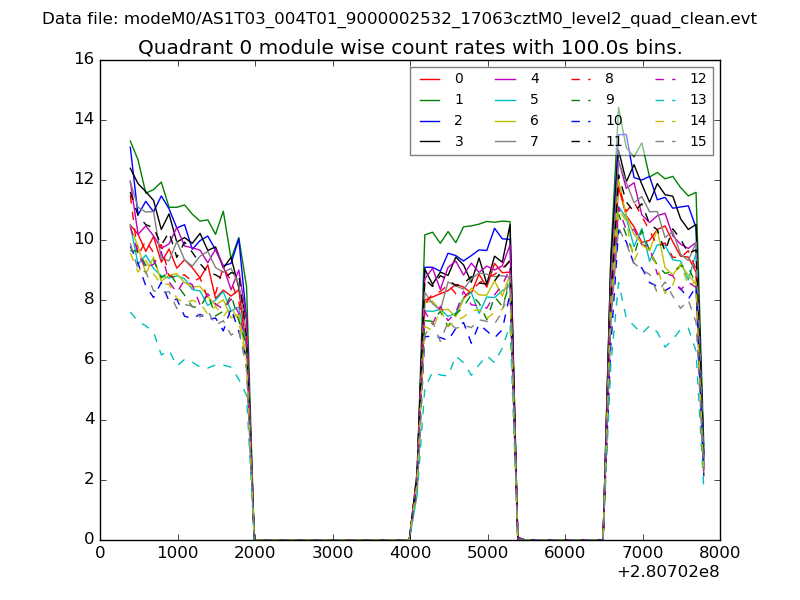
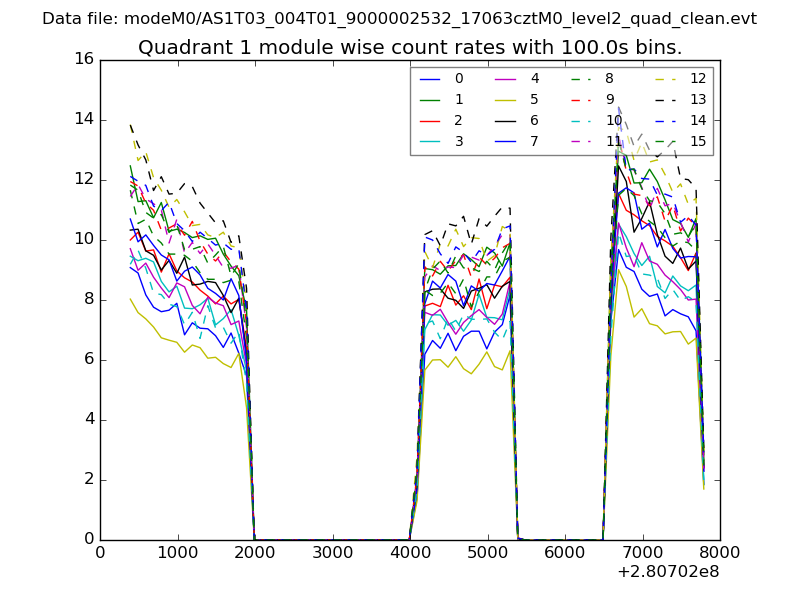
| Module-wise count rates for Quadrant A Data is divided into 100 sec bins |
 |
 |
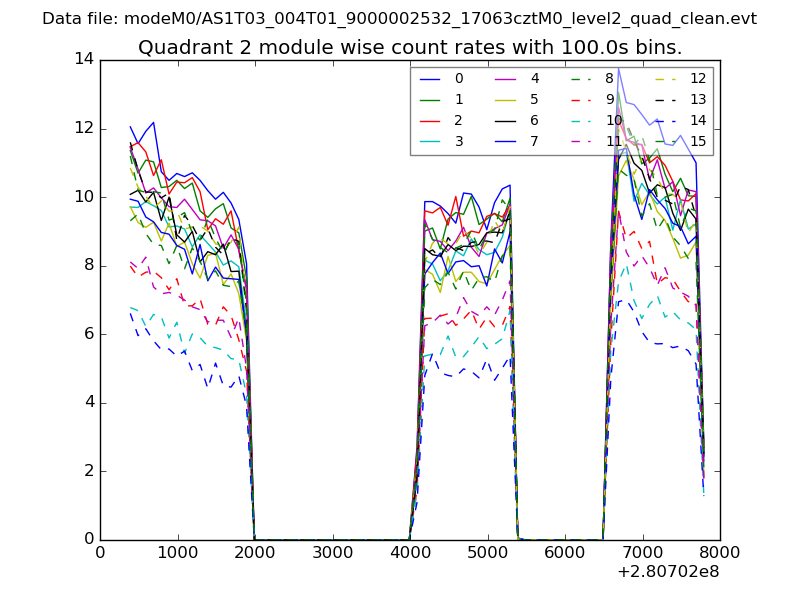
| Module-wise count rates for Quadrant B Data is divided into 100 sec bins |
 |
 |
| Module-wise count rates for Quadrant C Data is divided into 100 sec bins |
 |
 |
| Module-wise count rates for Quadrant D Data is divided into 100 sec bins |
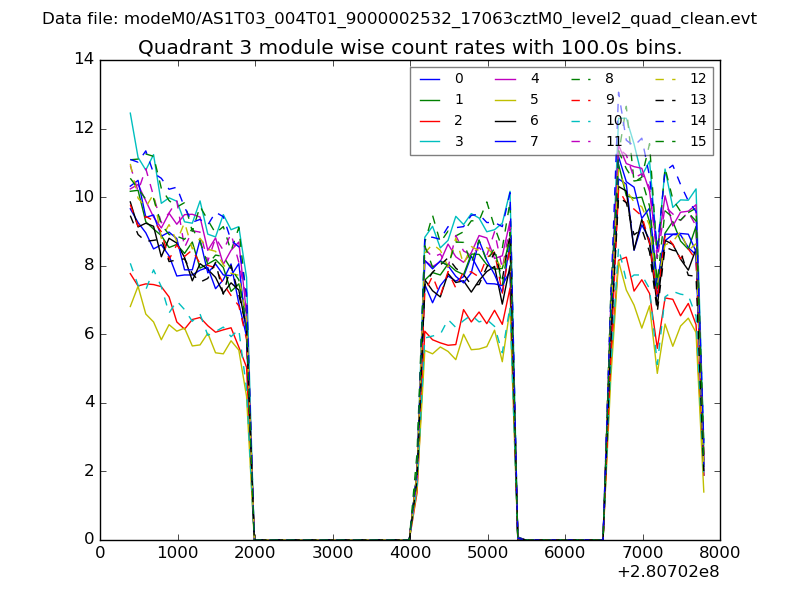 |
 |
| Parameter | Plot |
|---|---|
| CZT HV Monitor | 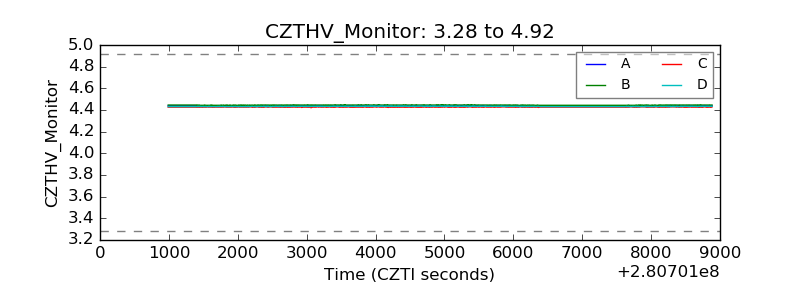 |
| D_VDD | 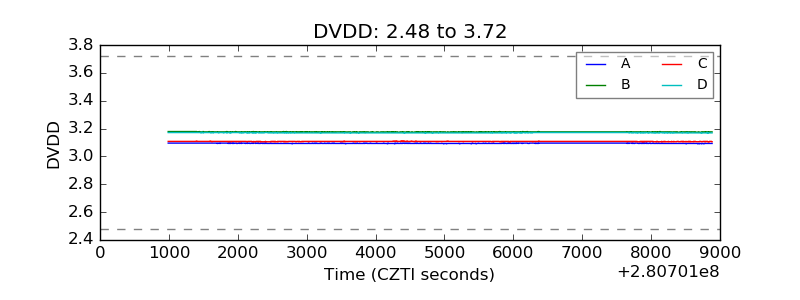 |
| Temperature 1 | 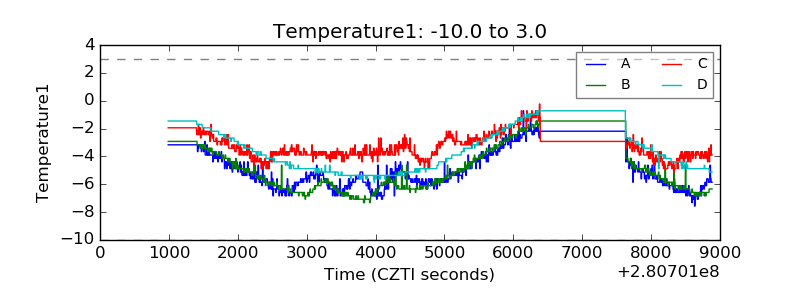 |
| Veto HV Monitor |  |
| Veto LLD | 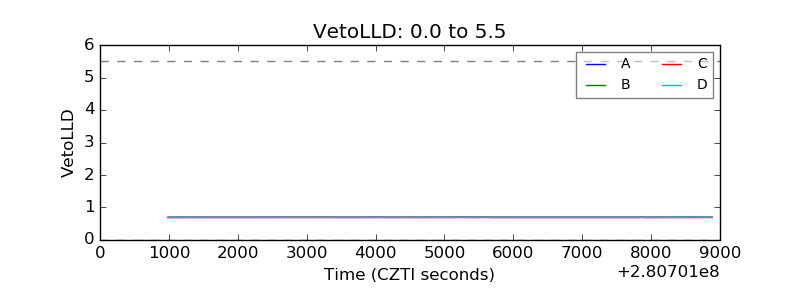 |
| Alpha Counter | 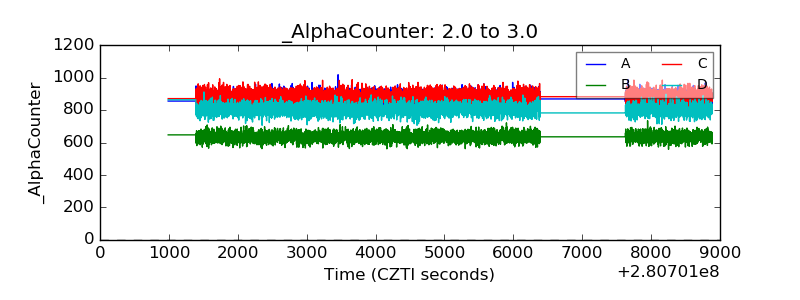 |
| _CPM_Rate | 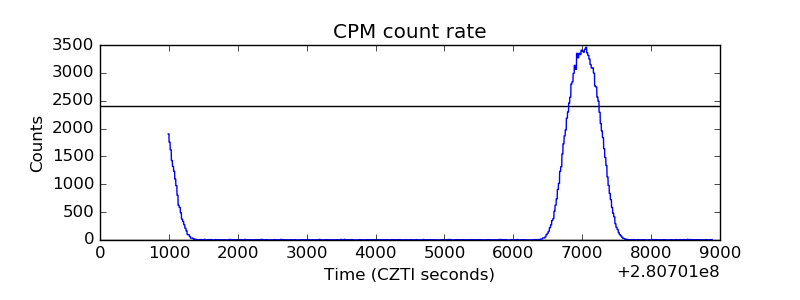 |
| CZT Counter | 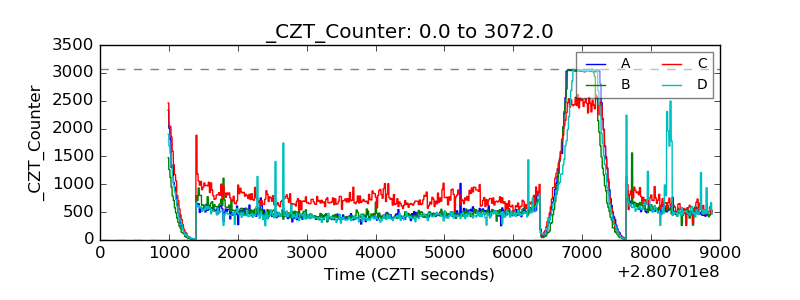 |
| +2.5 Volts monitor |  |
| +5 Volts monitor | 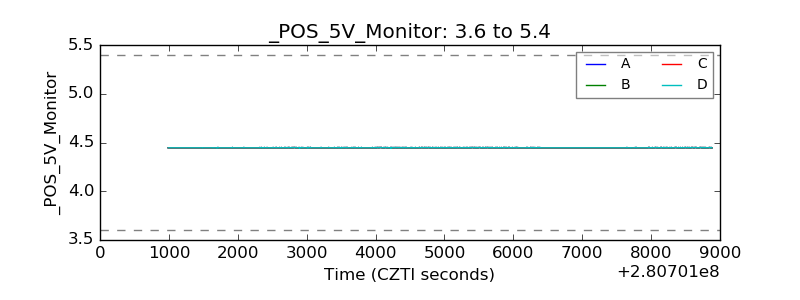 |
| _ROLL_ROT | 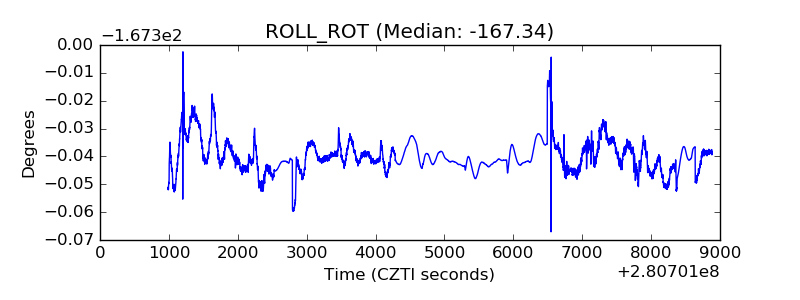 |
| _Roll_DEC | 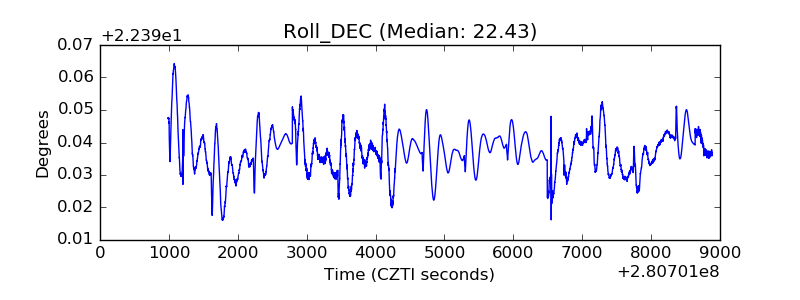 |
| _Roll_RA | 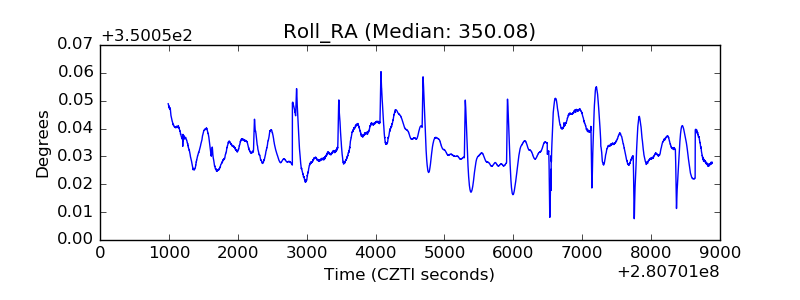 |
| Veto Counter | 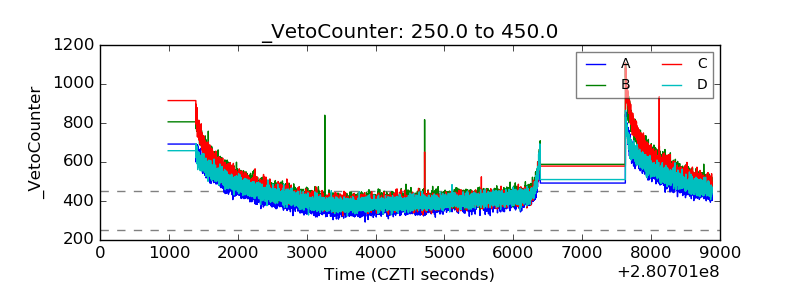 |