| Param | Original file | Final file |
|---|---|---|
| Filename | modeM0/AS1T03_004T01_9000002532_17064cztM0_level2.evt | modeM0/AS1T03_004T01_9000002532_17064cztM0_level2_quad_clean.evt |
| Size (bytes) | 497,188,800 | 82,848,960 |
| Size | 474.2 MB | 79.0 MB |
| Events in quadrant A | 3,101,865 | 532,471 |
| Events in quadrant B | 3,258,051 | 552,532 |
| Events in quadrant C | 4,838,998 | 503,702 |
| Events in quadrant D | 3,436,758 | 485,899 |
| Mode SS | |||
|---|---|---|---|
| Quadrant | BADHDUFLAG | Total packets | Discarded packets |
| A | 0 | 126 | 0 |
| B | 0 | 126 | 0 |
| C | 0 | 126 | 0 |
| D | 0 | 126 | 0 |
| Mode M9 | |||
|---|---|---|---|
| Quadrant | BADHDUFLAG | Total packets | Discarded packets |
| A | 0 | 24 | 0 |
| B | 0 | 25 | 0 |
| C | 0 | 25 | 0 |
| D | 0 | 25 | 0 |
| Mode M0 | |||
|---|---|---|---|
| Quadrant | BADHDUFLAG | Total packets | Discarded packets |
| A | 0 | 13044 | 2 |
| B | 0 | 13393 | 2 |
| C | 0 | 18747 | 4 |
| D | 0 | 14253 | 2 |
| Quadrant | Total seconds | Saturated seconds | Saturation percentage |
|---|---|---|---|
| A | 6220 | 30 | 0.482315% |
| B | 6220 | 43 | 0.691318% |
| C | 6219 | 171 | 2.749638% |
| D | 6219 | 153 | 2.460203% |
Noise dominated data is calculated using 1-second bins in cleaned event files. If a bin has >2000 counts, and if more than 50% of those come from <1% of pixels, then it is considered to be noise-dominated and hence unusable.
| Quadrant | # 1 sec bins | Bins with >0 counts | Bins with >2000 counts | High rate bins dominated by noise | Noise dominated (total time) | Noise dominated (detector-on time) | Marked lightcurve |
|---|---|---|---|---|---|---|---|
| A | 7586 | 6223 | 1 | 1 | 0.01% | 0.02% | 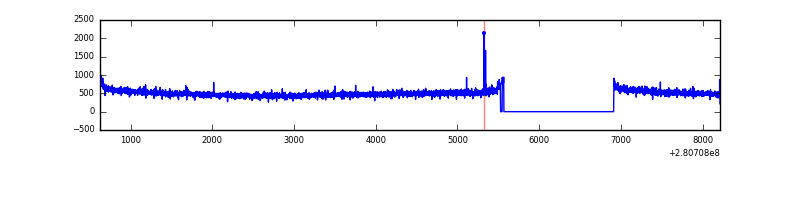 |
| B | 7586 | 6223 | 2 | 2 | 0.03% | 0.03% | 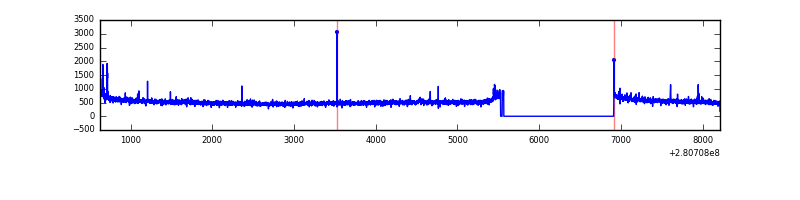 |
| C | 7585 | 6222 | 7 | 7 | 0.09% | 0.11% | 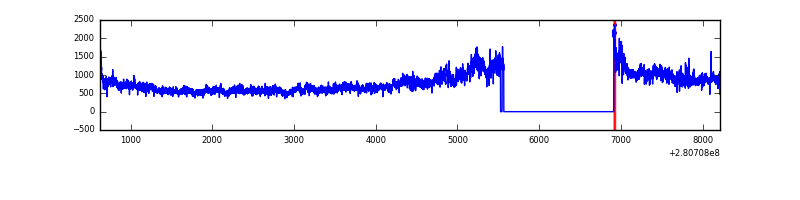 |
| D | 7585 | 6222 | 93 | 93 | 1.23% | 1.49% | 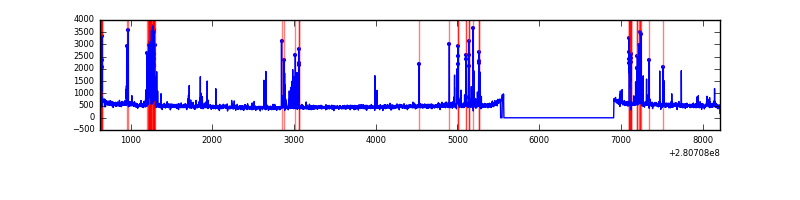 |
Top three noisy pixels from each quadrant. If the there are fewer than three noisy pixels in the level2.evt file, extra rows are filled as -1
| Pixel properties | Quadrant properties | ||||||
|---|---|---|---|---|---|---|---|
| Quadrant | DetID | PixID | Counts | Sigma | Mean | Median | Sigma |
| A | 4 | 2 | 9686 | 55.66 | 804 | 790 | 159.8 |
| A | 0 | 226 | 6876 | 38.08 | 804 | 790 | 159.8 |
| A | 12 | 194 | 5783 | 31.24 | 804 | 790 | 159.8 |
| B | 0 | 197 | 29337 | 188.64 | 816 | 799 | 151.3 |
| B | 12 | 111 | 17531 | 110.6 | 816 | 799 | 151.3 |
| B | 11 | 111 | 15000 | 93.87 | 816 | 799 | 151.3 |
| C | 3 | 233 | 1697464 | 9512.28 | 771 | 778 | 178.4 |
| C | 14 | 238 | 120271 | 669.92 | 771 | 778 | 178.4 |
| C | 9 | 54 | 11171 | 58.27 | 771 | 778 | 178.4 |
| D | 10 | 70 | 300053 | 1619.79 | 767 | 745 | 184.8 |
| D | 5 | 222 | 130976 | 704.78 | 767 | 745 | 184.8 |
| D | 12 | 110 | 33439 | 176.93 | 767 | 745 | 184.8 |
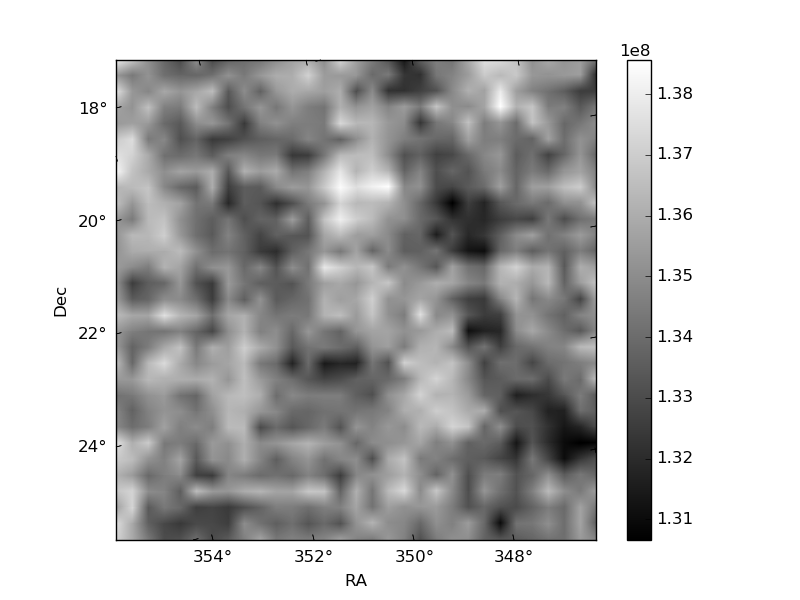
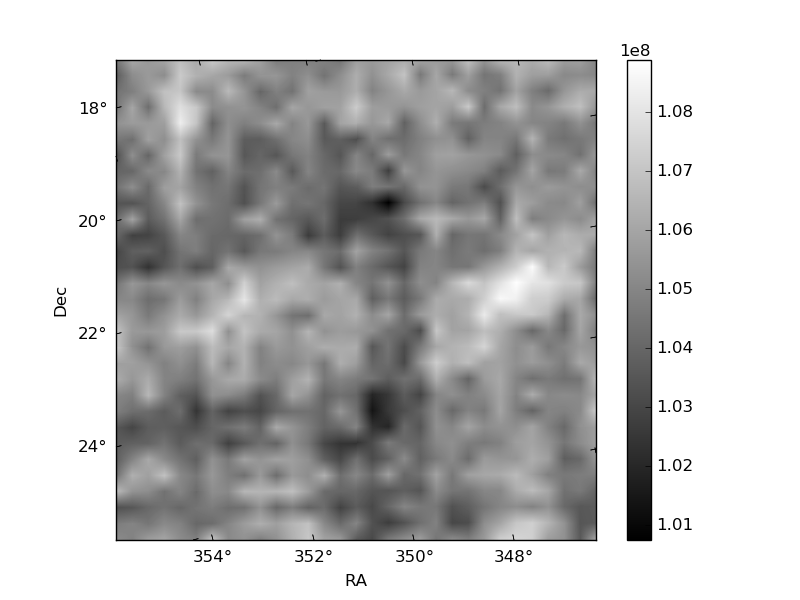
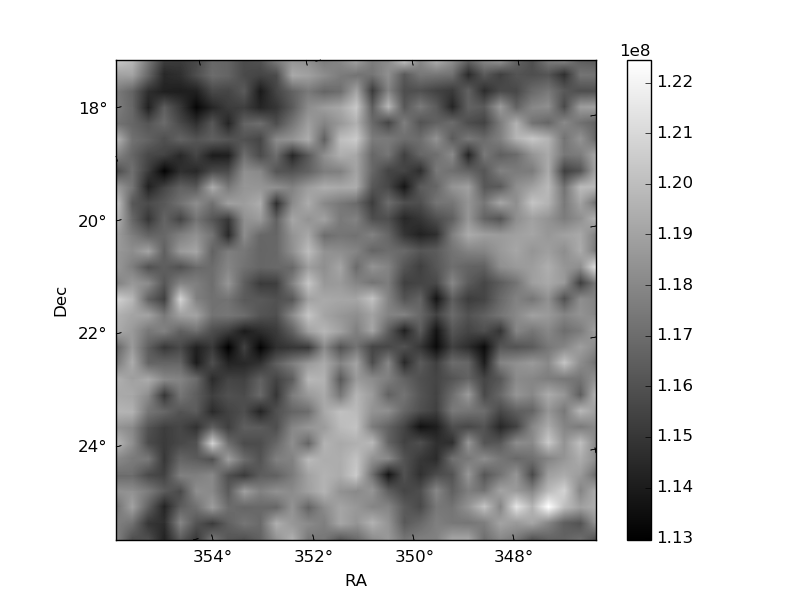
Histogram calculated using DETX and DETY for each event in the final _common_clean file
| Quadrant A | 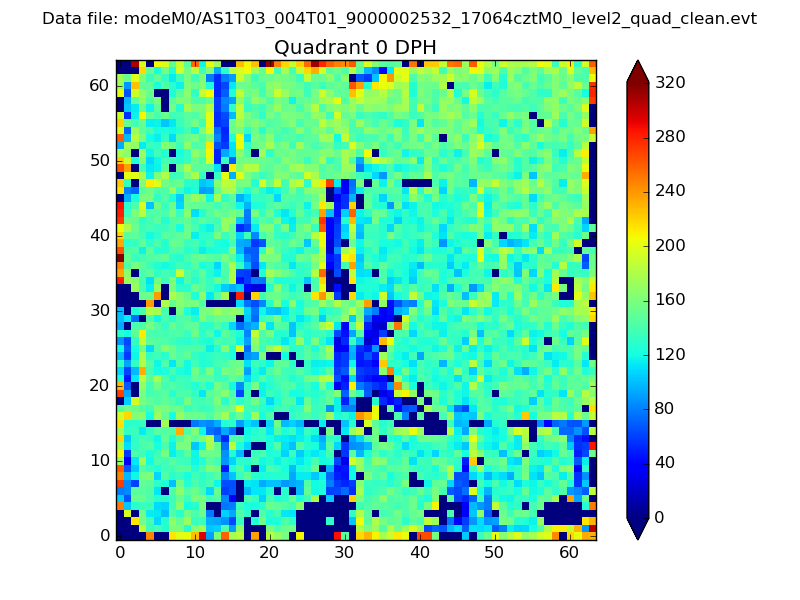 |
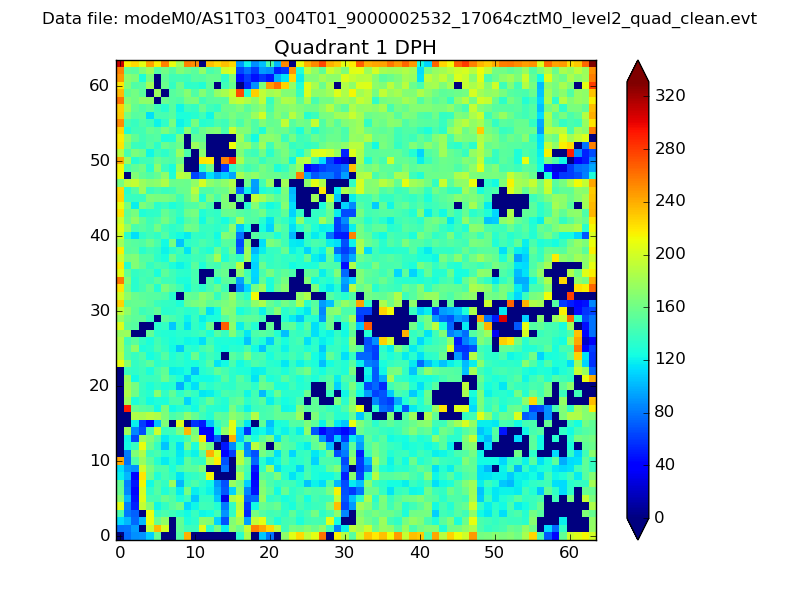 |
Quadrant B |
|---|---|---|---|
| Quadrant D | 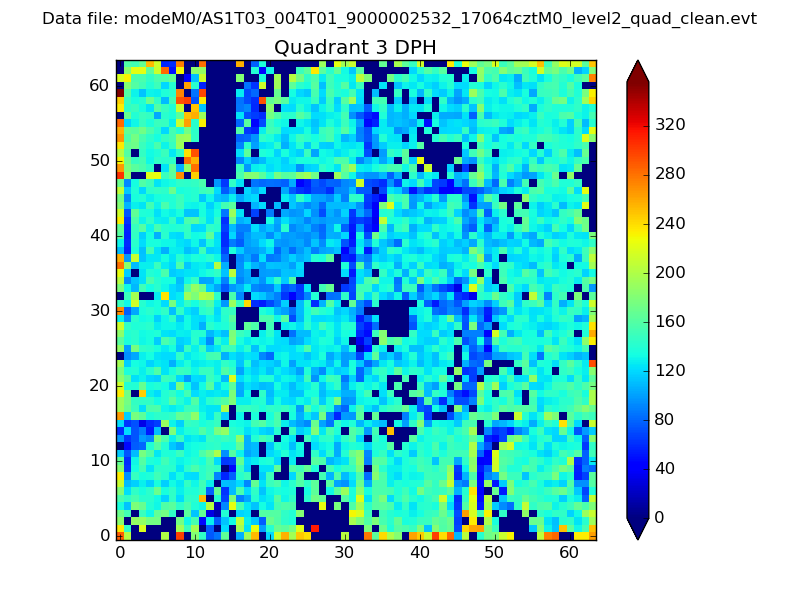 |
 |
Quadrant C |
| Plot type | Count rate plots | Images |
|---|---|---|
| Comparison with Poisson distribution Blue bars denote a histogram of data divided into 1 sec bins. Red curve is a Poisson curve with rate = median count rate of data. |
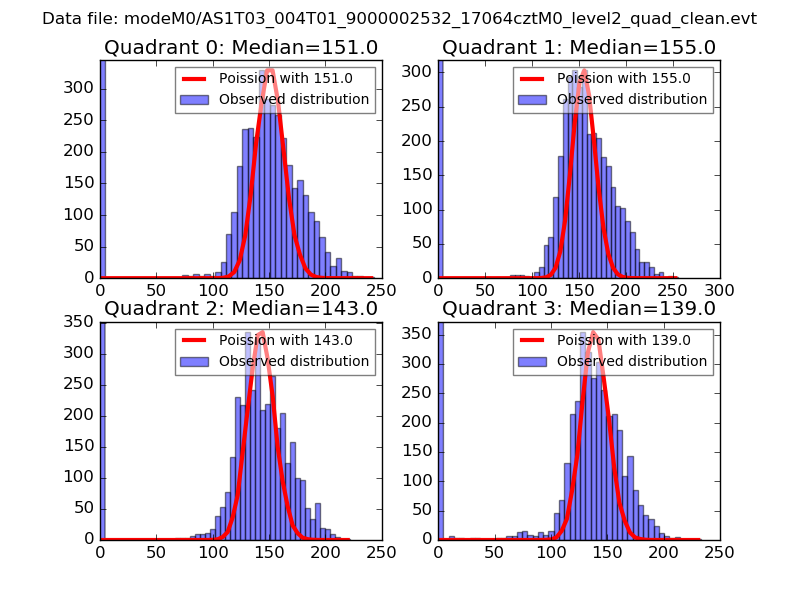 |
 |
| Quadrant-wise count rates Data is divided into 100 sec bins |
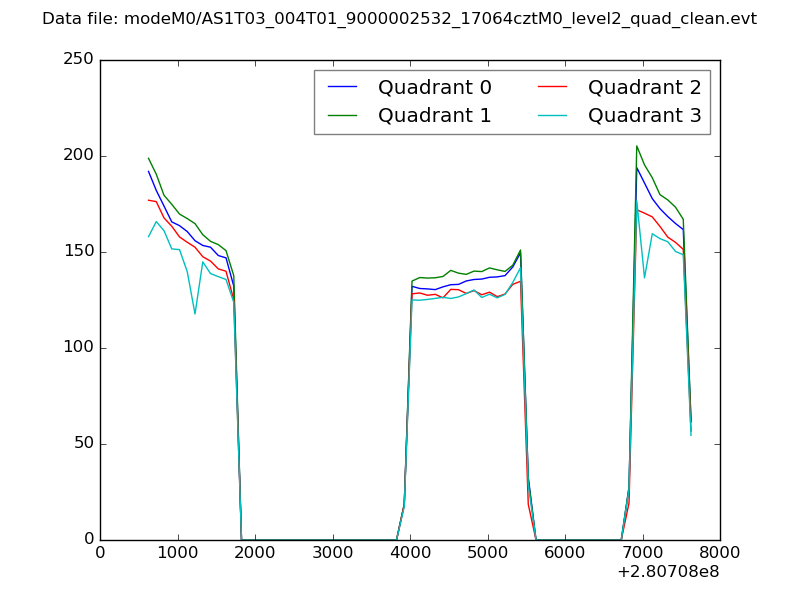 |
|
| Module-wise count rates for Quadrant A Data is divided into 100 sec bins |
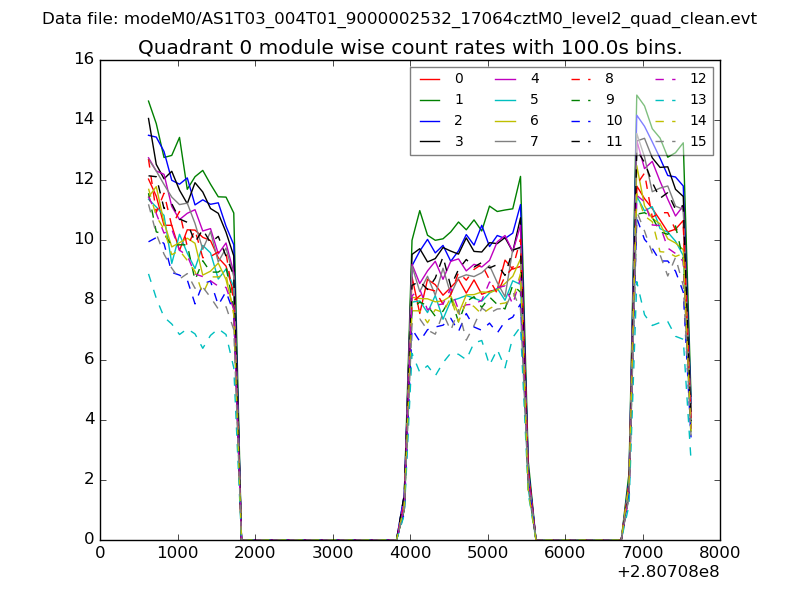 |
 |
| Module-wise count rates for Quadrant B Data is divided into 100 sec bins |
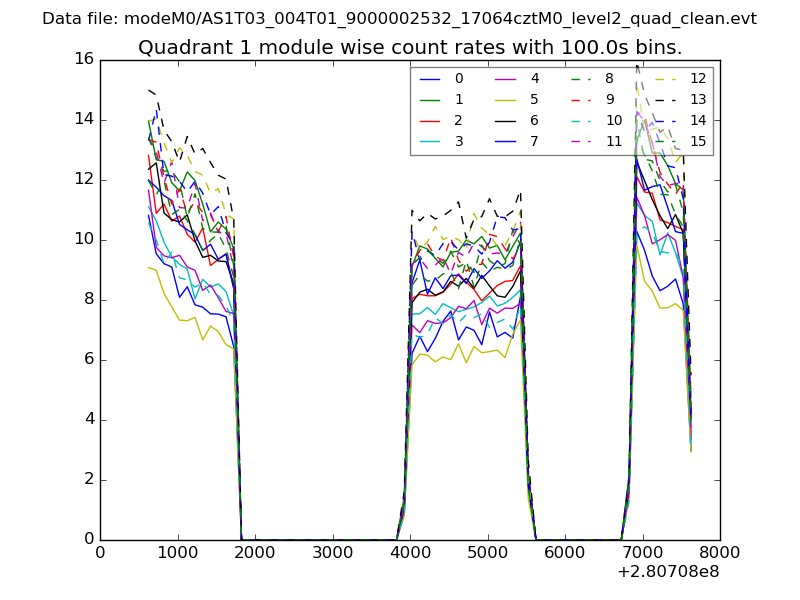 |
 |
| Module-wise count rates for Quadrant C Data is divided into 100 sec bins |
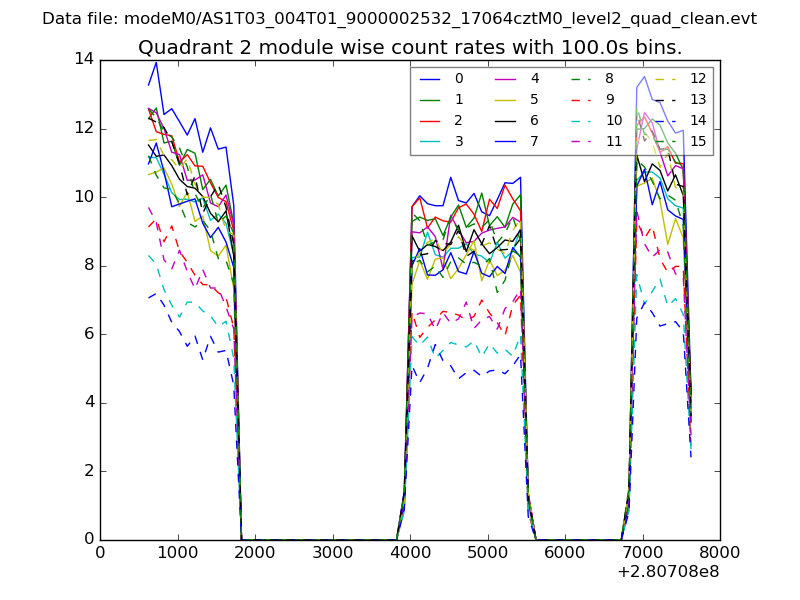 |
 |
| Module-wise count rates for Quadrant D Data is divided into 100 sec bins |
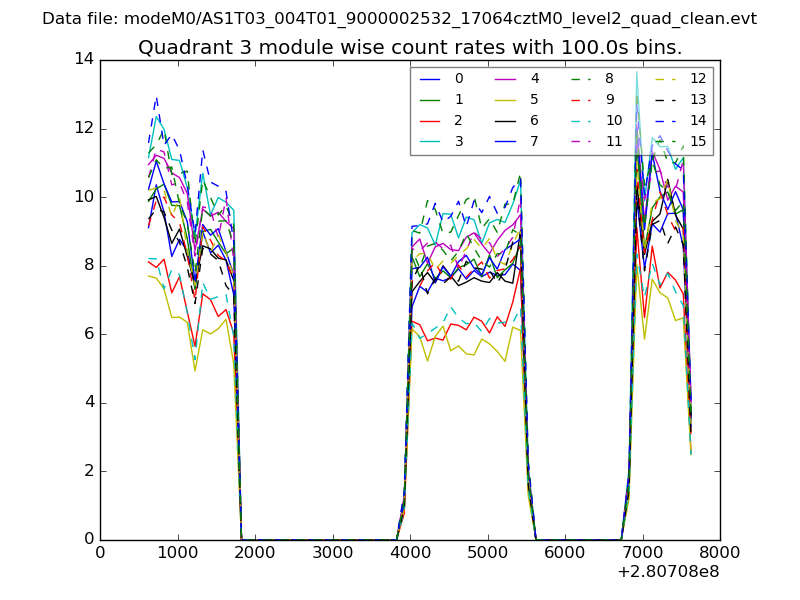 |
 |
| Parameter | Plot |
|---|---|
| CZT HV Monitor | 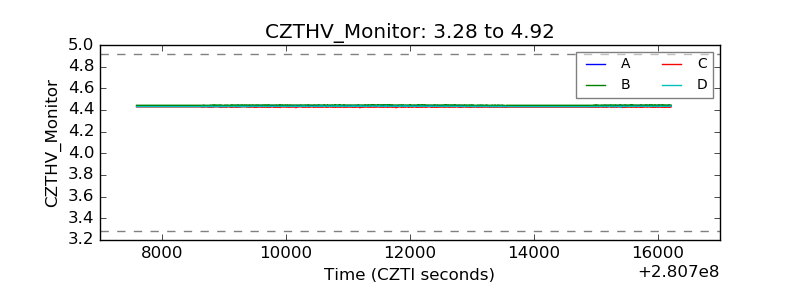 |
| D_VDD | 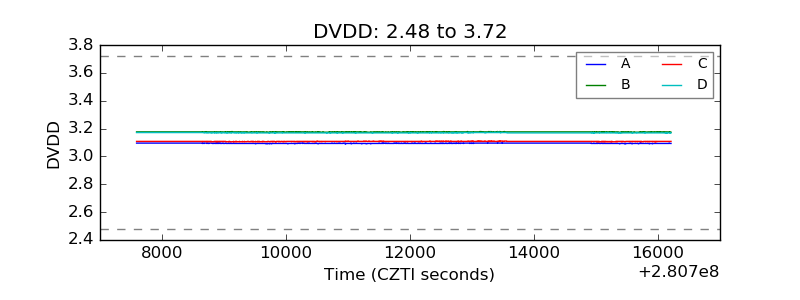 |
| Temperature 1 | 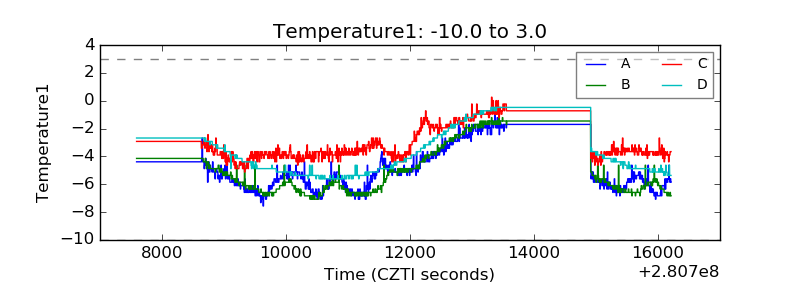 |
| Veto HV Monitor | 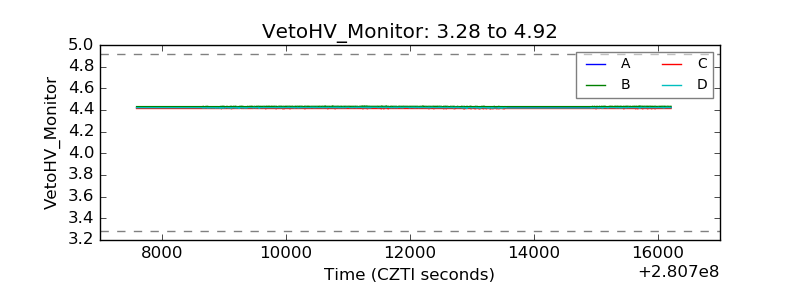 |
| Veto LLD | 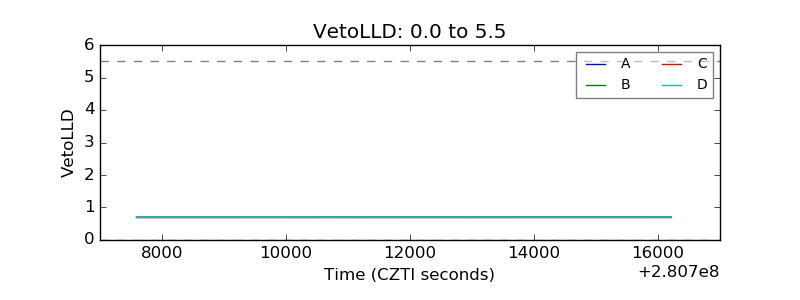 |
| Alpha Counter | 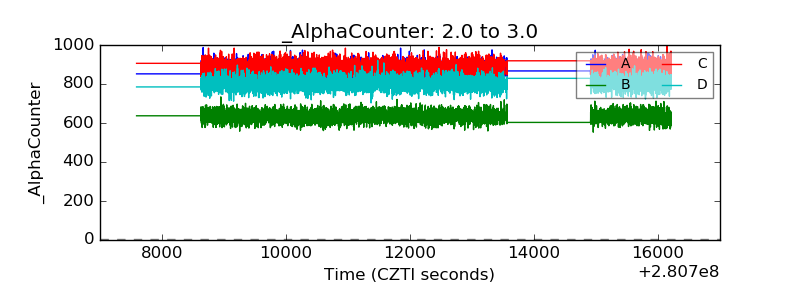 |
| _CPM_Rate | 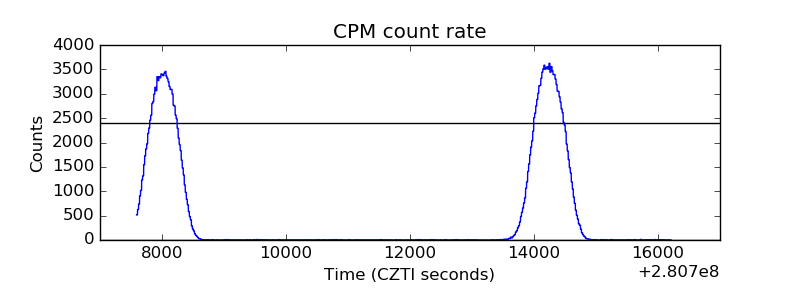 |
| CZT Counter |  |
| +2.5 Volts monitor |  |
| +5 Volts monitor | 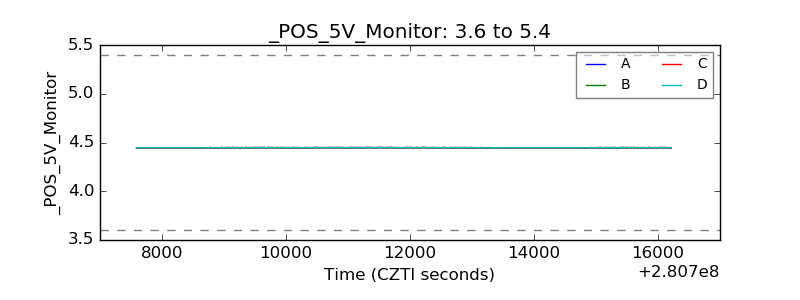 |
| _ROLL_ROT | 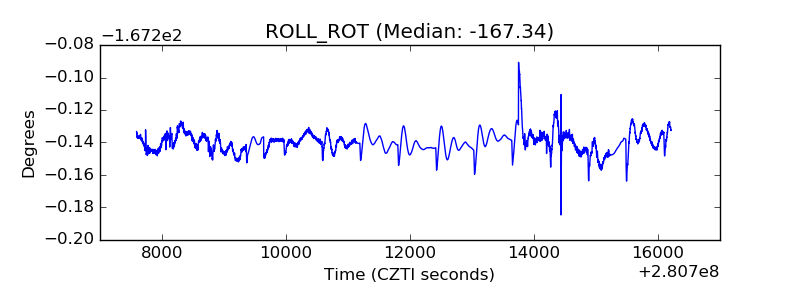 |
| _Roll_DEC | 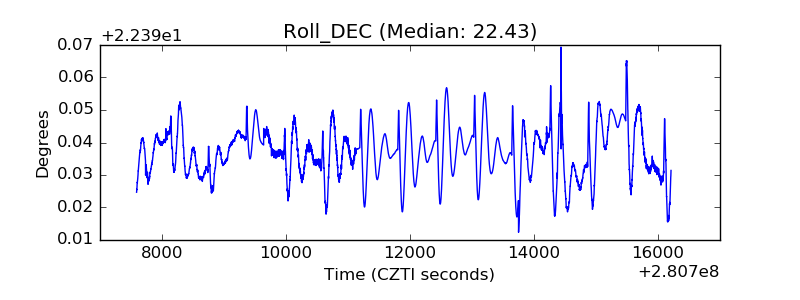 |
| _Roll_RA | 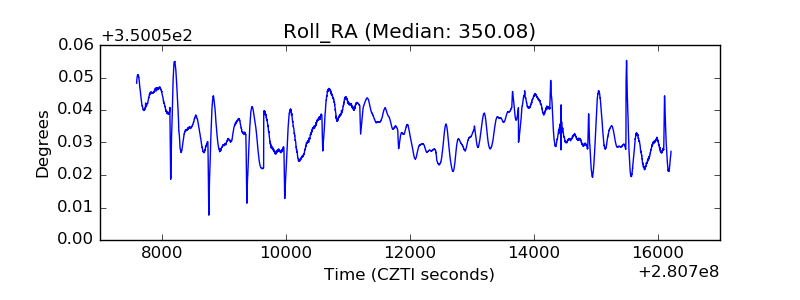 |
| Veto Counter | 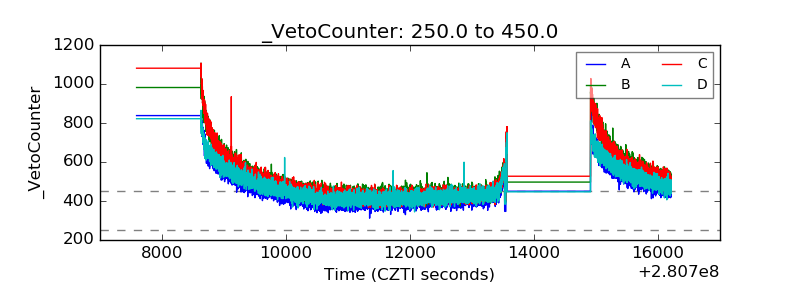 |