| Param | Original file | Final file |
|---|---|---|
| Filename | modeM0/AS1T03_004T01_9000002532_17065cztM0_level2.evt | modeM0/AS1T03_004T01_9000002532_17065cztM0_level2_quad_clean.evt |
| Size (bytes) | 530,320,320 | 74,845,440 |
| Size | 505.8 MB | 71.4 MB |
| Events in quadrant A | 3,316,207 | 468,793 |
| Events in quadrant B | 3,400,205 | 483,079 |
| Events in quadrant C | 5,497,429 | 438,448 |
| Events in quadrant D | 3,413,933 | 429,980 |
| Mode SS | |||
|---|---|---|---|
| Quadrant | BADHDUFLAG | Total packets | Discarded packets |
| A | 0 | 128 | 0 |
| B | 0 | 128 | 0 |
| C | 0 | 128 | 0 |
| D | 0 | 128 | 0 |
| Mode M9 | |||
|---|---|---|---|
| Quadrant | BADHDUFLAG | Total packets | Discarded packets |
| A | 0 | 18 | 0 |
| B | 0 | 19 | 0 |
| C | 0 | 19 | 0 |
| D | 0 | 19 | 0 |
| Mode M0 | |||
|---|---|---|---|
| Quadrant | BADHDUFLAG | Total packets | Discarded packets |
| A | 0 | 13662 | 2 |
| B | 0 | 13877 | 2 |
| C | 0 | 21045 | 2 |
| D | 0 | 14245 | 2 |
| Quadrant | Total seconds | Saturated seconds | Saturation percentage |
|---|---|---|---|
| A | 6397 | 52 | 0.812881% |
| B | 6397 | 60 | 0.937940% |
| C | 6397 | 222 | 3.470377% |
| D | 6397 | 115 | 1.797718% |
Noise dominated data is calculated using 1-second bins in cleaned event files. If a bin has >2000 counts, and if more than 50% of those come from <1% of pixels, then it is considered to be noise-dominated and hence unusable.
| Quadrant | # 1 sec bins | Bins with >0 counts | Bins with >2000 counts | High rate bins dominated by noise | Noise dominated (total time) | Noise dominated (detector-on time) | Marked lightcurve |
|---|---|---|---|---|---|---|---|
| A | 7758 | 6399 | 9 | 9 | 0.12% | 0.14% | 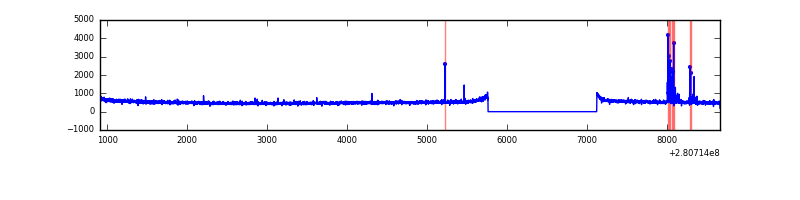 |
| B | 7758 | 6399 | 1 | 1 | 0.01% | 0.02% | 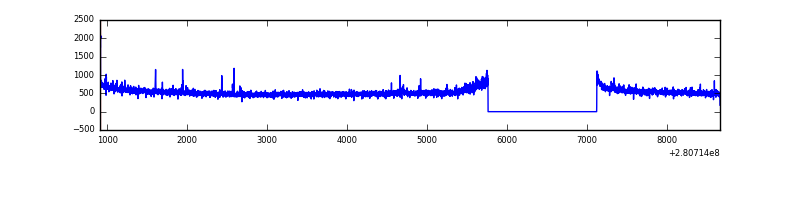 |
| C | 7758 | 6399 | 11 | 11 | 0.14% | 0.17% | 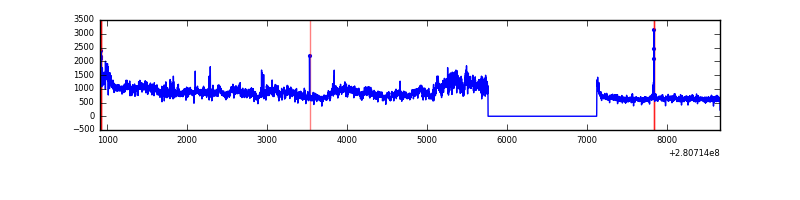 |
| D | 7758 | 6399 | 64 | 64 | 0.82% | 1.00% | 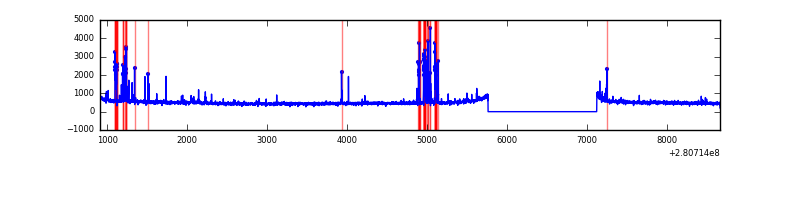 |
Top three noisy pixels from each quadrant. If the there are fewer than three noisy pixels in the level2.evt file, extra rows are filled as -1
| Pixel properties | Quadrant properties | ||||||
|---|---|---|---|---|---|---|---|
| Quadrant | DetID | PixID | Counts | Sigma | Mean | Median | Sigma |
| A | 4 | 2 | 65919 | 388.37 | 845 | 831 | 167.6 |
| A | 0 | 226 | 7415 | 39.29 | 845 | 831 | 167.6 |
| A | 12 | 194 | 6233 | 32.23 | 845 | 831 | 167.6 |
| B | 4 | 216 | 22189 | 135.37 | 857 | 841 | 157.7 |
| B | 12 | 111 | 18189 | 110.01 | 857 | 841 | 157.7 |
| B | 11 | 111 | 15637 | 93.83 | 857 | 841 | 157.7 |
| C | 3 | 233 | 2187123 | 11737.42 | 804 | 811 | 186.3 |
| C | 14 | 238 | 127687 | 681.14 | 804 | 811 | 186.3 |
| C | 9 | 54 | 44769 | 235.99 | 804 | 811 | 186.3 |
| D | 10 | 70 | 274745 | 1409.43 | 806 | 785 | 194.4 |
| D | 8 | 0 | 24146 | 120.18 | 806 | 785 | 194.4 |
| D | 2 | 234 | 23688 | 117.83 | 806 | 785 | 194.4 |
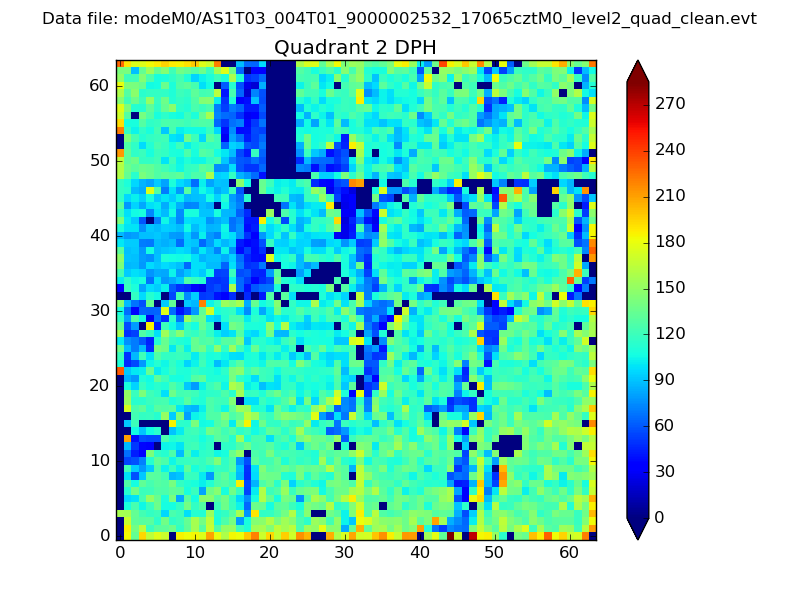
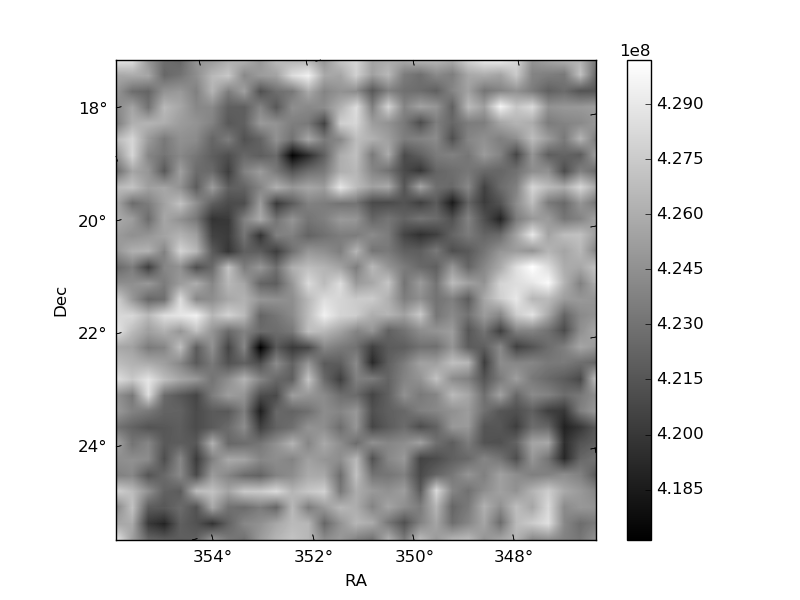
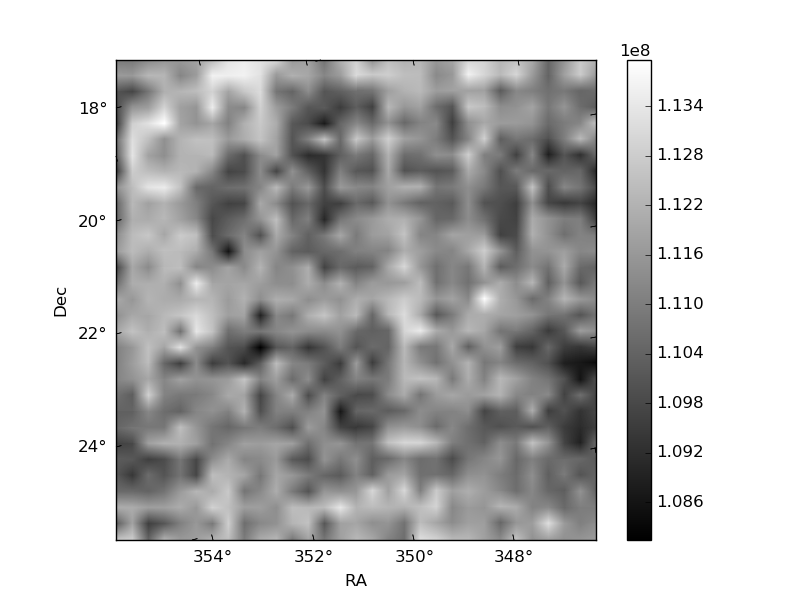
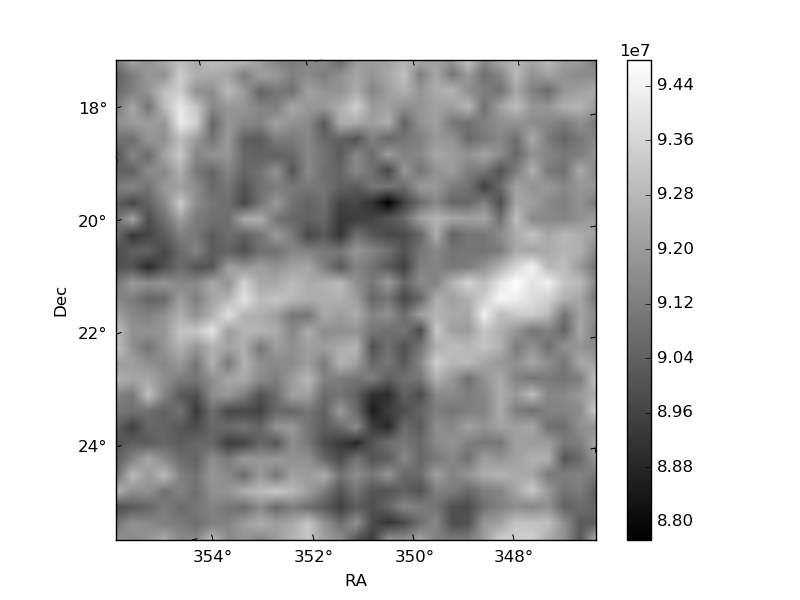
Histogram calculated using DETX and DETY for each event in the final _common_clean file
| Quadrant A | 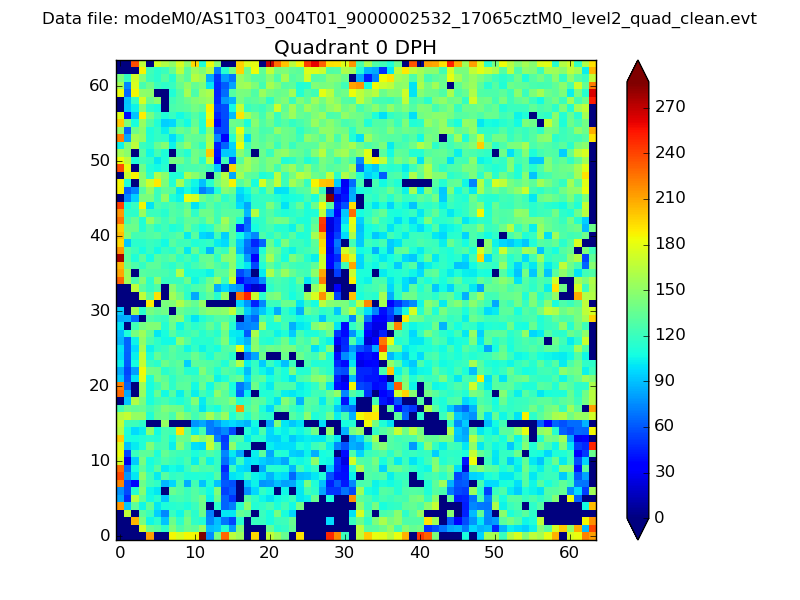 |
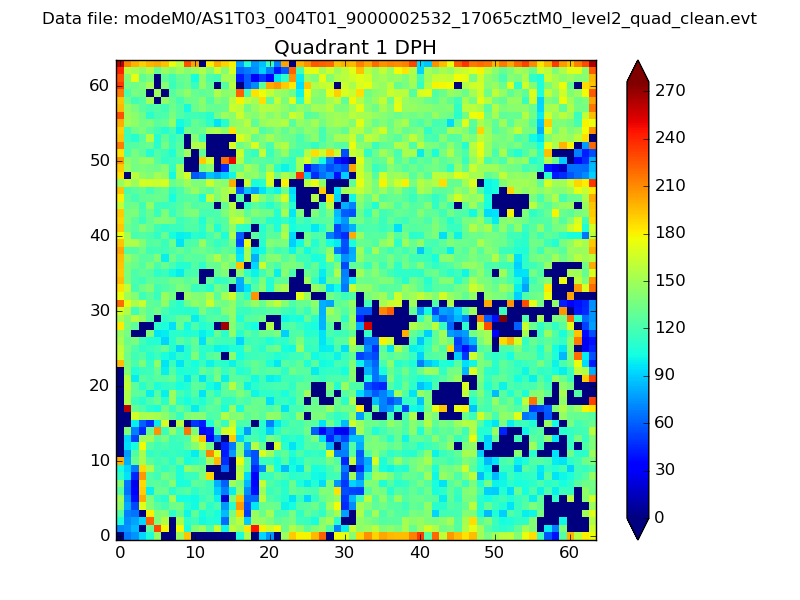 |
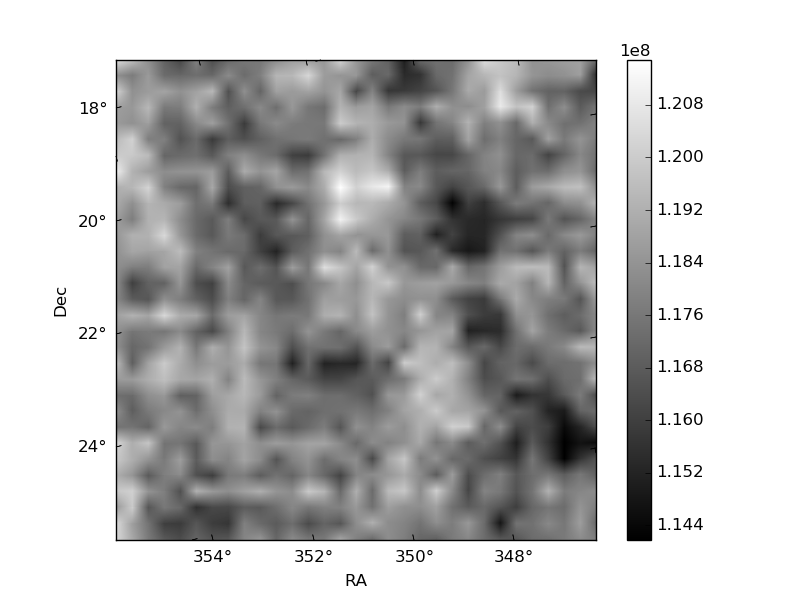
Quadrant B |
|---|---|---|---|
| Quadrant D | 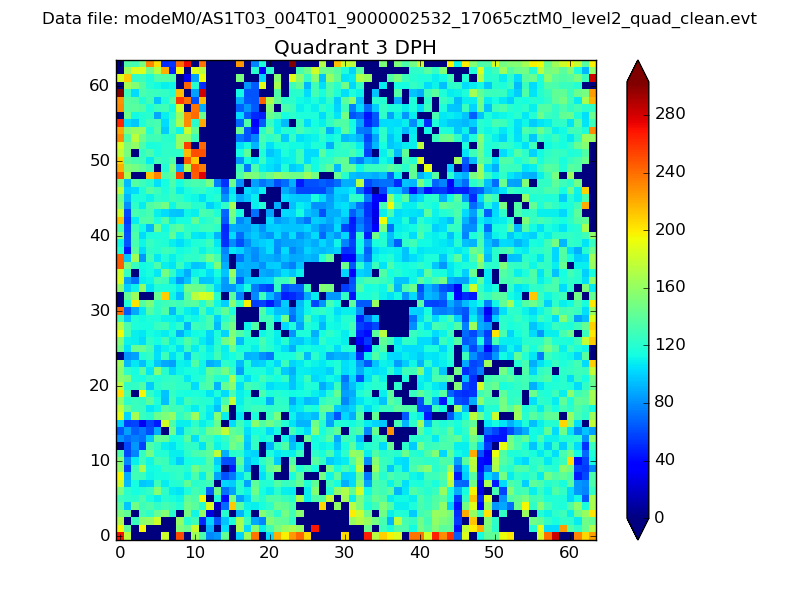 |
 |
Quadrant C |
| Plot type | Count rate plots | Images |
|---|---|---|
| Comparison with Poisson distribution Blue bars denote a histogram of data divided into 1 sec bins. Red curve is a Poisson curve with rate = median count rate of data. |
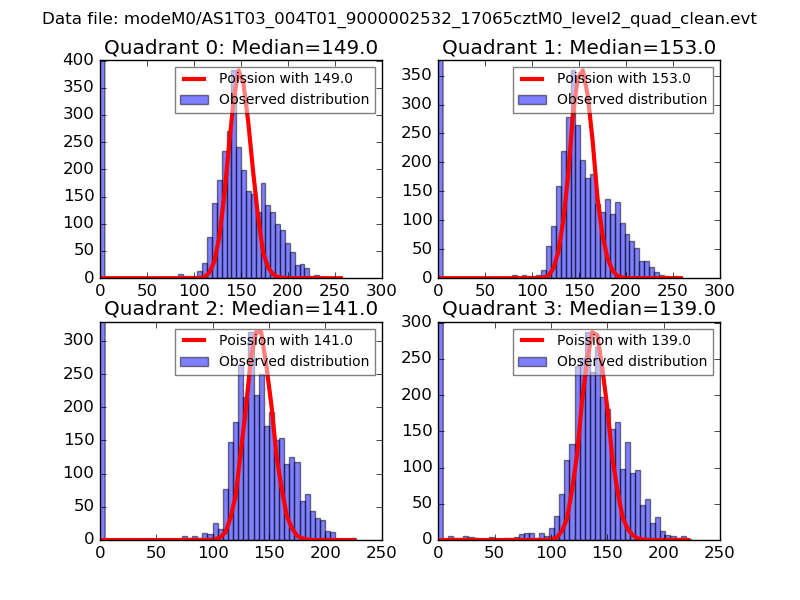 |
 |
| Quadrant-wise count rates Data is divided into 100 sec bins |
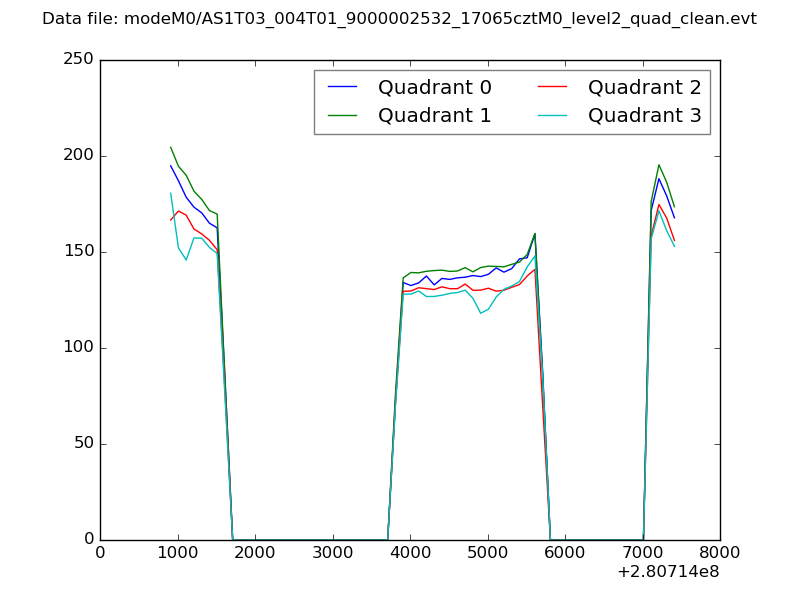 |
|
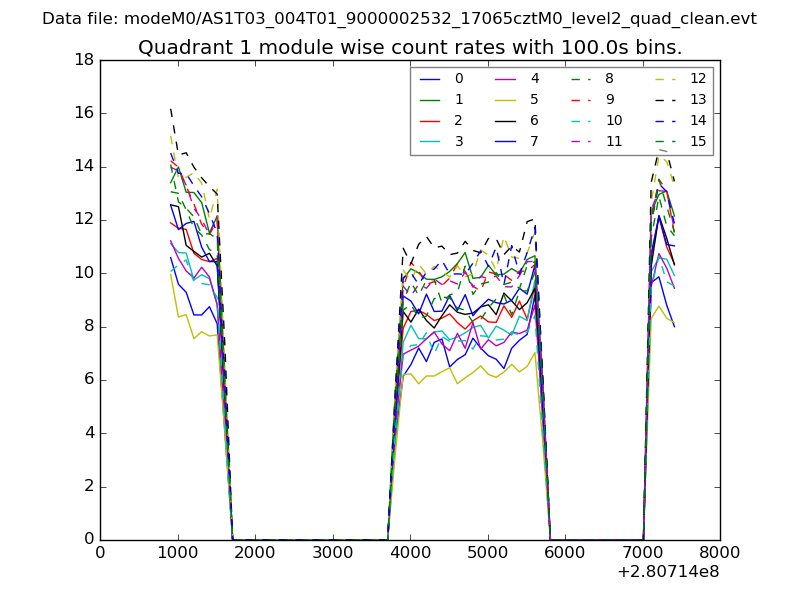
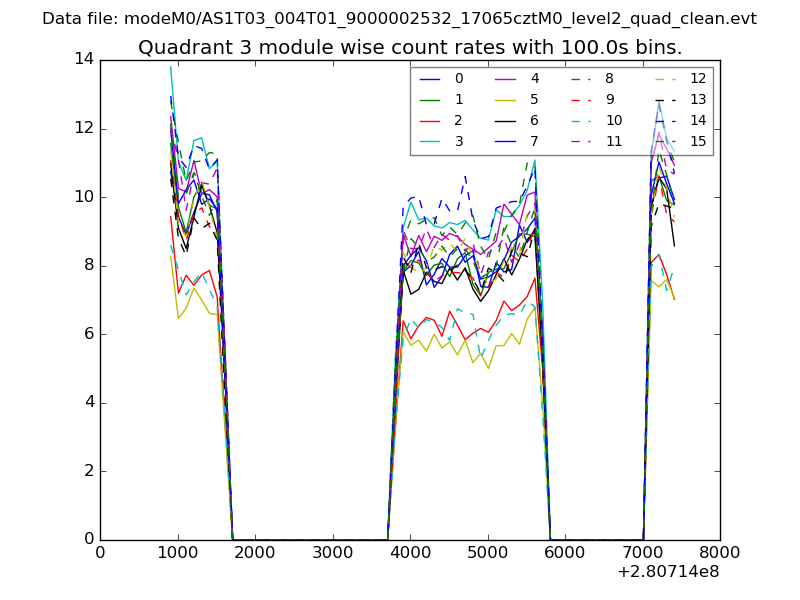
| Module-wise count rates for Quadrant A Data is divided into 100 sec bins |
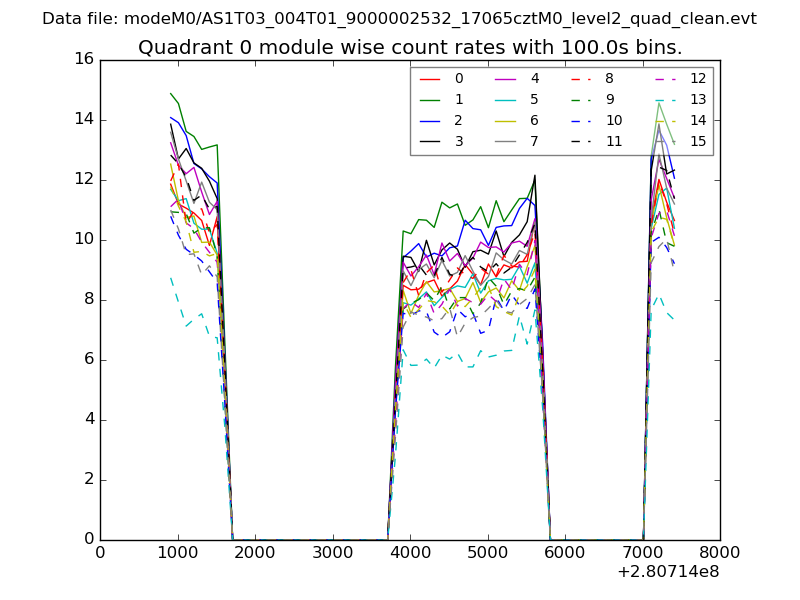 |
 |
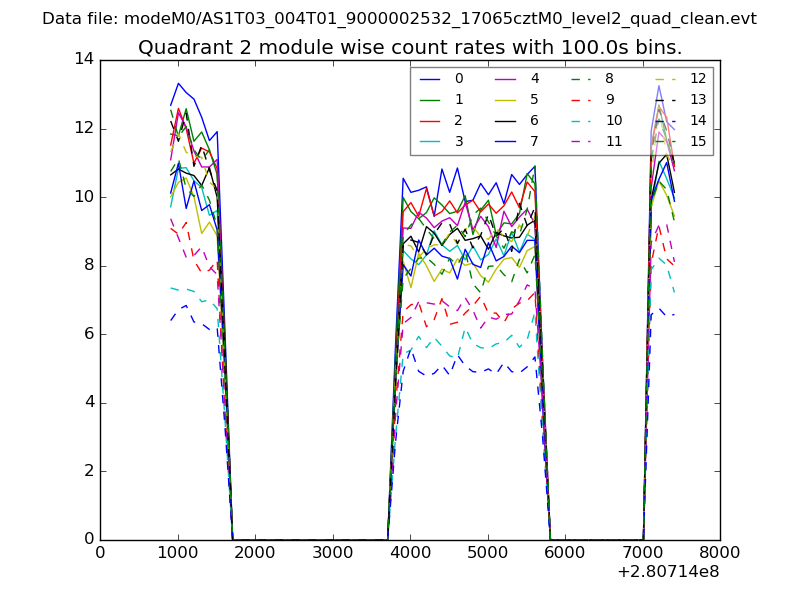
| Module-wise count rates for Quadrant B Data is divided into 100 sec bins |
 |
 |
| Module-wise count rates for Quadrant C Data is divided into 100 sec bins |
 |
 |
| Module-wise count rates for Quadrant D Data is divided into 100 sec bins |
 |
 |
| Parameter | Plot |
|---|---|
| CZT HV Monitor | 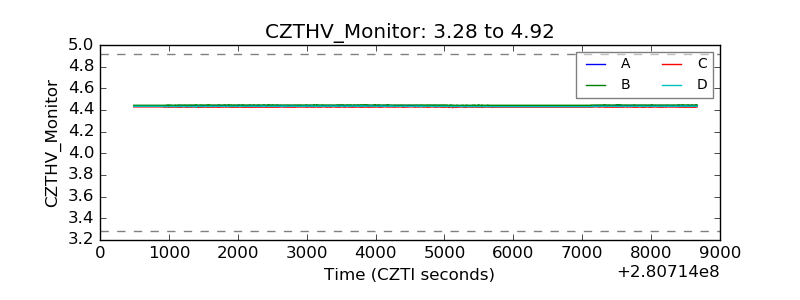 |
| D_VDD | 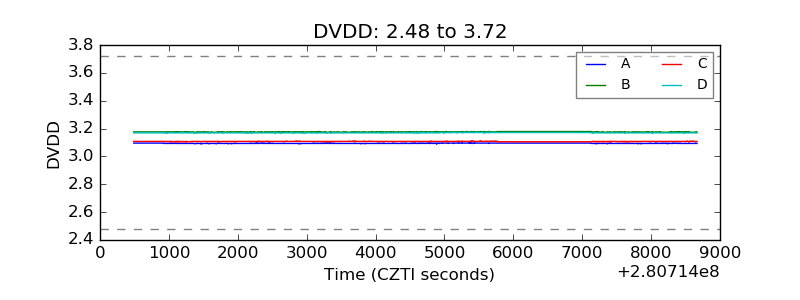 |
| Temperature 1 | 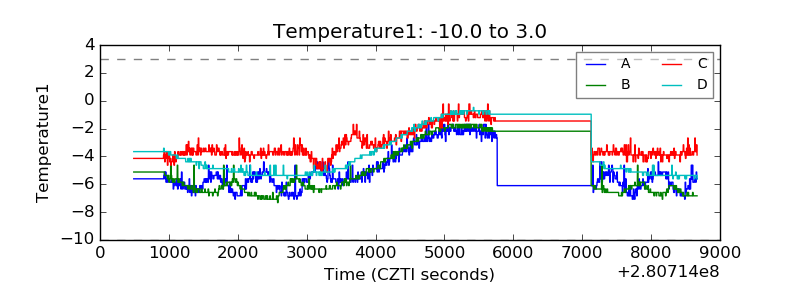 |
| Veto HV Monitor | 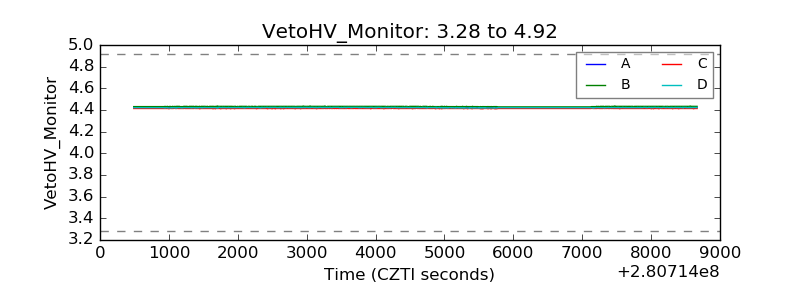 |
| Veto LLD | 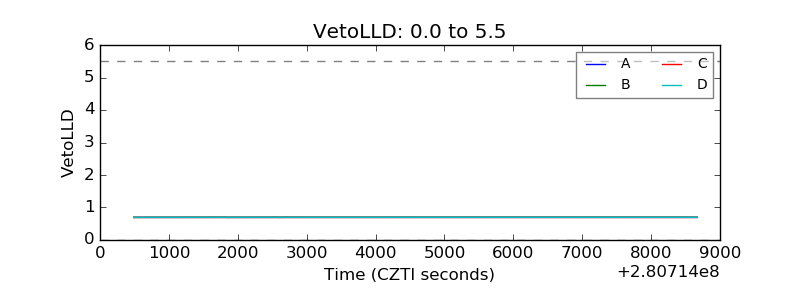 |
| Alpha Counter | 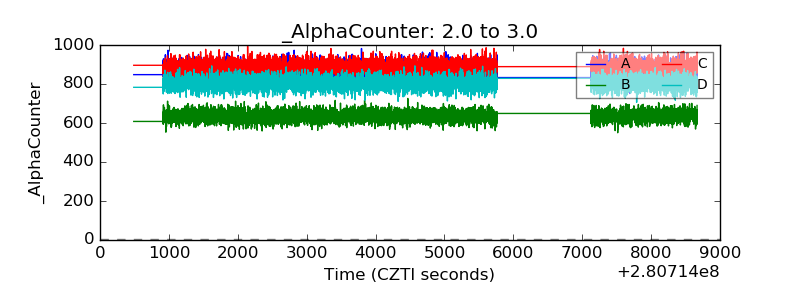 |
| _CPM_Rate | 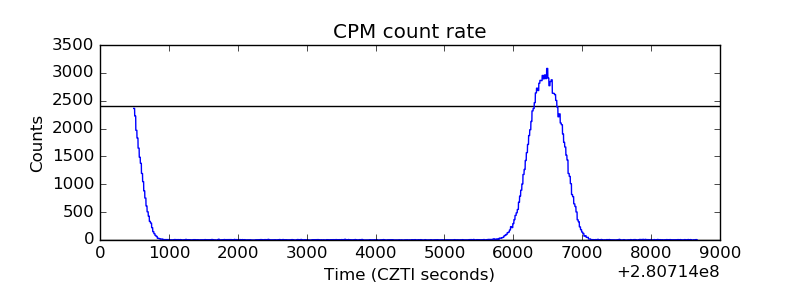 |
| CZT Counter | 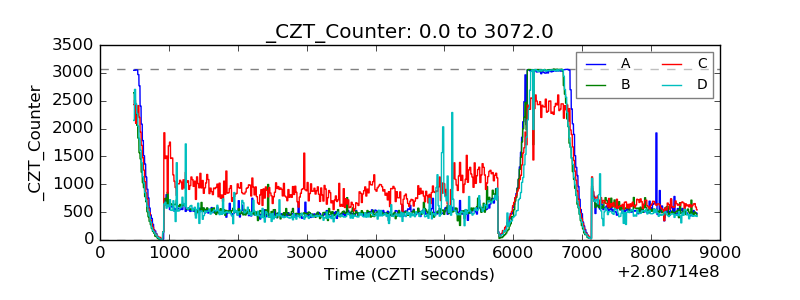 |
| +2.5 Volts monitor |  |
| +5 Volts monitor |  |
| _ROLL_ROT | 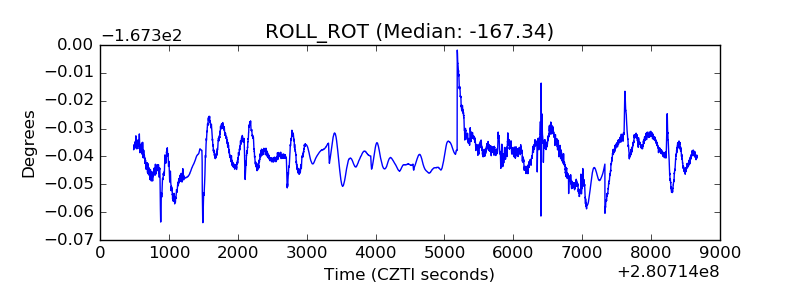 |
| _Roll_DEC | 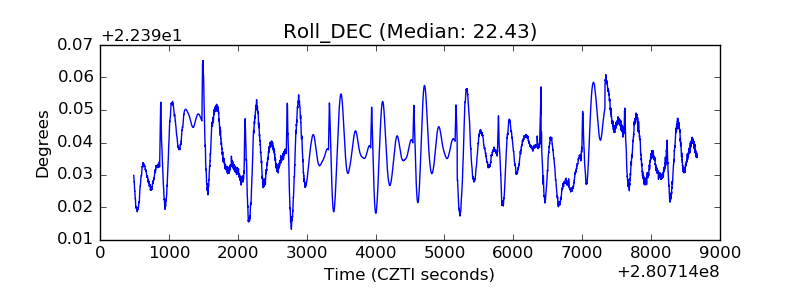 |
| _Roll_RA | 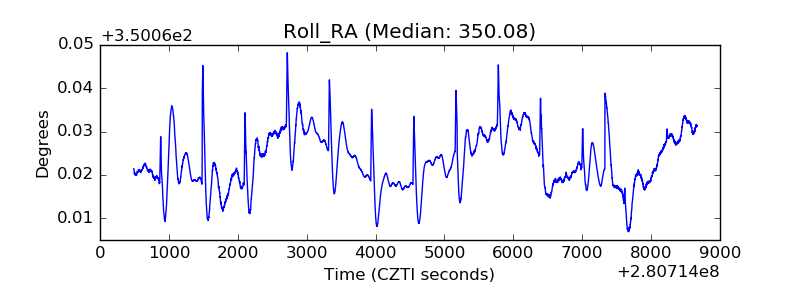 |
| Veto Counter | 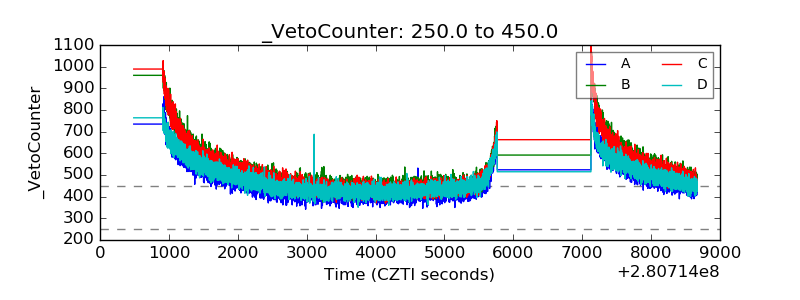 |