| Param | Original file | Final file |
|---|---|---|
| Filename | modeM0/AS1T03_004T01_9000002532_17070cztM0_level2.evt | modeM0/AS1T03_004T01_9000002532_17070cztM0_level2_quad_clean.evt |
| Size (bytes) | 502,718,400 | 90,587,520 |
| Size | 479.4 MB | 86.4 MB |
| Events in quadrant A | 3,559,963 | 560,422 |
| Events in quadrant B | 3,733,461 | 571,020 |
| Events in quadrant C | 3,670,678 | 548,232 |
| Events in quadrant D | 3,745,695 | 536,508 |
| Mode SS | |||
|---|---|---|---|
| Quadrant | BADHDUFLAG | Total packets | Discarded packets |
| A | 0 | 152 | 0 |
| B | 0 | 152 | 0 |
| C | 0 | 152 | 0 |
| D | 0 | 152 | 0 |
| Mode M0 | |||
|---|---|---|---|
| Quadrant | BADHDUFLAG | Total packets | Discarded packets |
| A | 0 | 15612 | 1 |
| B | 0 | 15840 | 1 |
| C | 0 | 15762 | 1 |
| D | 0 | 16424 | 1 |
| Quadrant | Total seconds | Saturated seconds | Saturation percentage |
|---|---|---|---|
| A | 7575 | 227 | 2.996700% |
| B | 7575 | 246 | 3.247525% |
| C | 7575 | 223 | 2.943894% |
| D | 7576 | 173 | 2.283527% |
Noise dominated data is calculated using 1-second bins in cleaned event files. If a bin has >2000 counts, and if more than 50% of those come from <1% of pixels, then it is considered to be noise-dominated and hence unusable.
| Quadrant | # 1 sec bins | Bins with >0 counts | Bins with >2000 counts | High rate bins dominated by noise | Noise dominated (total time) | Noise dominated (detector-on time) | Marked lightcurve |
|---|---|---|---|---|---|---|---|
| A | 7615 | 7576 | 0 | 0 | 0.00% | 0.00% | 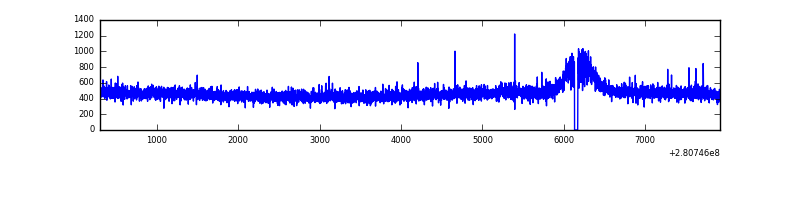 |
| B | 7615 | 7576 | 1 | 1 | 0.01% | 0.01% | 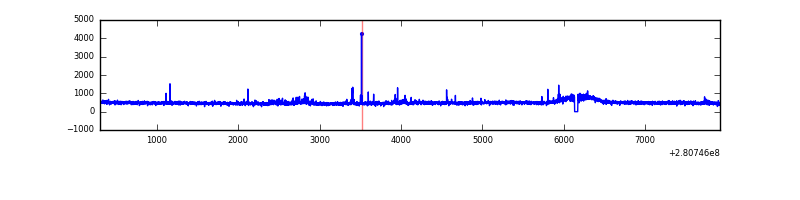 |
| C | 7615 | 7576 | 0 | 0 | 0.00% | 0.00% | 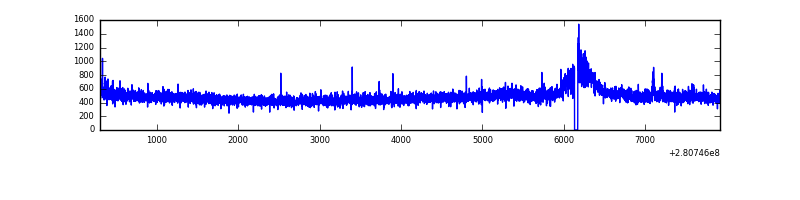 |
| D | 7616 | 7577 | 29 | 29 | 0.38% | 0.38% | 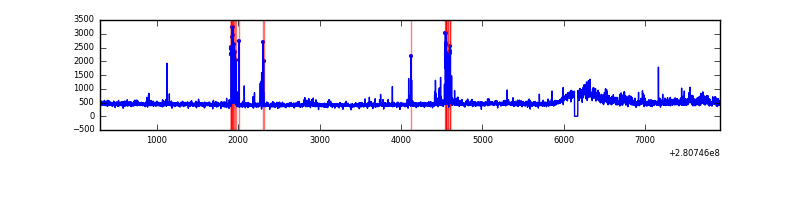 |
Top three noisy pixels from each quadrant. If the there are fewer than three noisy pixels in the level2.evt file, extra rows are filled as -1
| Pixel properties | Quadrant properties | ||||||
|---|---|---|---|---|---|---|---|
| Quadrant | DetID | PixID | Counts | Sigma | Mean | Median | Sigma |
| A | 0 | 226 | 8000 | 37.75 | 924 | 900 | 188.1 |
| A | 3 | 137 | 6906 | 31.93 | 924 | 900 | 188.1 |
| A | 12 | 194 | 6821 | 31.48 | 924 | 900 | 188.1 |
| B | 3 | 209 | 40507 | 221.09 | 920 | 896 | 179.2 |
| B | 0 | 219 | 26500 | 142.91 | 920 | 896 | 179.2 |
| B | 0 | 197 | 22202 | 118.92 | 920 | 896 | 179.2 |
| C | 14 | 238 | 136640 | 651.97 | 882 | 886 | 208.2 |
| C | 3 | 233 | 82326 | 391.12 | 882 | 886 | 208.2 |
| C | 13 | 61 | 6277 | 25.89 | 882 | 886 | 208.2 |
| D | 5 | 222 | 175084 | 790.53 | 898 | 867 | 220.4 |
| D | 10 | 70 | 150153 | 677.4 | 898 | 867 | 220.4 |
| D | 2 | 234 | 31209 | 137.68 | 898 | 867 | 220.4 |
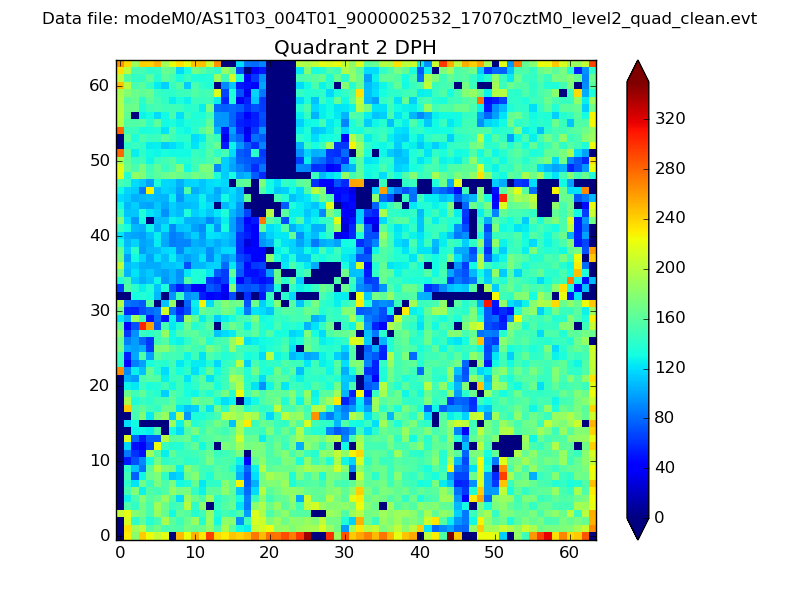
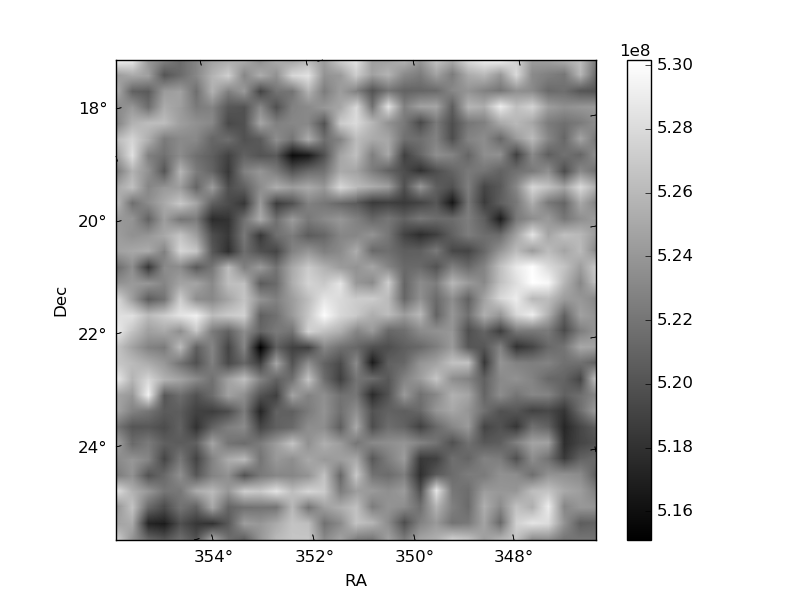
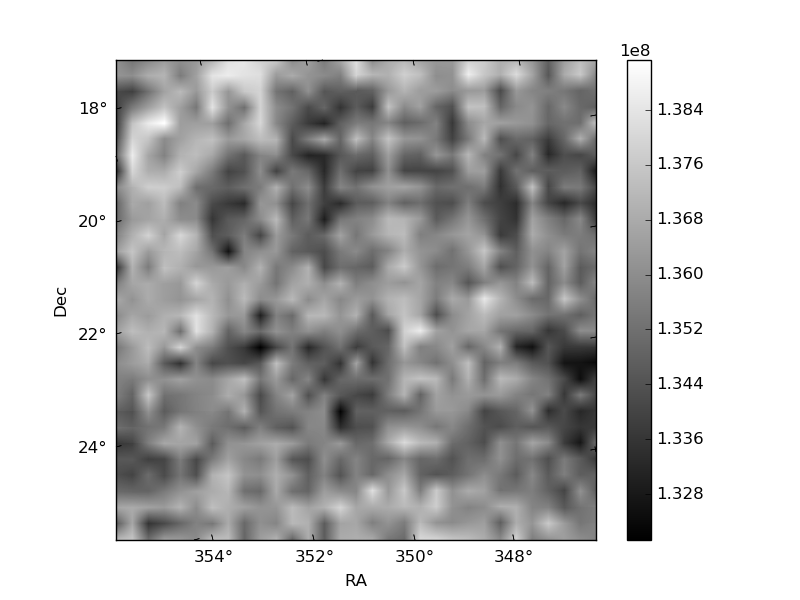
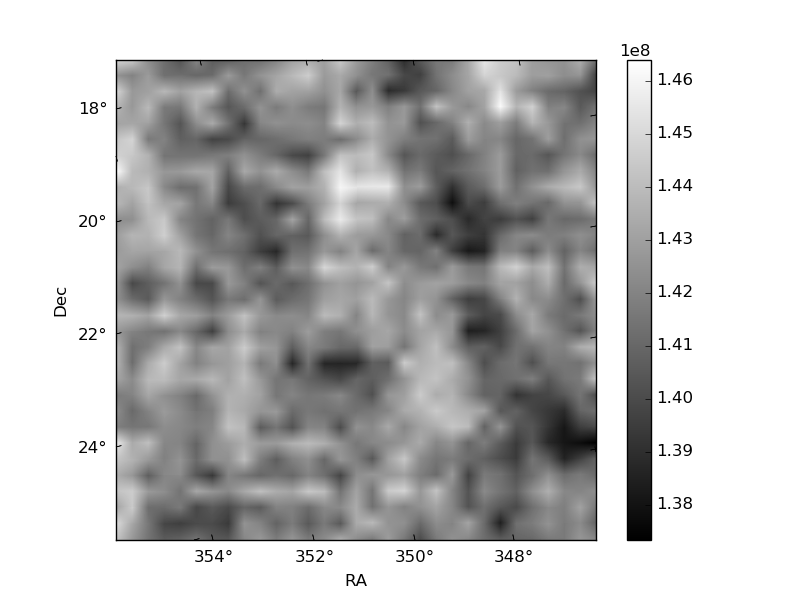
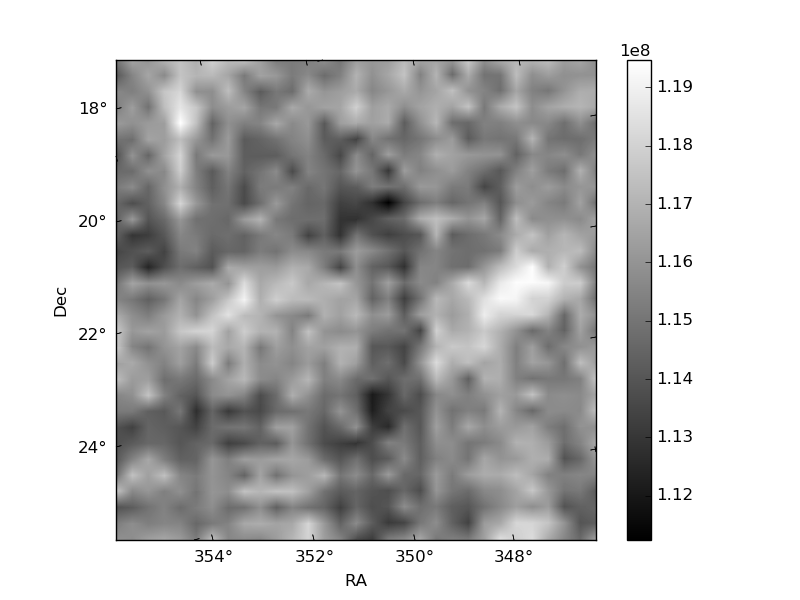
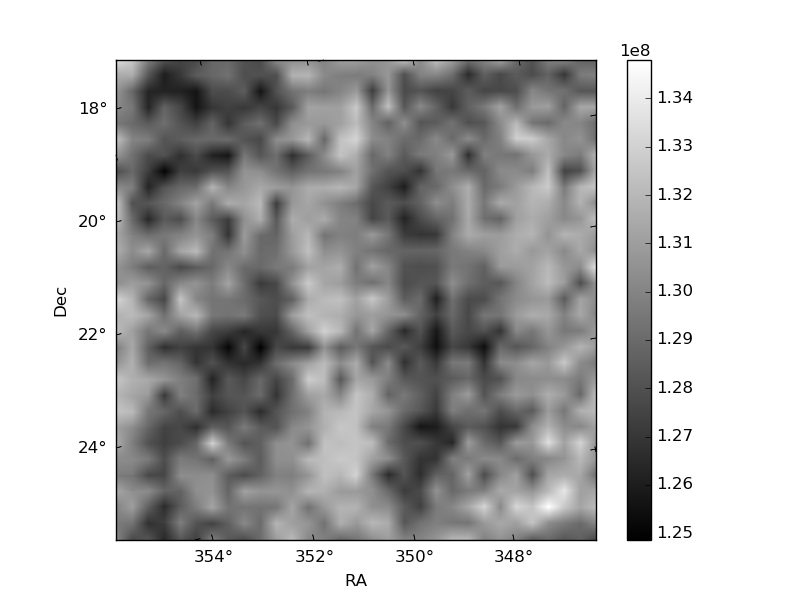
Histogram calculated using DETX and DETY for each event in the final _common_clean file
| Quadrant A | 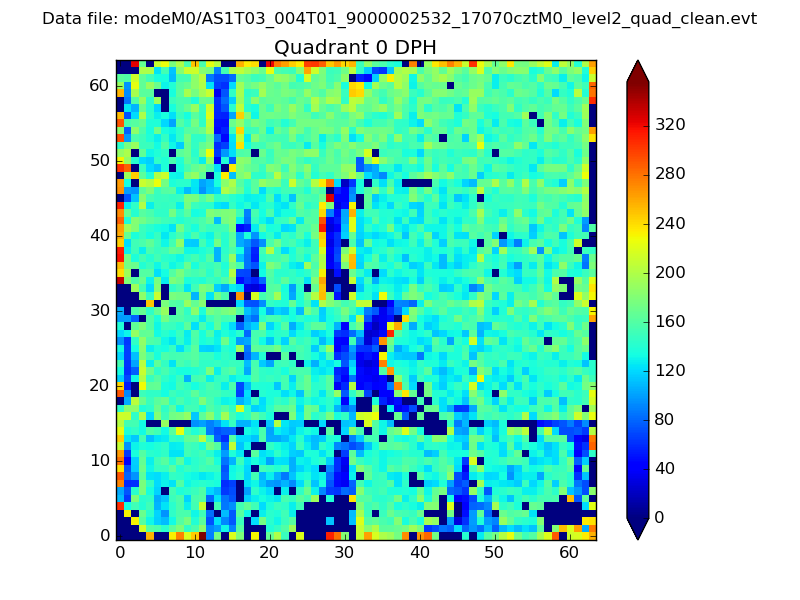 |
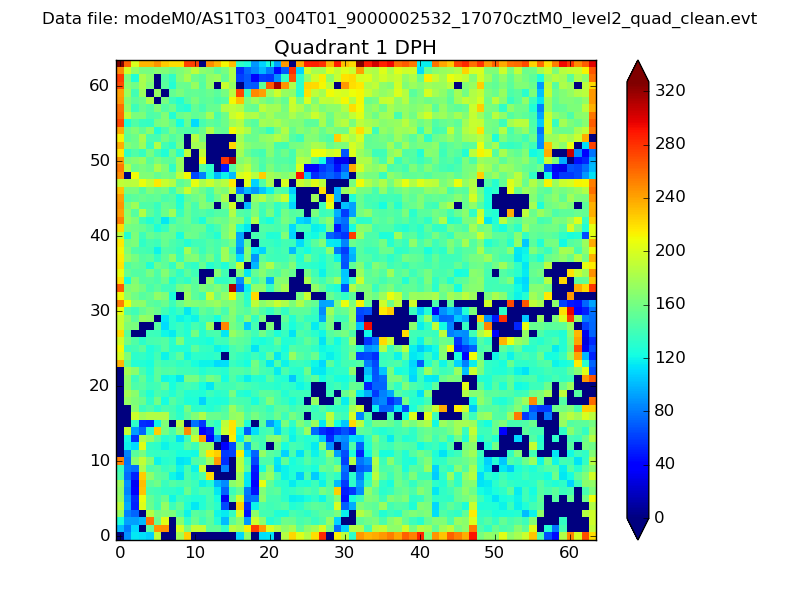 |
Quadrant B |
|---|---|---|---|
| Quadrant D | 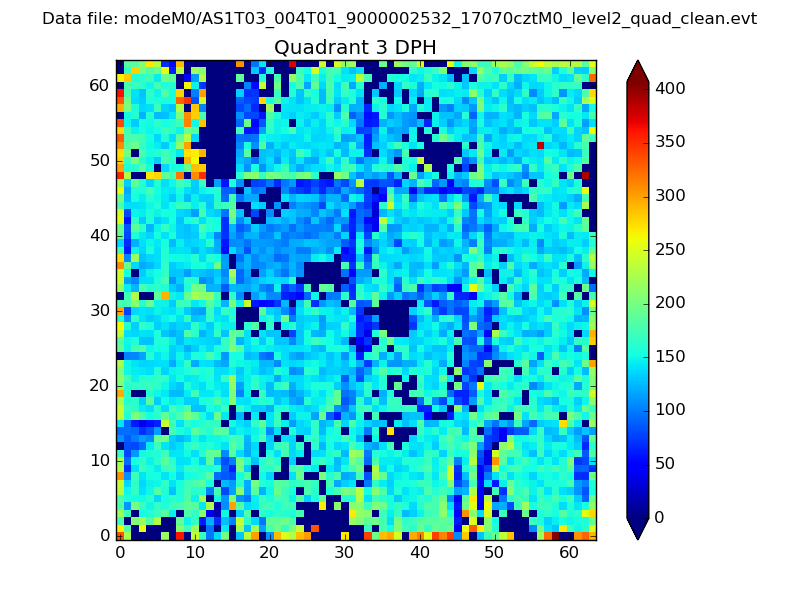 |
 |
Quadrant C |
| Plot type | Count rate plots | Images |
|---|---|---|
| Comparison with Poisson distribution Blue bars denote a histogram of data divided into 1 sec bins. Red curve is a Poisson curve with rate = median count rate of data. |
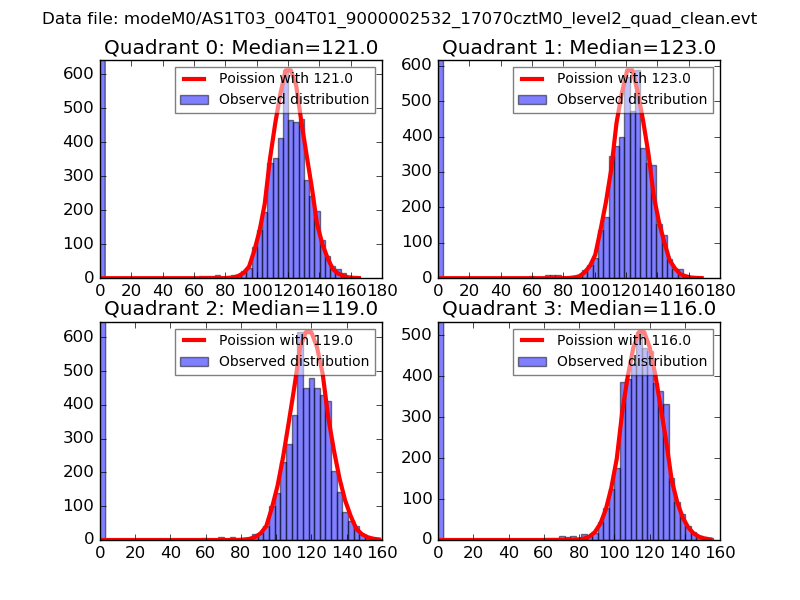 |
 |
| Quadrant-wise count rates Data is divided into 100 sec bins |
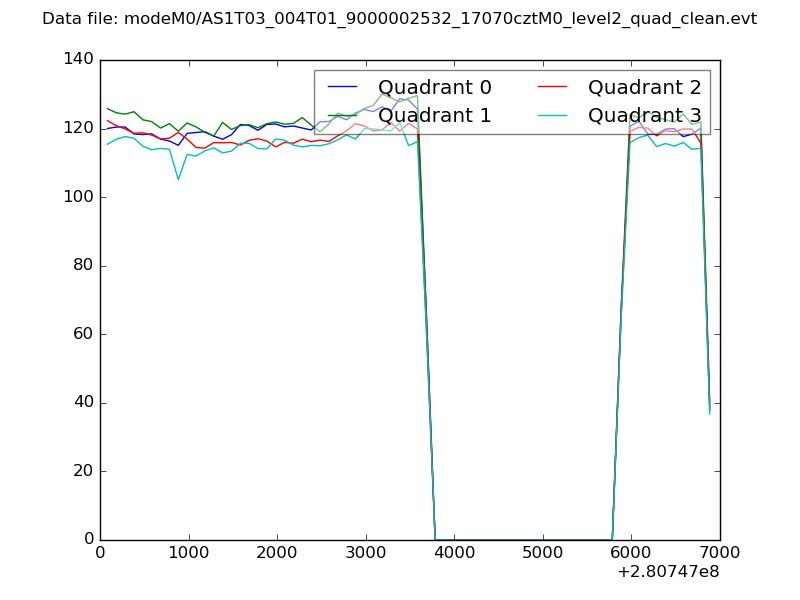 |
|
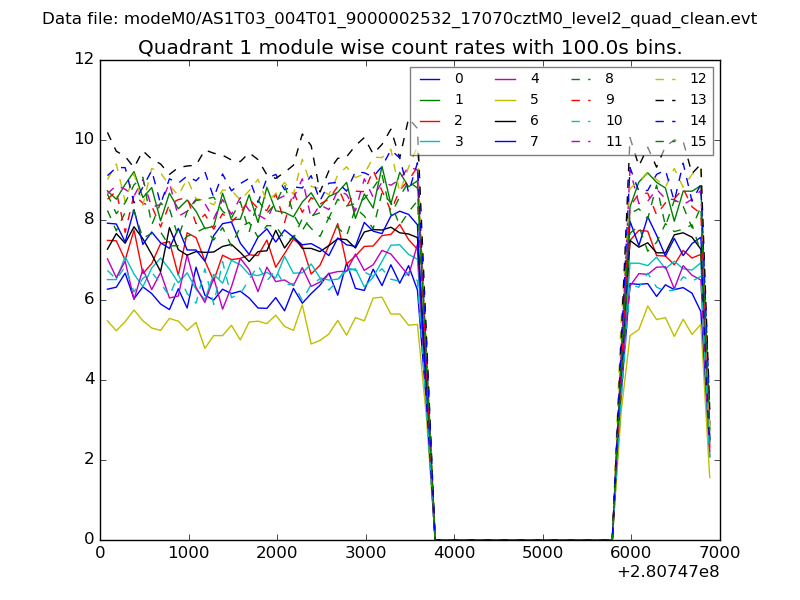
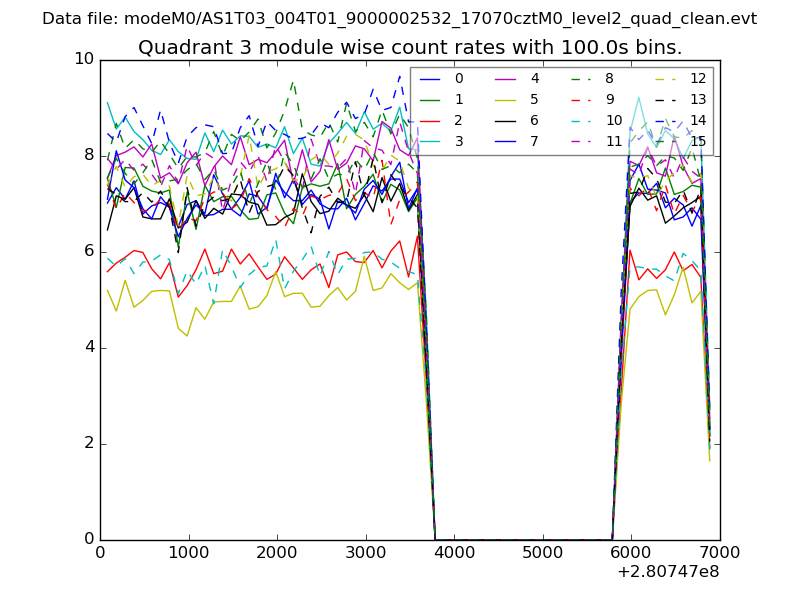
| Module-wise count rates for Quadrant A Data is divided into 100 sec bins |
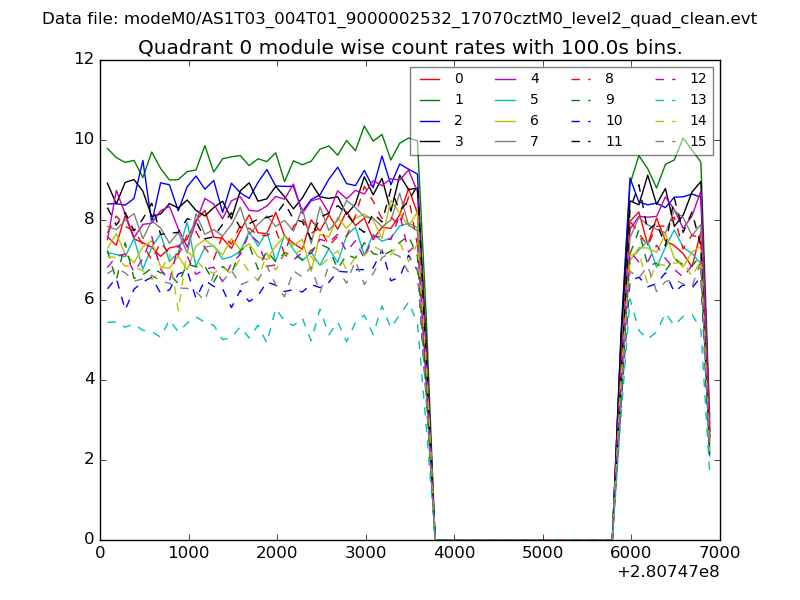 |
 |
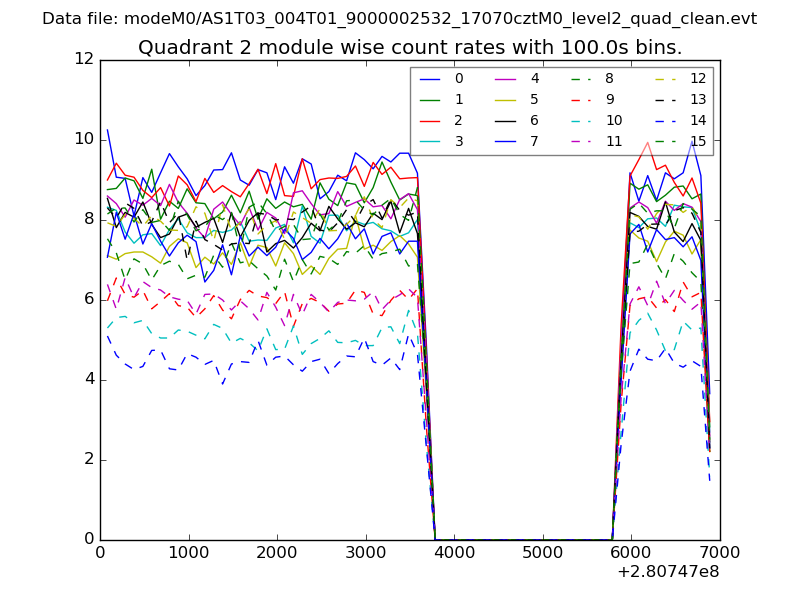
| Module-wise count rates for Quadrant B Data is divided into 100 sec bins |
 |
 |
| Module-wise count rates for Quadrant C Data is divided into 100 sec bins |
 |
 |
| Module-wise count rates for Quadrant D Data is divided into 100 sec bins |
 |
 |
| Parameter | Plot |
|---|---|
| CZT HV Monitor | 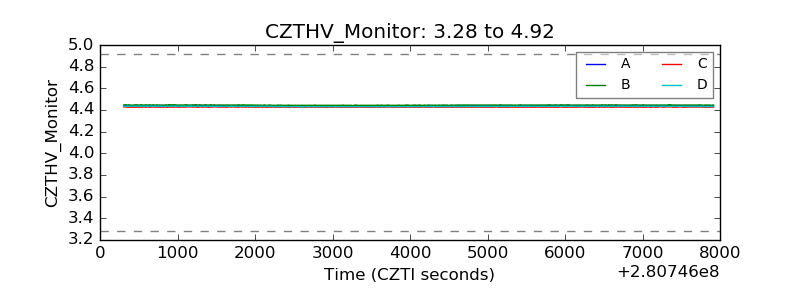 |
| D_VDD |  |
| Temperature 1 |  |
| Veto HV Monitor | 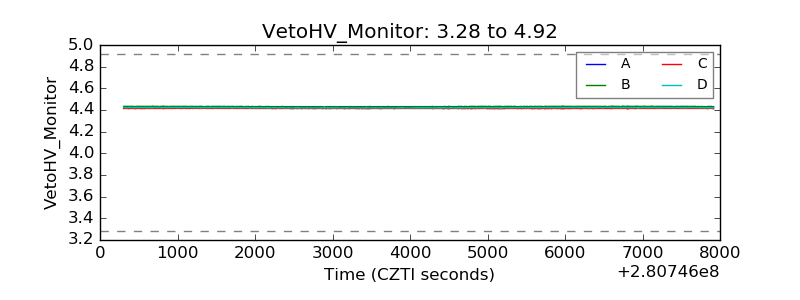 |
| Veto LLD | 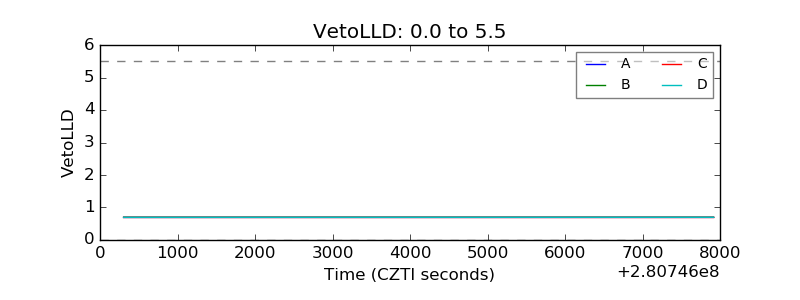 |
| Alpha Counter | 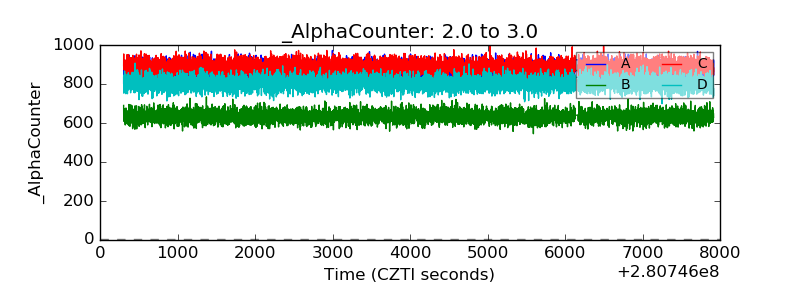 |
| _CPM_Rate | 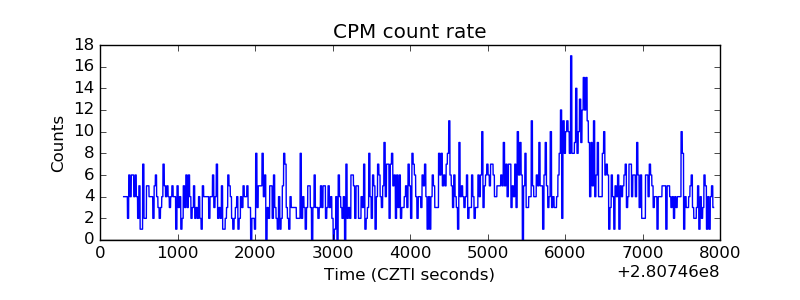 |
| CZT Counter | 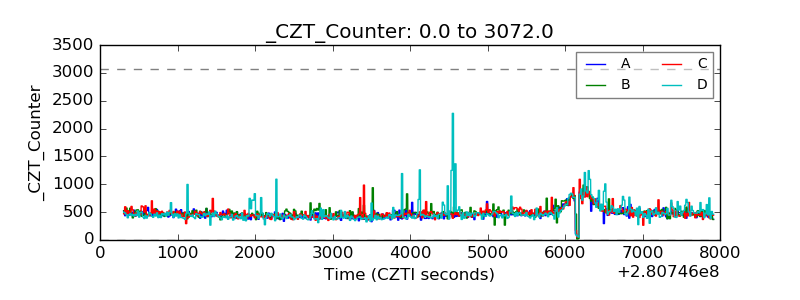 |
| +2.5 Volts monitor |  |
| +5 Volts monitor |  |
| _ROLL_ROT | 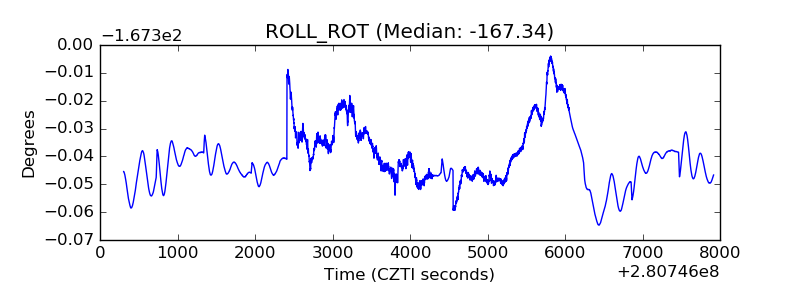 |
| _Roll_DEC | 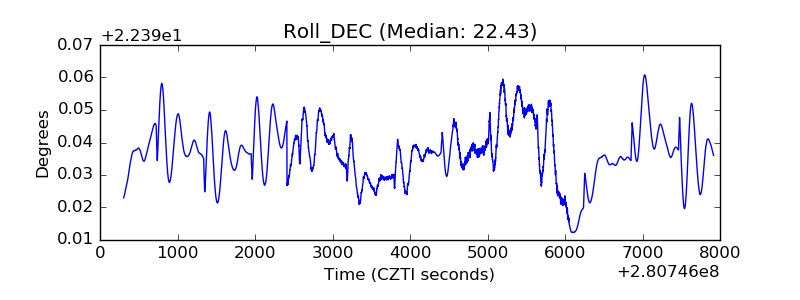 |
| _Roll_RA | 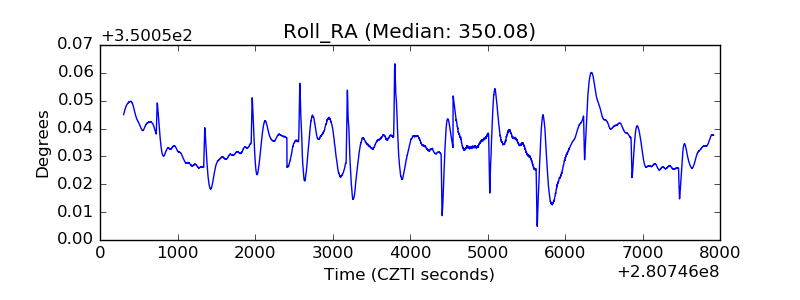 |
| Veto Counter | 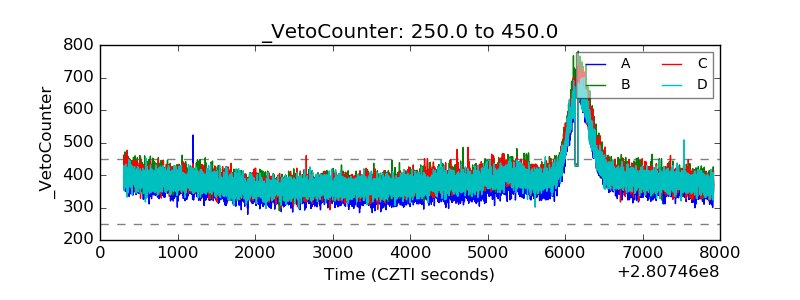 |