| Param | Original file | Final file |
|---|---|---|
| Filename | modeM0/AS1T03_004T01_9000002532_17073cztM0_level2.evt | modeM0/AS1T03_004T01_9000002532_17073cztM0_level2_quad_clean.evt |
| Size (bytes) | 691,534,080 | 124,983,360 |
| Size | 659.5 MB | 119.2 MB |
| Events in quadrant A | 4,668,553 | 780,405 |
| Events in quadrant B | 4,990,269 | 787,456 |
| Events in quadrant C | 4,880,901 | 759,003 |
| Events in quadrant D | 5,697,301 | 736,941 |
| Mode SS | |||
|---|---|---|---|
| Quadrant | BADHDUFLAG | Total packets | Discarded packets |
| A | 0 | 210 | 0 |
| B | 0 | 210 | 0 |
| C | 0 | 210 | 0 |
| D | 0 | 210 | 0 |
| Mode M9 | |||
|---|---|---|---|
| Quadrant | BADHDUFLAG | Total packets | Discarded packets |
| A | 0 | 5 | 0 |
| B | 0 | 5 | 0 |
| C | 0 | 5 | 0 |
| D | 0 | 5 | 0 |
| Mode M0 | |||
|---|---|---|---|
| Quadrant | BADHDUFLAG | Total packets | Discarded packets |
| A | 0 | 21150 | 1 |
| B | 0 | 21677 | 1 |
| C | 0 | 21222 | 1 |
| D | 0 | 24285 | 1 |
| Quadrant | Total seconds | Saturated seconds | Saturation percentage |
|---|---|---|---|
| A | 10414 | 87 | 0.835414% |
| B | 10414 | 108 | 1.037065% |
| C | 10414 | 119 | 1.142693% |
| D | 10414 | 167 | 1.603611% |
Noise dominated data is calculated using 1-second bins in cleaned event files. If a bin has >2000 counts, and if more than 50% of those come from <1% of pixels, then it is considered to be noise-dominated and hence unusable.
| Quadrant | # 1 sec bins | Bins with >0 counts | Bins with >2000 counts | High rate bins dominated by noise | Noise dominated (total time) | Noise dominated (detector-on time) | Marked lightcurve |
|---|---|---|---|---|---|---|---|
| A | 10899 | 10414 | 0 | 0 | 0.00% | 0.00% | 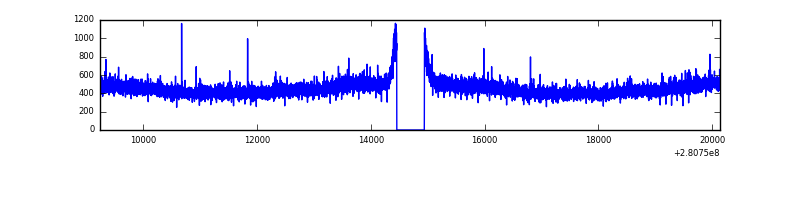 |
| B | 10899 | 10414 | 8 | 8 | 0.07% | 0.08% | 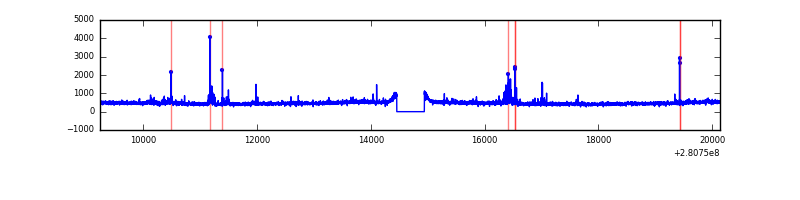 |
| C | 10899 | 10415 | 0 | 0 | 0.00% | 0.00% | 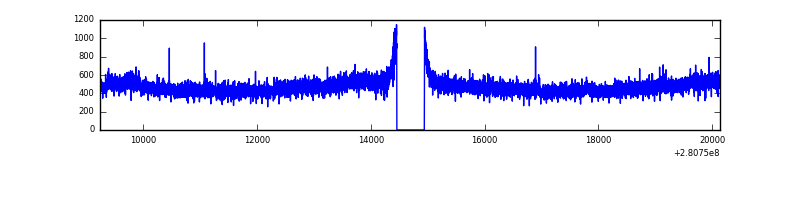 |
| D | 10899 | 10415 | 64 | 64 | 0.59% | 0.61% | 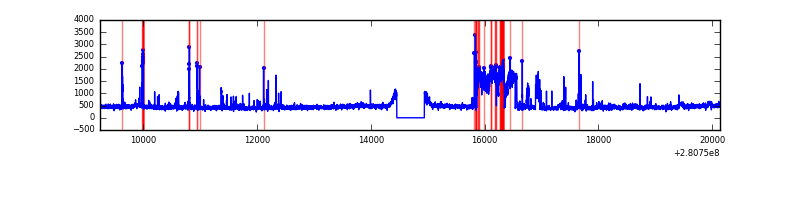 |
Top three noisy pixels from each quadrant. If the there are fewer than three noisy pixels in the level2.evt file, extra rows are filled as -1
| Pixel properties | Quadrant properties | ||||||
|---|---|---|---|---|---|---|---|
| Quadrant | DetID | PixID | Counts | Sigma | Mean | Median | Sigma |
| A | 0 | 226 | 10482 | 37.89 | 1213 | 1184 | 245.4 |
| A | 3 | 137 | 8781 | 30.96 | 1213 | 1184 | 245.4 |
| A | 12 | 194 | 8733 | 30.76 | 1213 | 1184 | 245.4 |
| B | 0 | 189 | 68048 | 283.86 | 1213 | 1180 | 235.6 |
| B | 4 | 216 | 54893 | 228.01 | 1213 | 1180 | 235.6 |
| B | 0 | 197 | 52251 | 216.8 | 1213 | 1180 | 235.6 |
| C | 14 | 238 | 180342 | 655.04 | 1167 | 1175 | 273.5 |
| C | 3 | 233 | 142582 | 516.99 | 1167 | 1175 | 273.5 |
| C | 7 | 247 | 11467 | 37.63 | 1167 | 1175 | 273.5 |
| D | 1 | 52 | 951535 | 3293.42 | 1181 | 1144 | 288.6 |
| D | 10 | 70 | 83265 | 284.58 | 1181 | 1144 | 288.6 |
| D | 2 | 152 | 81635 | 278.93 | 1181 | 1144 | 288.6 |
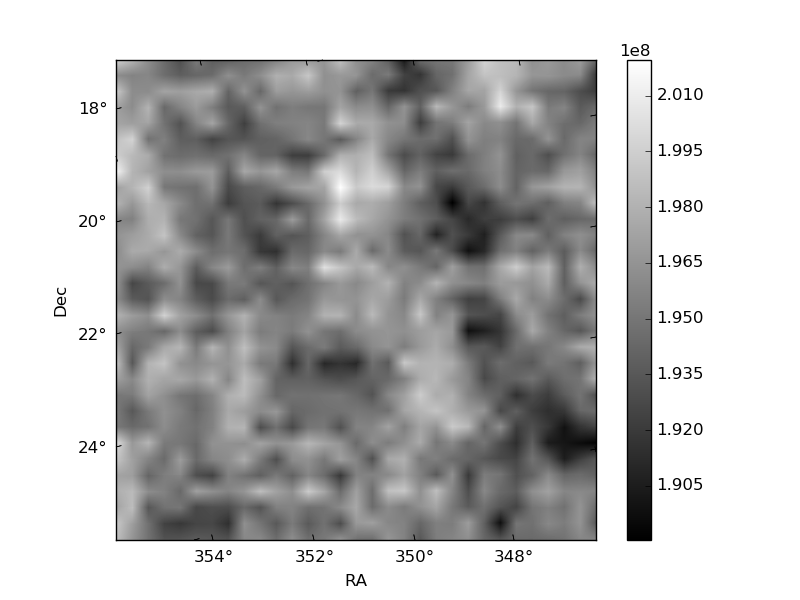
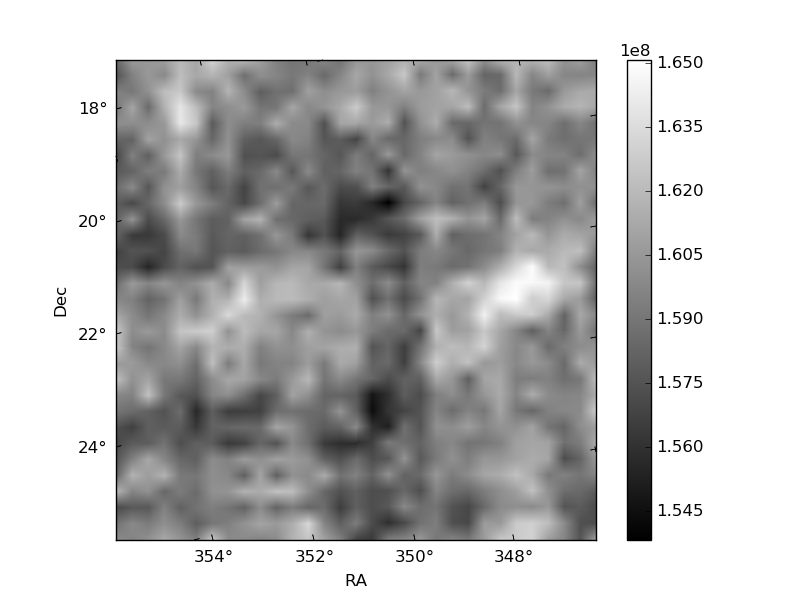
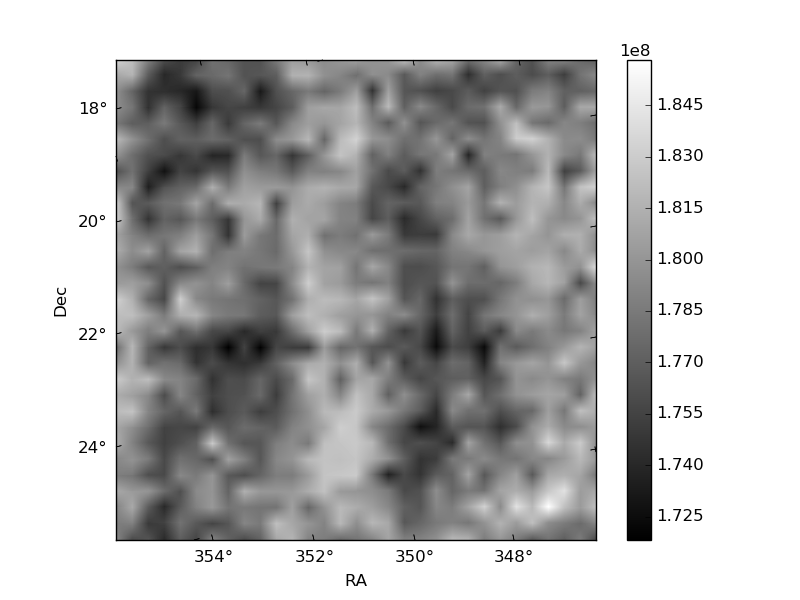
Histogram calculated using DETX and DETY for each event in the final _common_clean file
| Quadrant A | 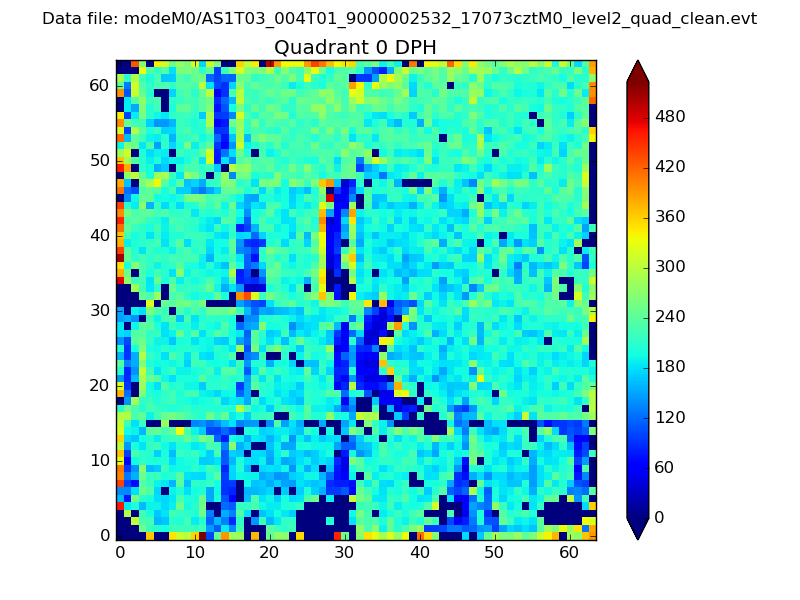 |
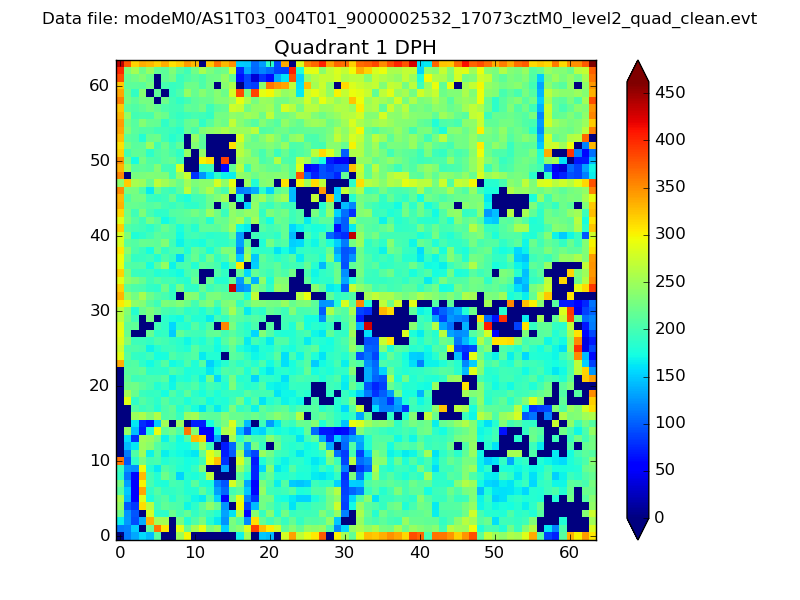 |
Quadrant B |
|---|---|---|---|
| Quadrant D | 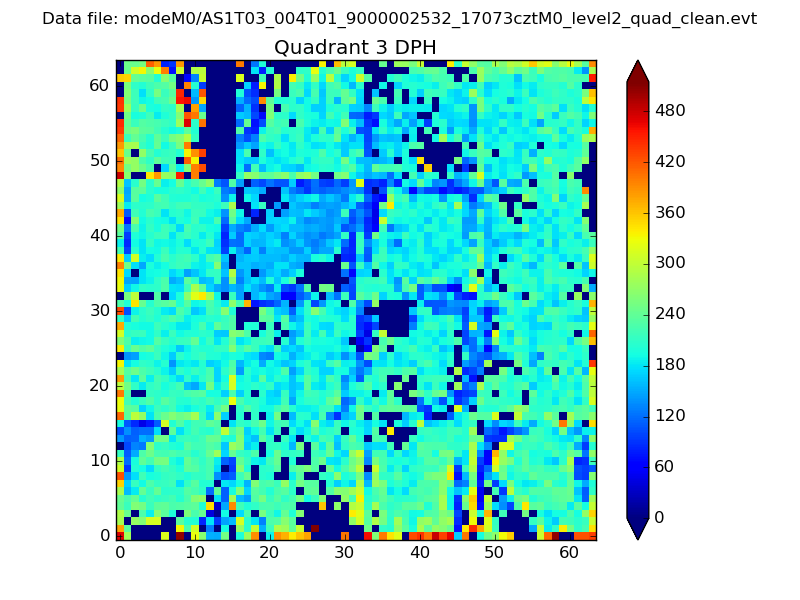 |
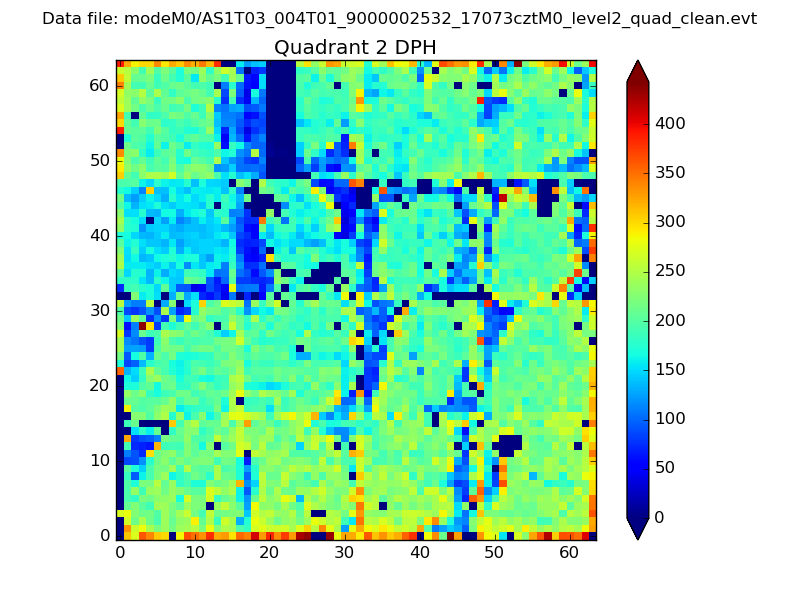 |
Quadrant C |
| Plot type | Count rate plots | Images |
|---|---|---|
| Comparison with Poisson distribution Blue bars denote a histogram of data divided into 1 sec bins. Red curve is a Poisson curve with rate = median count rate of data. |
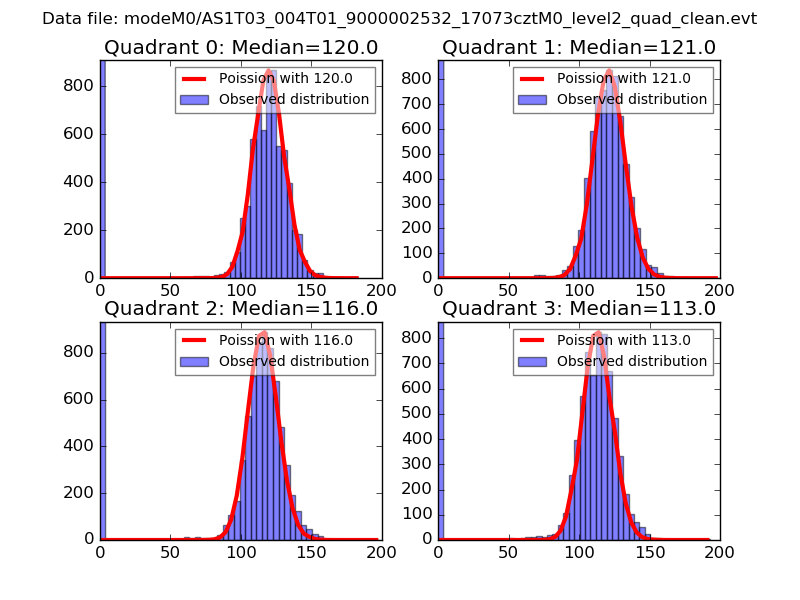 |
 |
| Quadrant-wise count rates Data is divided into 100 sec bins |
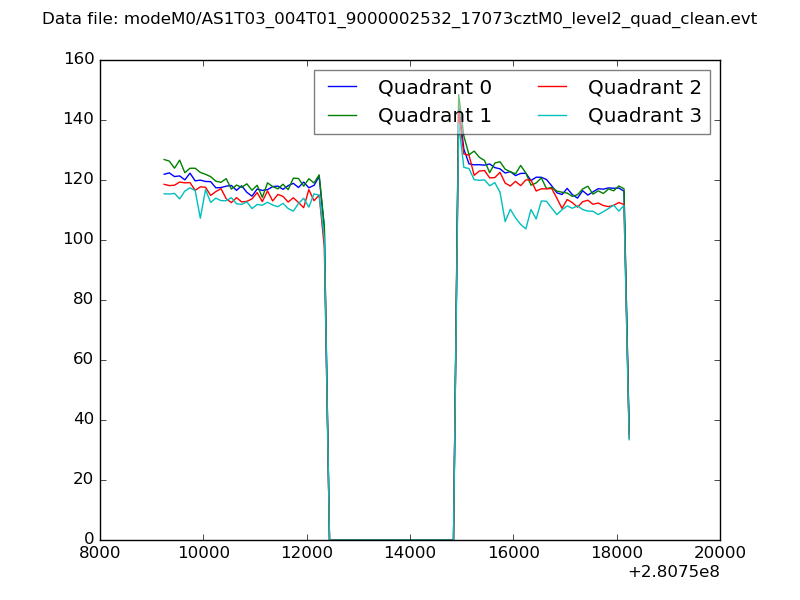 |
|
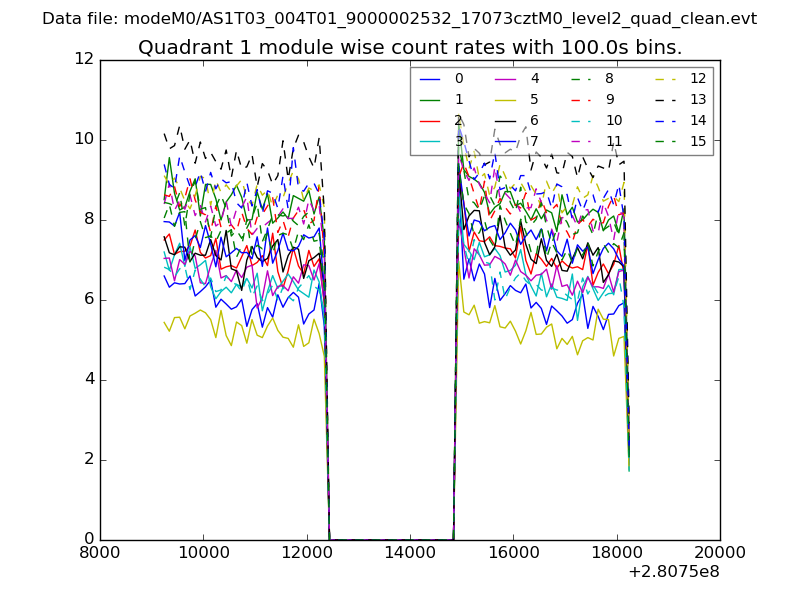
| Module-wise count rates for Quadrant A Data is divided into 100 sec bins |
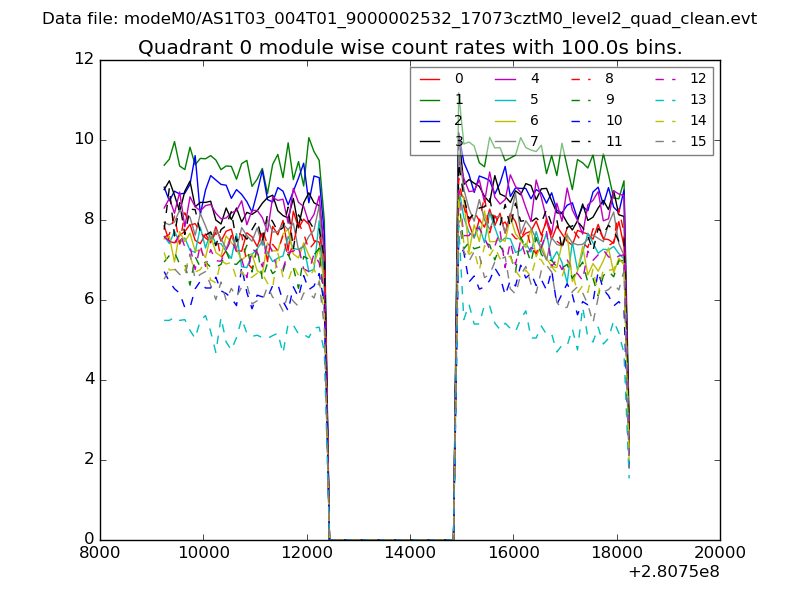 |
 |
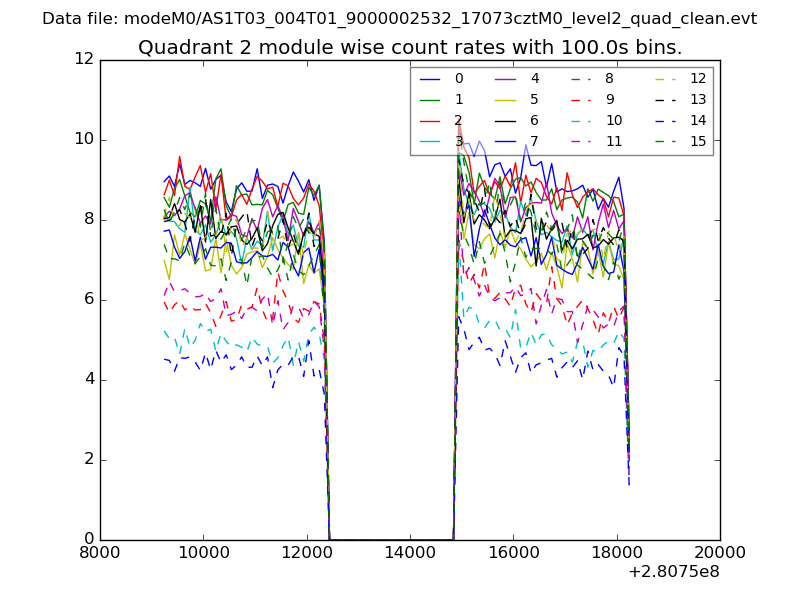
| Module-wise count rates for Quadrant B Data is divided into 100 sec bins |
 |
 |
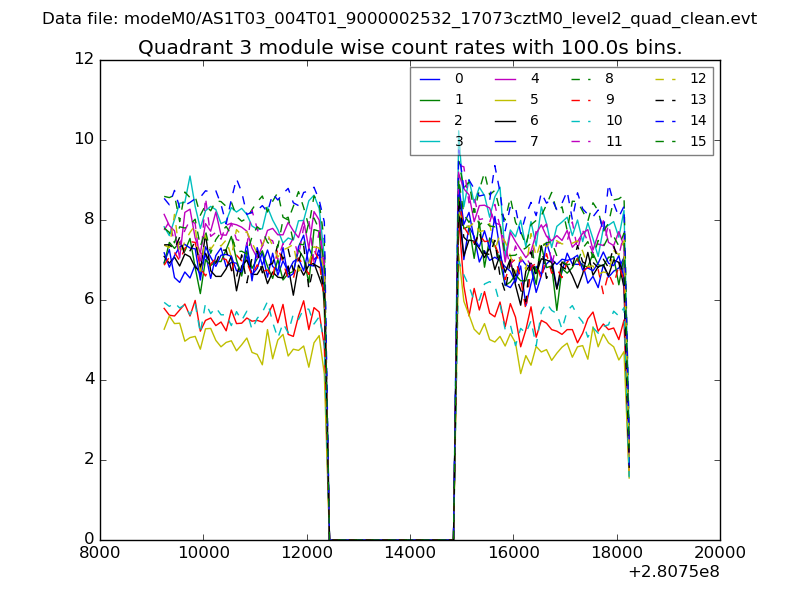
| Module-wise count rates for Quadrant C Data is divided into 100 sec bins |
 |
 |
| Module-wise count rates for Quadrant D Data is divided into 100 sec bins |
 |
 |
| Parameter | Plot |
|---|---|
| CZT HV Monitor | 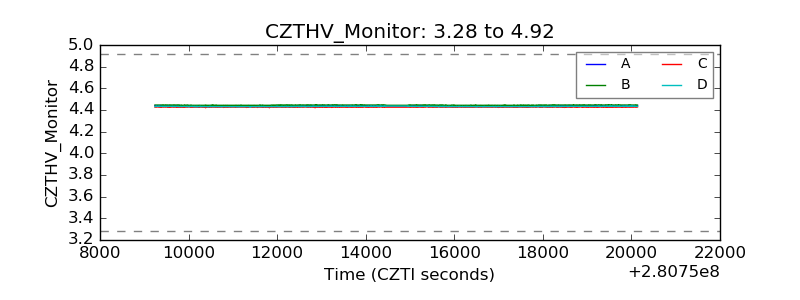 |
| D_VDD |  |
| Temperature 1 | 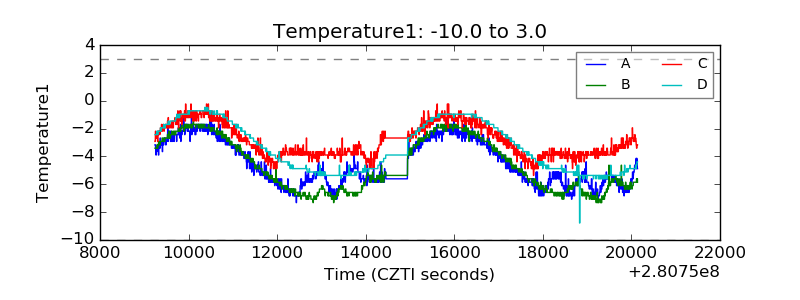 |
| Veto HV Monitor | 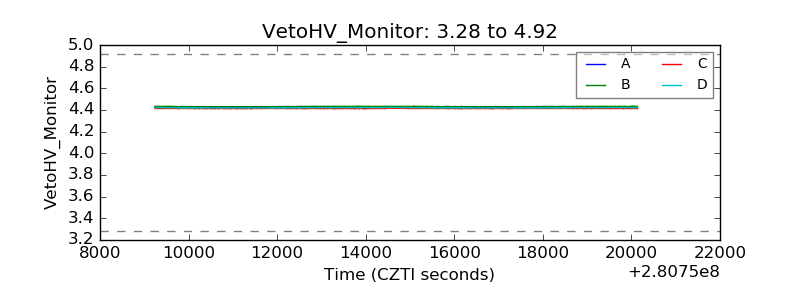 |
| Veto LLD | 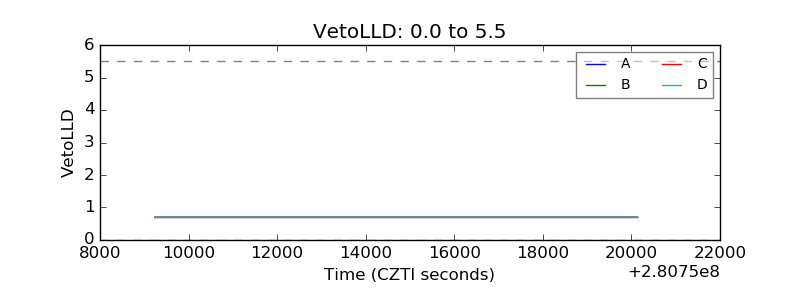 |
| Alpha Counter | 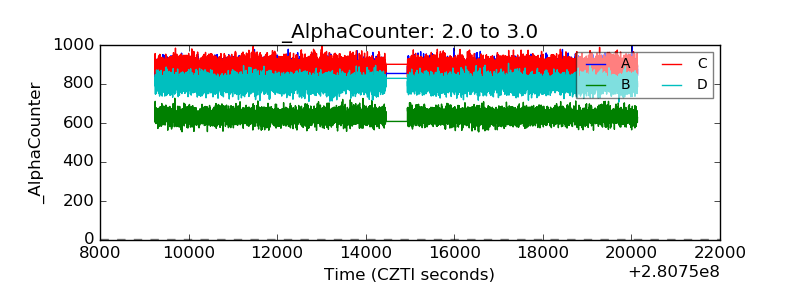 |
| _CPM_Rate |  |
| CZT Counter | 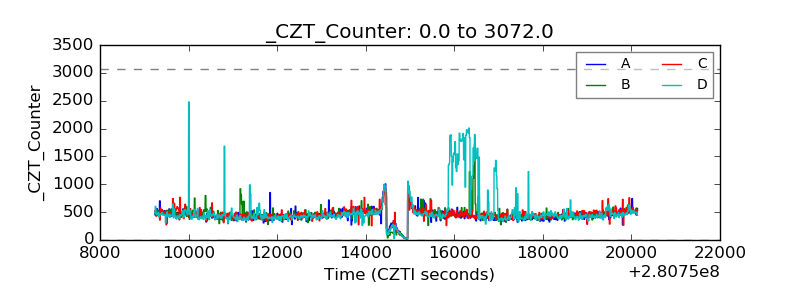 |
| +2.5 Volts monitor |  |
| +5 Volts monitor |  |
| _ROLL_ROT | 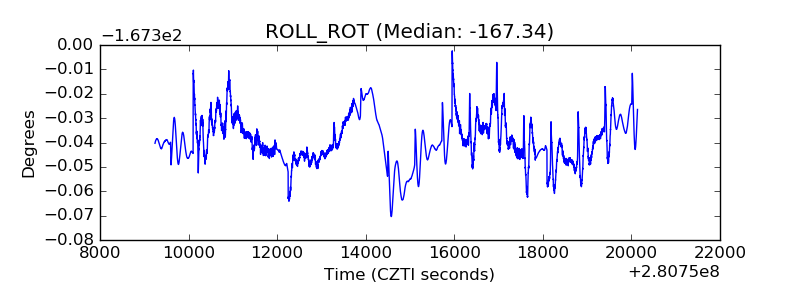 |
| _Roll_DEC | 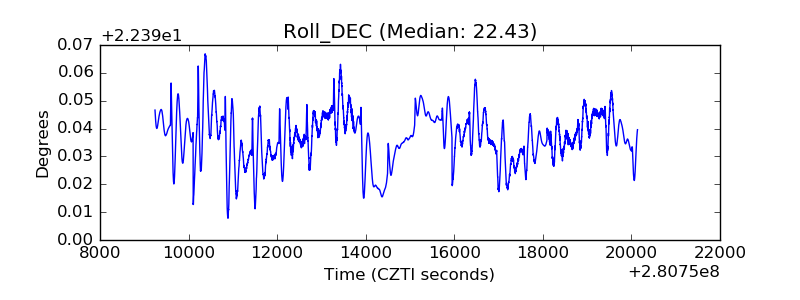 |
| _Roll_RA |  |
| Veto Counter | 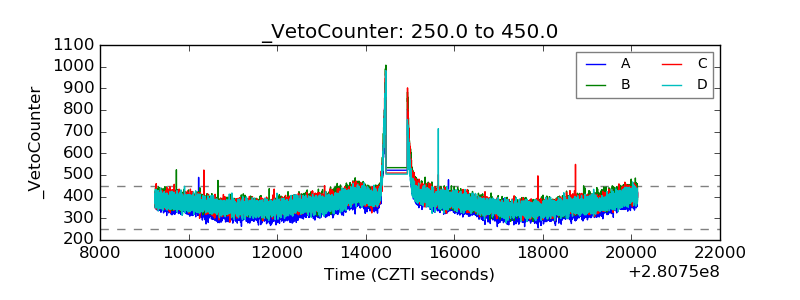 |