| Param | Original file | Final file |
|---|---|---|
| Filename | modeM0/AS1T03_004T01_9000002532_17074cztM0_level2.evt | modeM0/AS1T03_004T01_9000002532_17074cztM0_level2_quad_clean.evt |
| Size (bytes) | 478,488,960 | 90,233,280 |
| Size | 456.3 MB | 86.1 MB |
| Events in quadrant A | 3,323,375 | 569,097 |
| Events in quadrant B | 3,587,960 | 573,595 |
| Events in quadrant C | 3,431,316 | 552,317 |
| Events in quadrant D | 3,665,414 | 542,554 |
| Mode SS | |||
|---|---|---|---|
| Quadrant | BADHDUFLAG | Total packets | Discarded packets |
| A | 0 | 148 | 0 |
| B | 0 | 148 | 0 |
| C | 0 | 148 | 0 |
| D | 0 | 148 | 0 |
| Mode M9 | |||
|---|---|---|---|
| Quadrant | BADHDUFLAG | Total packets | Discarded packets |
| A | 0 | 15 | 0 |
| B | 0 | 15 | 0 |
| C | 0 | 15 | 0 |
| D | 0 | 15 | 0 |
| Mode M0 | |||
|---|---|---|---|
| Quadrant | BADHDUFLAG | Total packets | Discarded packets |
| A | 0 | 14605 | 2 |
| B | 0 | 15139 | 2 |
| C | 0 | 14685 | 2 |
| D | 0 | 15828 | 2 |
| Quadrant | Total seconds | Saturated seconds | Saturation percentage |
|---|---|---|---|
| A | 7100 | 67 | 0.943662% |
| B | 7101 | 74 | 1.042107% |
| C | 7101 | 96 | 1.351922% |
| D | 7101 | 87 | 1.225180% |
Noise dominated data is calculated using 1-second bins in cleaned event files. If a bin has >2000 counts, and if more than 50% of those come from <1% of pixels, then it is considered to be noise-dominated and hence unusable.
| Quadrant | # 1 sec bins | Bins with >0 counts | Bins with >2000 counts | High rate bins dominated by noise | Noise dominated (total time) | Noise dominated (detector-on time) | Marked lightcurve |
|---|---|---|---|---|---|---|---|
| A | 8705 | 7102 | 0 | 0 | 0.00% | 0.00% | 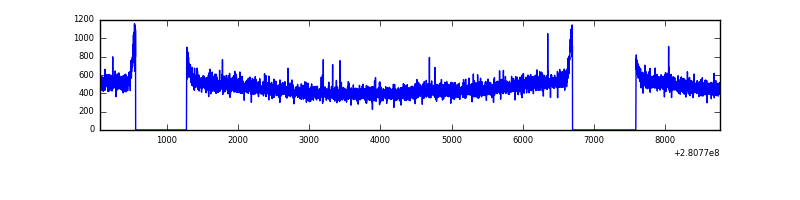 |
| B | 8706 | 7103 | 1 | 1 | 0.01% | 0.01% | 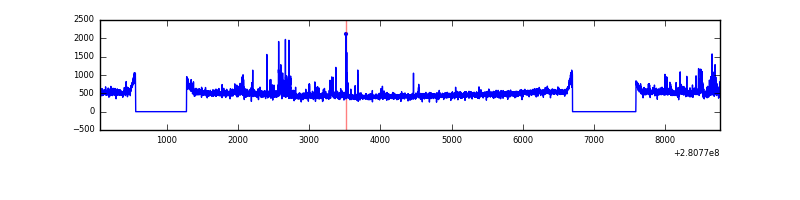 |
| C | 8706 | 7103 | 0 | 0 | 0.00% | 0.00% | 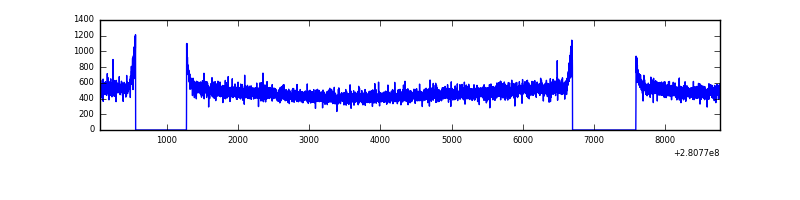 |
| D | 8706 | 7103 | 30 | 30 | 0.34% | 0.42% | 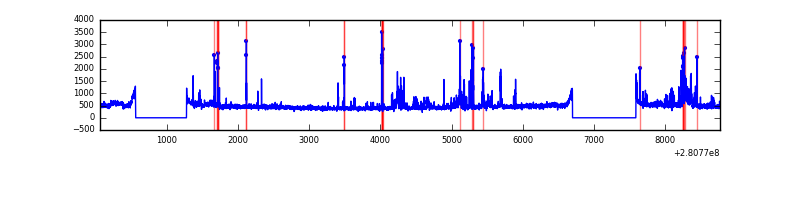 |
Top three noisy pixels from each quadrant. If the there are fewer than three noisy pixels in the level2.evt file, extra rows are filled as -1
| Pixel properties | Quadrant properties | ||||||
|---|---|---|---|---|---|---|---|
| Quadrant | DetID | PixID | Counts | Sigma | Mean | Median | Sigma |
| A | 0 | 226 | 7633 | 38.7 | 864 | 846 | 175.4 |
| A | 3 | 137 | 6407 | 31.71 | 864 | 846 | 175.4 |
| A | 12 | 194 | 6310 | 31.16 | 864 | 846 | 175.4 |
| B | 0 | 197 | 73617 | 434.75 | 862 | 840 | 167.4 |
| B | 6 | 36 | 67626 | 398.96 | 862 | 840 | 167.4 |
| B | 0 | 189 | 27626 | 160.01 | 862 | 840 | 167.4 |
| C | 14 | 238 | 129371 | 664.15 | 826 | 833 | 193.5 |
| C | 3 | 233 | 74397 | 380.1 | 826 | 833 | 193.5 |
| C | 7 | 247 | 6883 | 31.26 | 826 | 833 | 193.5 |
| D | 5 | 222 | 317614 | 1530.32 | 842 | 815 | 207.0 |
| D | 10 | 70 | 70106 | 334.71 | 842 | 815 | 207.0 |
| D | 2 | 152 | 41315 | 195.64 | 842 | 815 | 207.0 |
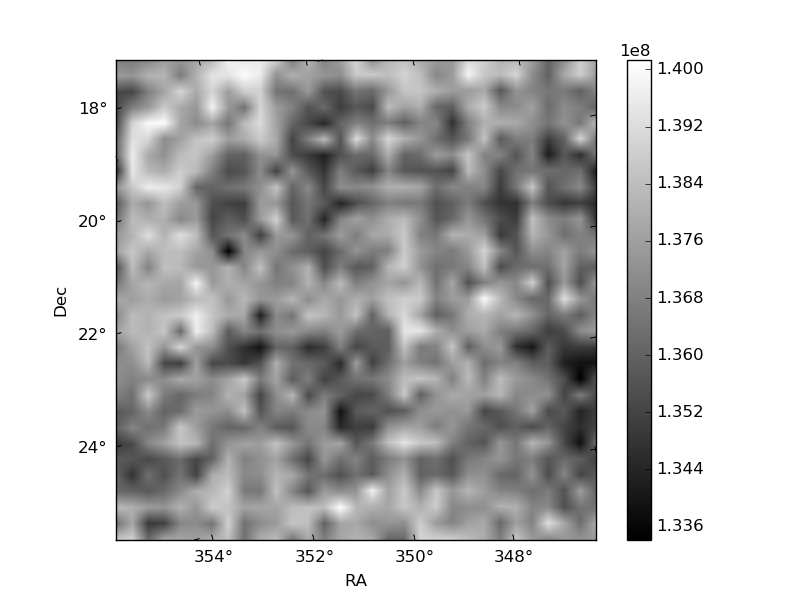
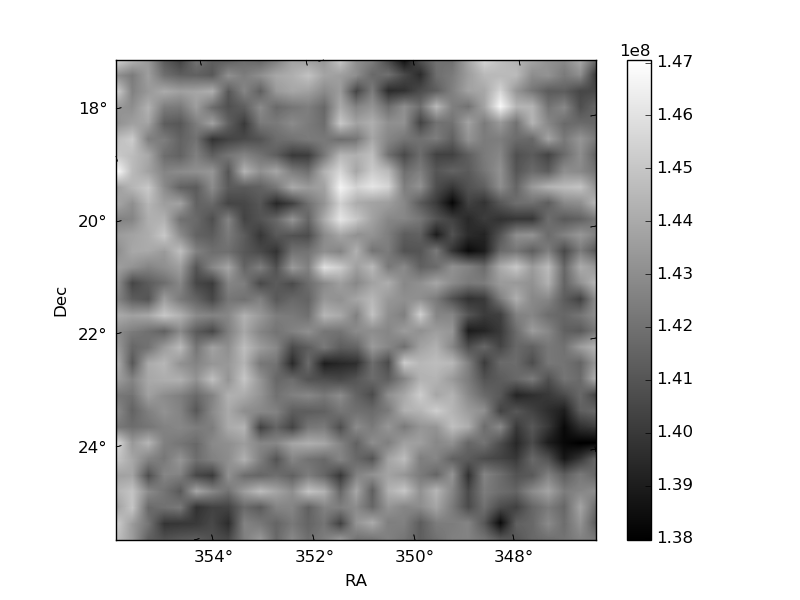
Histogram calculated using DETX and DETY for each event in the final _common_clean file
| Quadrant A | 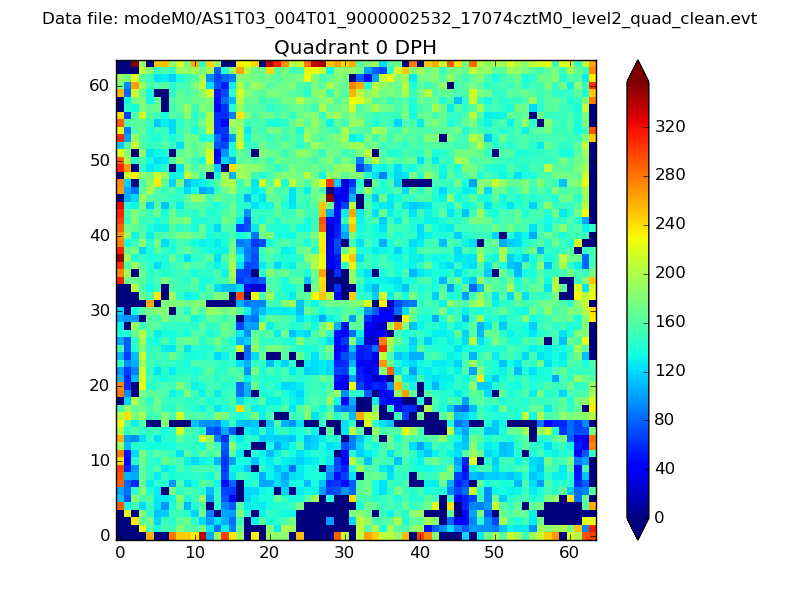 |
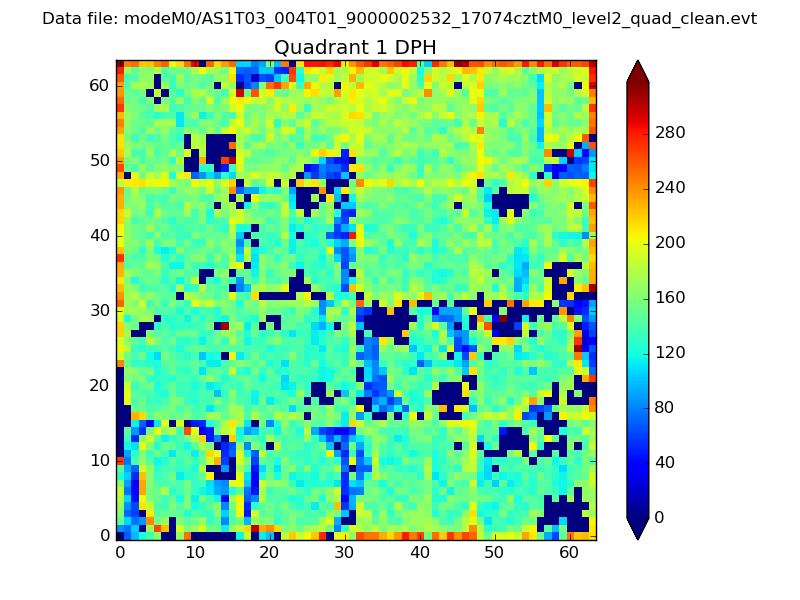 |
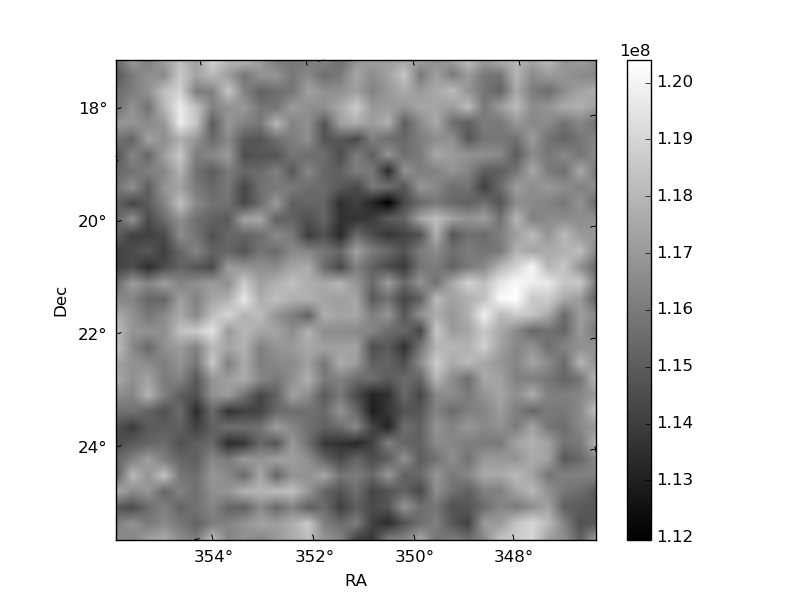
Quadrant B |
|---|---|---|---|
| Quadrant D | 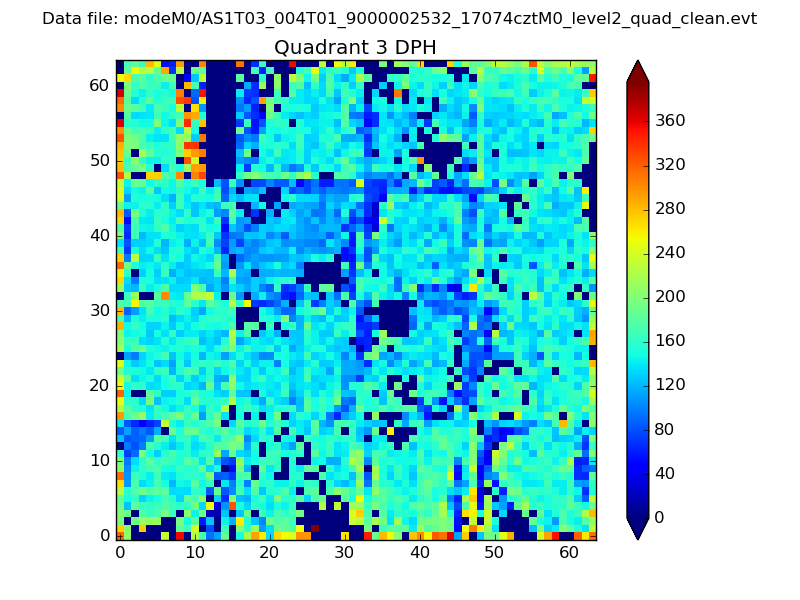 |
 |
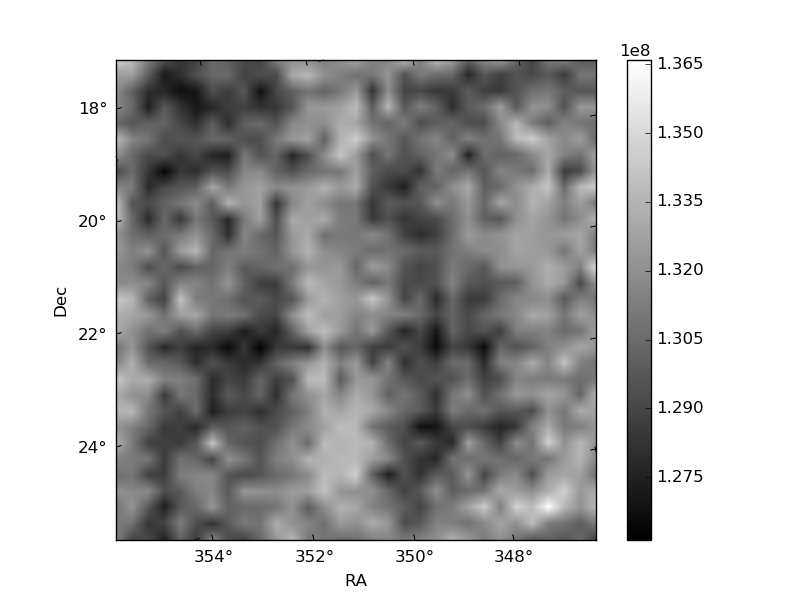
Quadrant C |
| Plot type | Count rate plots | Images |
|---|---|---|
| Comparison with Poisson distribution Blue bars denote a histogram of data divided into 1 sec bins. Red curve is a Poisson curve with rate = median count rate of data. |
 |
 |
| Quadrant-wise count rates Data is divided into 100 sec bins |
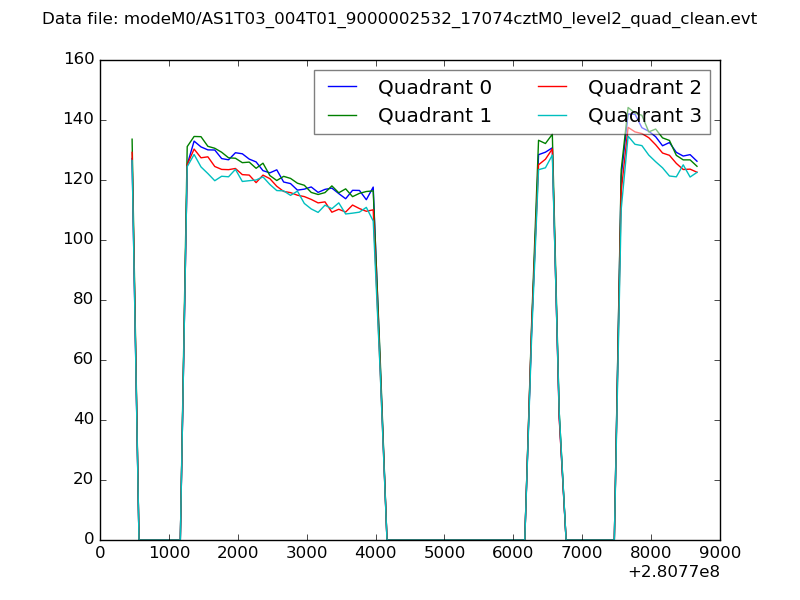 |
|
| Module-wise count rates for Quadrant A Data is divided into 100 sec bins |
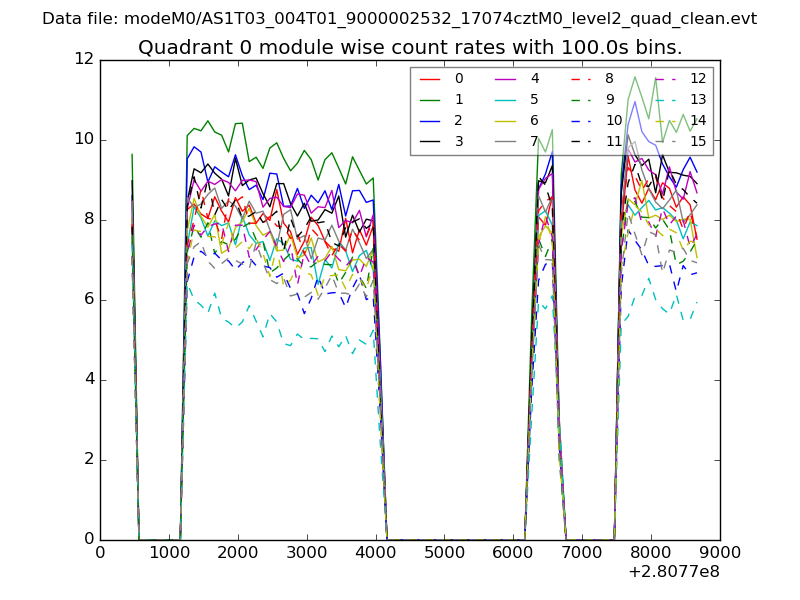 |
 |
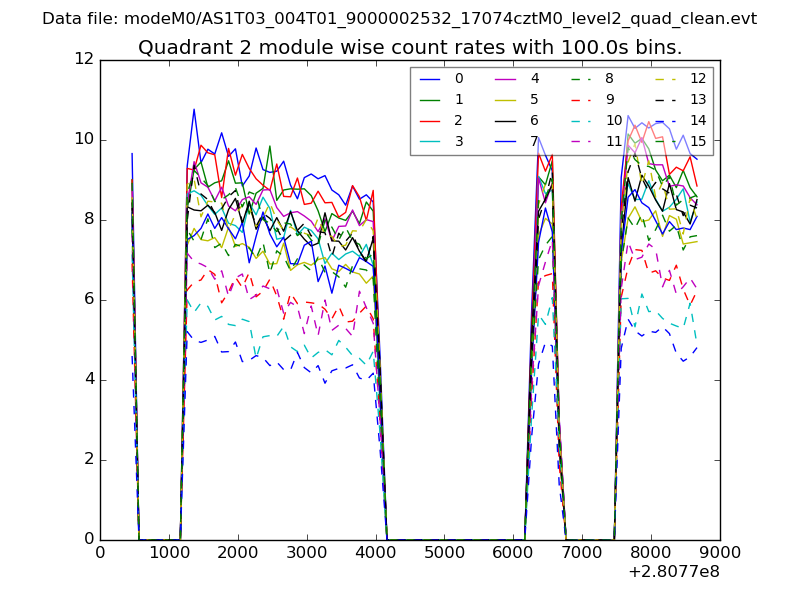
| Module-wise count rates for Quadrant B Data is divided into 100 sec bins |
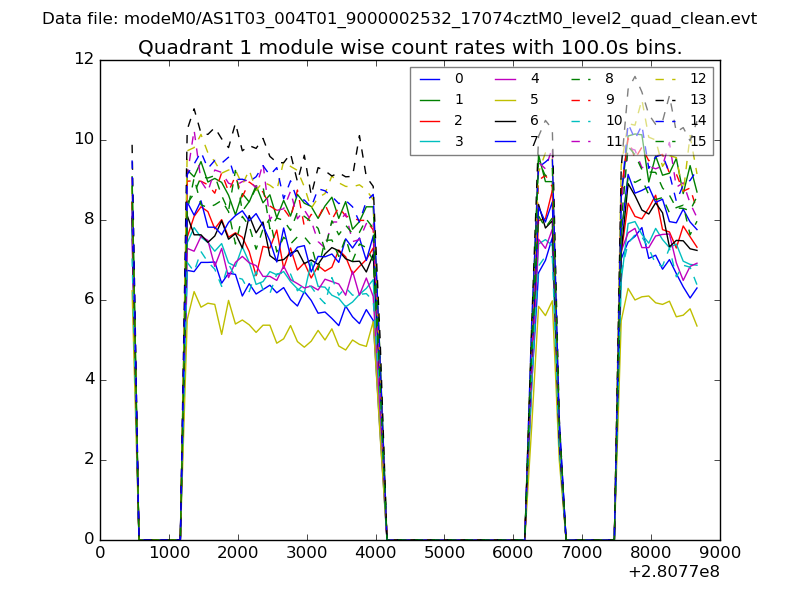 |
 |
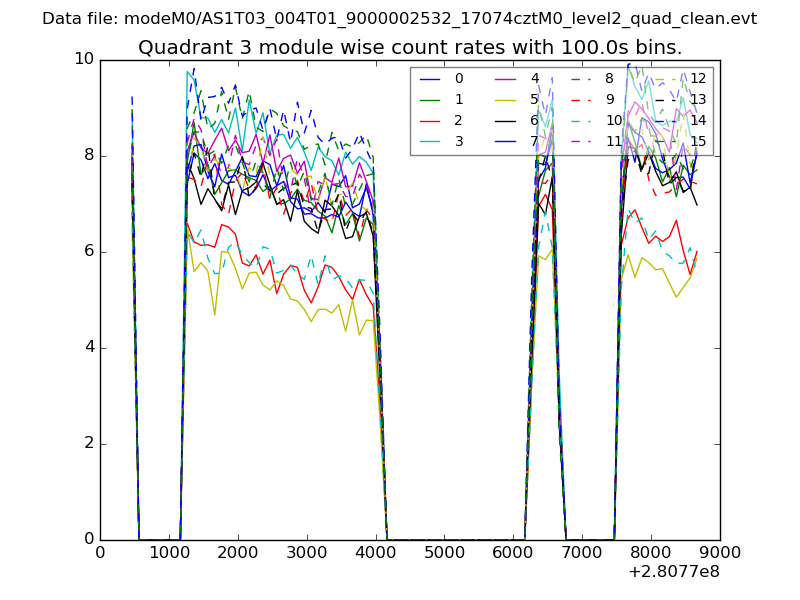
| Module-wise count rates for Quadrant C Data is divided into 100 sec bins |
 |
 |
| Module-wise count rates for Quadrant D Data is divided into 100 sec bins |
 |
 |
| Parameter | Plot |
|---|---|
| CZT HV Monitor | 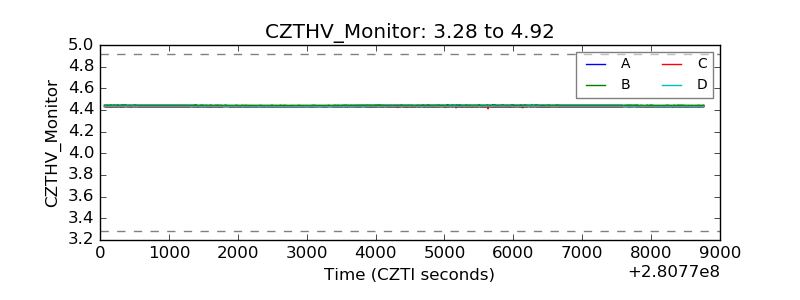 |
| D_VDD |  |
| Temperature 1 | 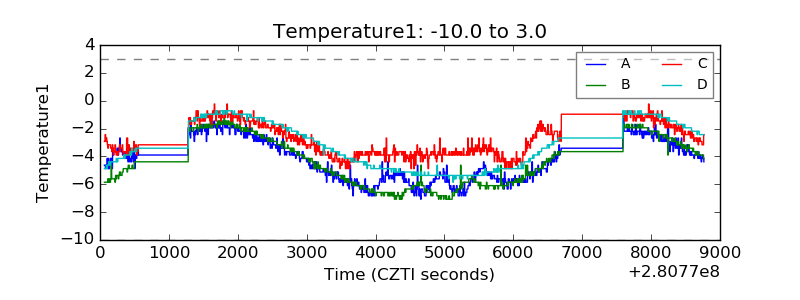 |
| Veto HV Monitor |  |
| Veto LLD | 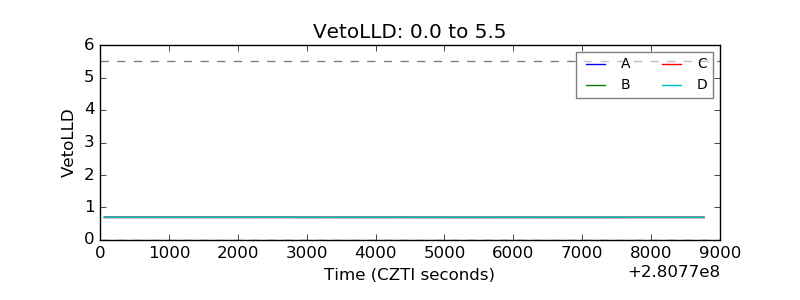 |
| Alpha Counter | 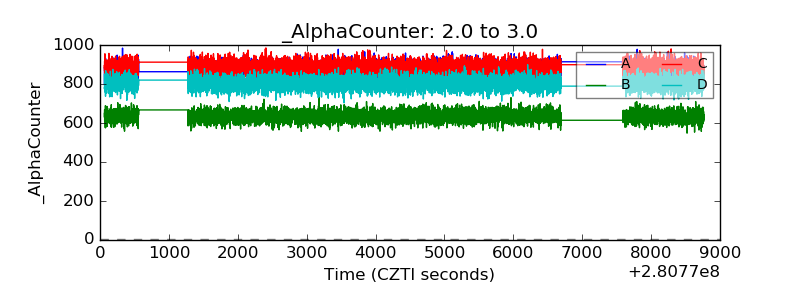 |
| _CPM_Rate | 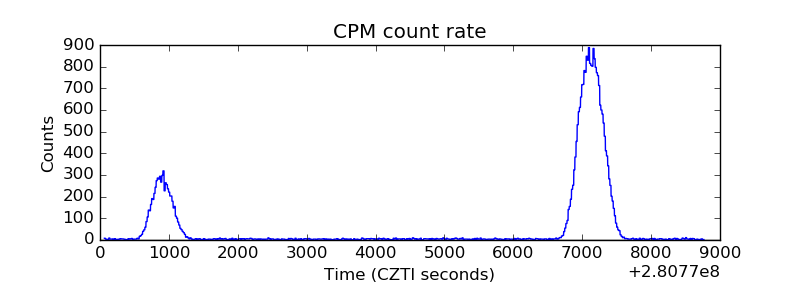 |
| CZT Counter |  |
| +2.5 Volts monitor |  |
| +5 Volts monitor |  |
| _ROLL_ROT | 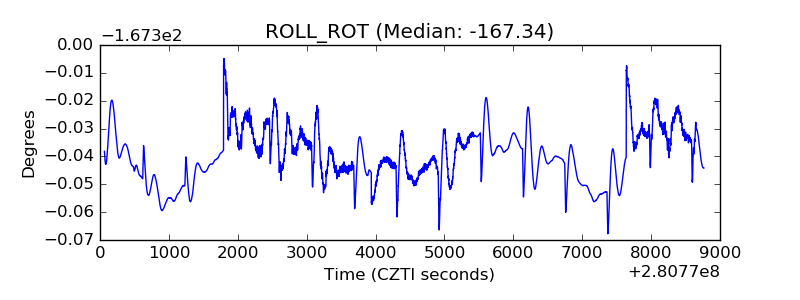 |
| _Roll_DEC | 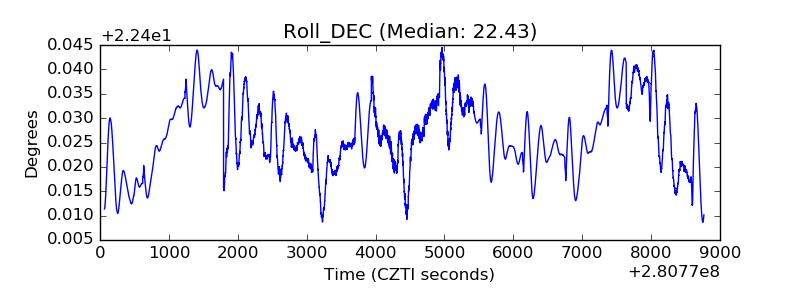 |
| _Roll_RA |  |
| Veto Counter | 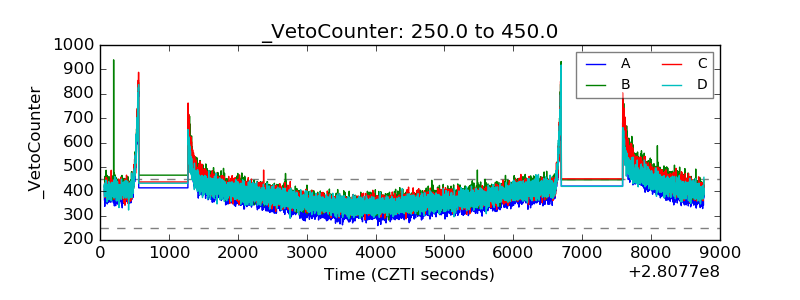 |