| Param | Original file | Final file |
|---|---|---|
| Filename | modeM0/AS1T03_004T01_9000002532_17075cztM0_level2.evt | modeM0/AS1T03_004T01_9000002532_17075cztM0_level2_quad_clean.evt |
| Size (bytes) | 87,848,640 | 23,555,520 |
| Size | 83.8 MB | 22.5 MB |
| Events in quadrant A | 586,475 | 159,249 |
| Events in quadrant B | 670,649 | 159,993 |
| Events in quadrant C | 600,349 | 154,264 |
| Events in quadrant D | 719,591 | 149,915 |
| Mode SS | |||
|---|---|---|---|
| Quadrant | BADHDUFLAG | Total packets | Discarded packets |
| A | 0 | 24 | 0 |
| B | 0 | 24 | 0 |
| C | 0 | 24 | 0 |
| D | 0 | 24 | 0 |
| Mode M9 | |||
|---|---|---|---|
| Quadrant | BADHDUFLAG | Total packets | Discarded packets |
| A | 0 | 1 | 0 |
| B | 0 | 2 | 0 |
| C | 0 | 2 | 0 |
| D | 0 | 2 | 0 |
| Mode M0 | |||
|---|---|---|---|
| Quadrant | BADHDUFLAG | Total packets | Discarded packets |
| A | 0 | 2456 | 1 |
| B | 0 | 2678 | 1 |
| C | 0 | 2466 | 1 |
| D | 0 | 2878 | 1 |
| Quadrant | Total seconds | Saturated seconds | Saturation percentage |
|---|---|---|---|
| A | 1181 | 2 | 0.169348% |
| B | 1181 | 3 | 0.254022% |
| C | 1181 | 11 | 0.931414% |
| D | 1181 | 13 | 1.100762% |
Noise dominated data is calculated using 1-second bins in cleaned event files. If a bin has >2000 counts, and if more than 50% of those come from <1% of pixels, then it is considered to be noise-dominated and hence unusable.
| Quadrant | # 1 sec bins | Bins with >0 counts | Bins with >2000 counts | High rate bins dominated by noise | Noise dominated (total time) | Noise dominated (detector-on time) | Marked lightcurve |
|---|---|---|---|---|---|---|---|
| A | 1181 | 1181 | 0 | 0 | 0.00% | 0.00% | 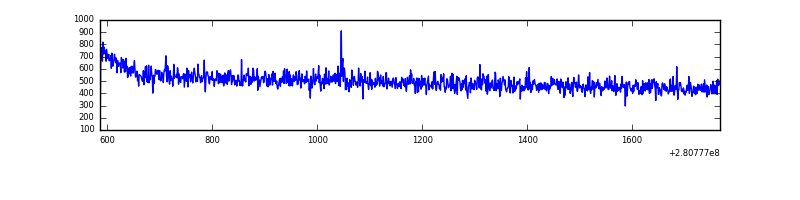 |
| B | 1181 | 1181 | 0 | 0 | 0.00% | 0.00% | 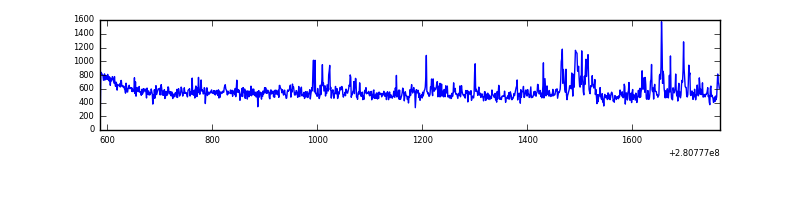 |
| C | 1181 | 1181 | 0 | 0 | 0.00% | 0.00% | 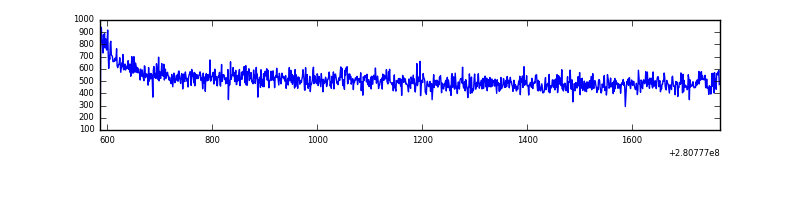 |
| D | 1181 | 1181 | 8 | 8 | 0.68% | 0.68% | 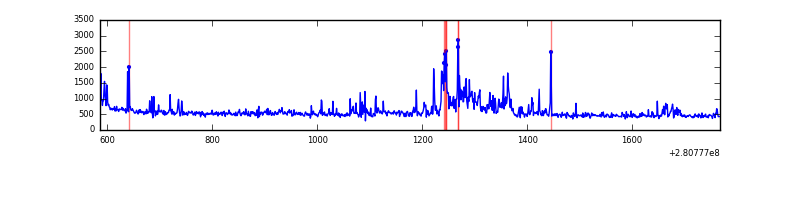 |
Top three noisy pixels from each quadrant. If the there are fewer than three noisy pixels in the level2.evt file, extra rows are filled as -1
| Pixel properties | Quadrant properties | ||||||
|---|---|---|---|---|---|---|---|
| Quadrant | DetID | PixID | Counts | Sigma | Mean | Median | Sigma |
| A | 4 | 2 | 2055 | 58.57 | 152 | 148 | 32.6 |
| A | 0 | 226 | 1353 | 37.01 | 152 | 148 | 32.6 |
| A | 12 | 194 | 1139 | 30.44 | 152 | 148 | 32.6 |
| B | 6 | 36 | 64746 | 2107.55 | 150 | 146 | 30.7 |
| B | 0 | 197 | 10180 | 327.36 | 150 | 146 | 30.7 |
| B | 12 | 111 | 3182 | 99.05 | 150 | 146 | 30.7 |
| C | 14 | 238 | 22577 | 640.15 | 143 | 143 | 35.0 |
| C | 3 | 233 | 16024 | 453.16 | 143 | 143 | 35.0 |
| C | 7 | 247 | 2200 | 58.7 | 143 | 143 | 35.0 |
| D | 5 | 222 | 136894 | 3607.34 | 148 | 142 | 37.9 |
| D | 10 | 70 | 7313 | 189.16 | 148 | 142 | 37.9 |
| D | 2 | 234 | 5027 | 128.86 | 148 | 142 | 37.9 |
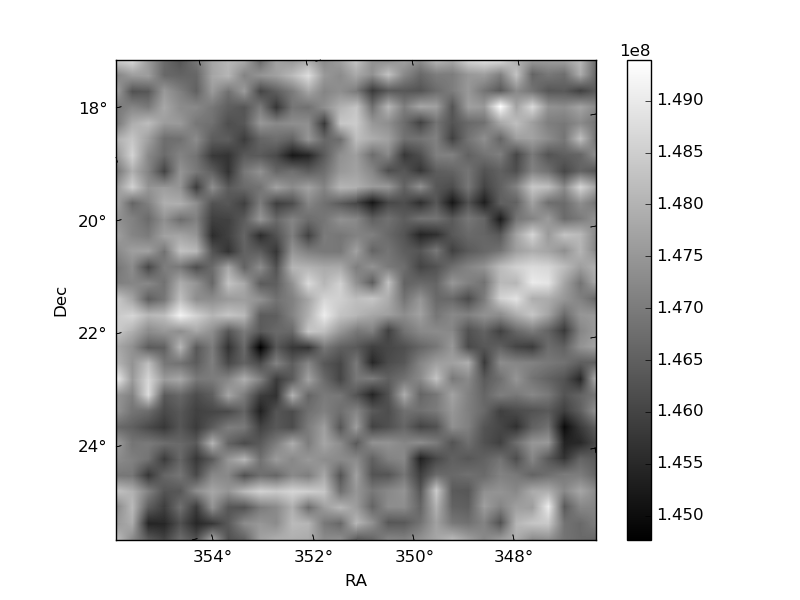
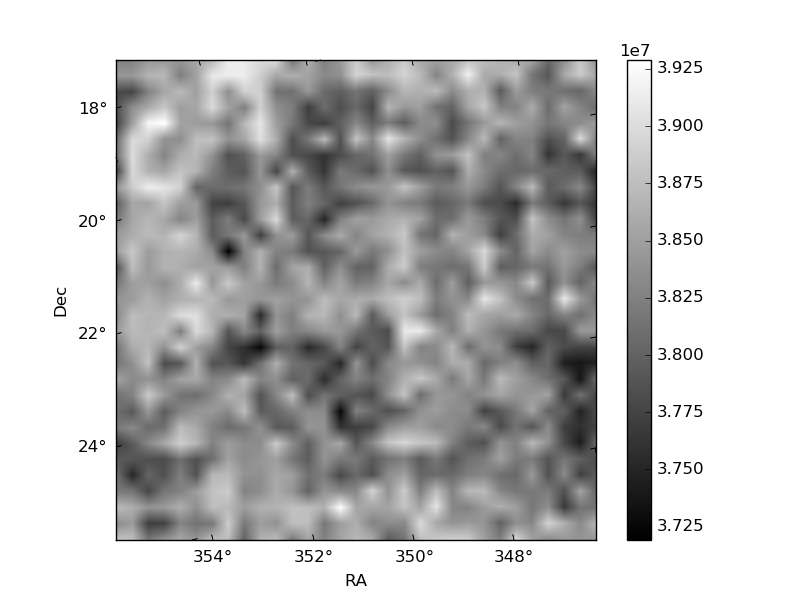
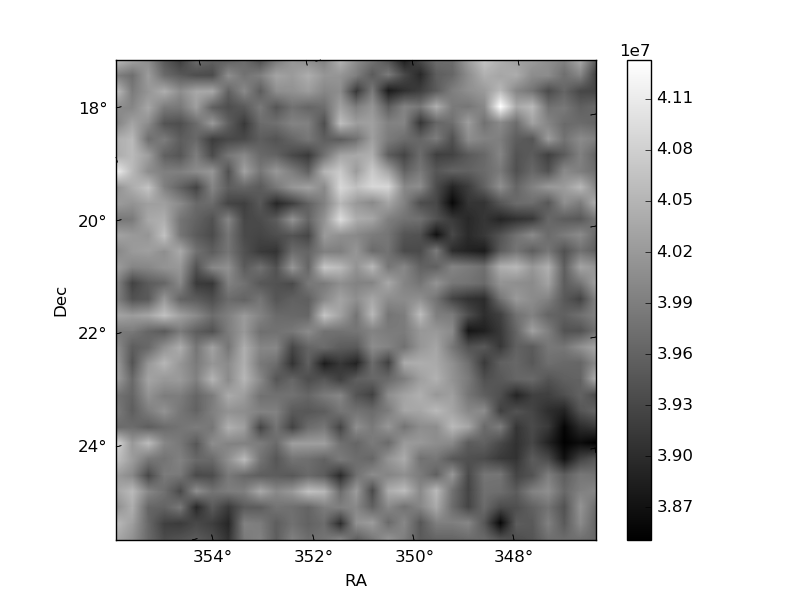
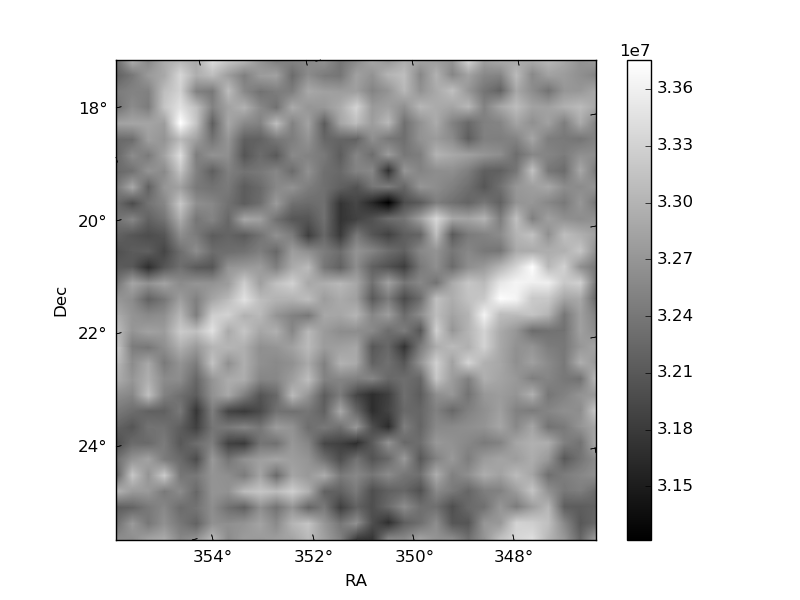
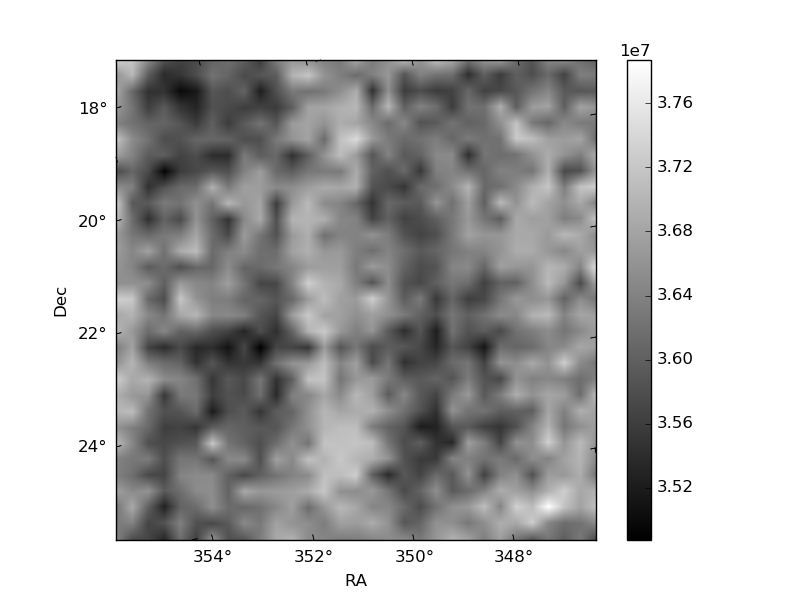
Histogram calculated using DETX and DETY for each event in the final _common_clean file
| Quadrant A | 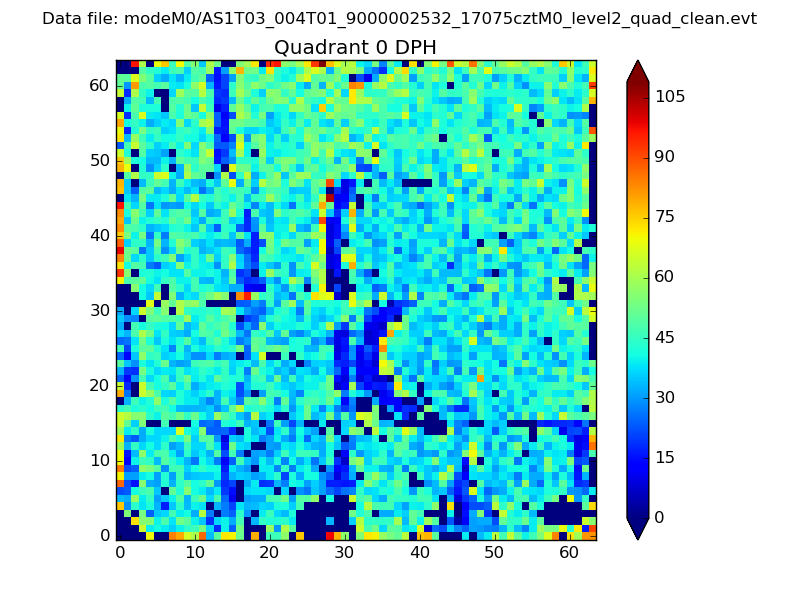 |
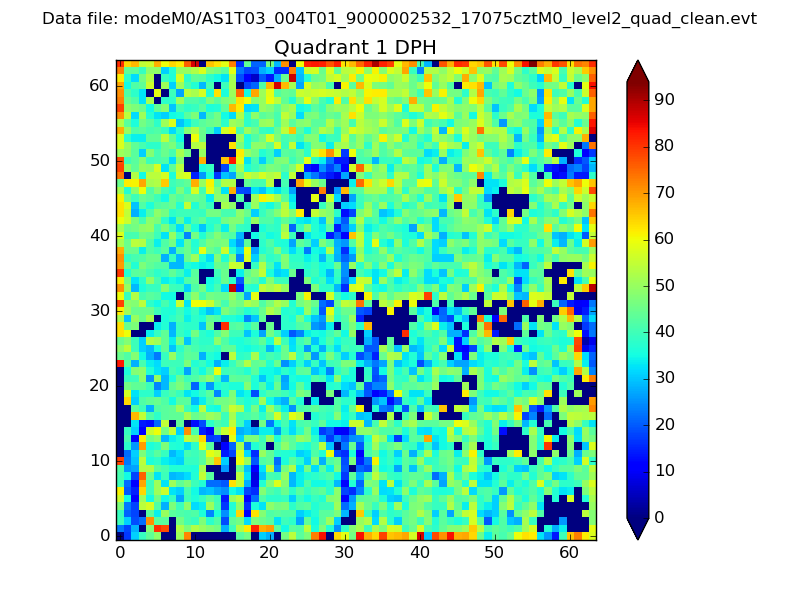 |
Quadrant B |
|---|---|---|---|
| Quadrant D | 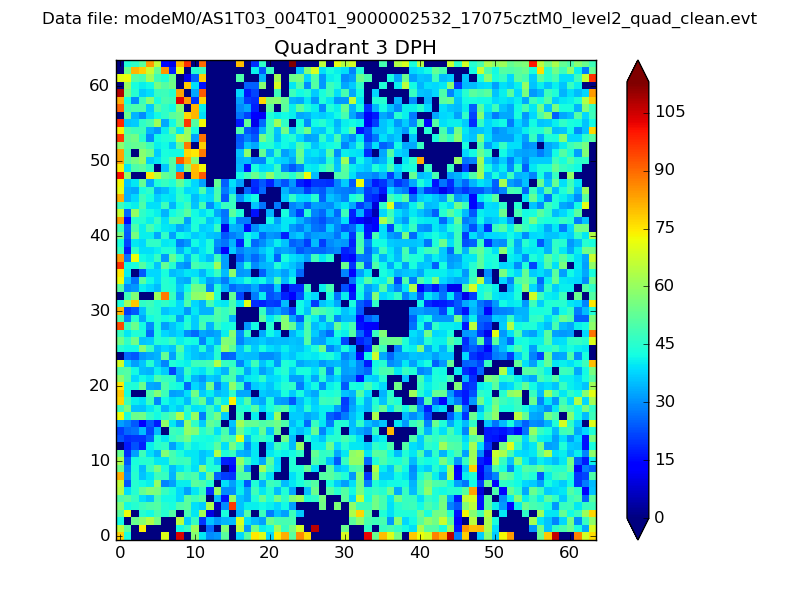 |
 |
Quadrant C |
| Plot type | Count rate plots | Images |
|---|---|---|
| Comparison with Poisson distribution Blue bars denote a histogram of data divided into 1 sec bins. Red curve is a Poisson curve with rate = median count rate of data. |
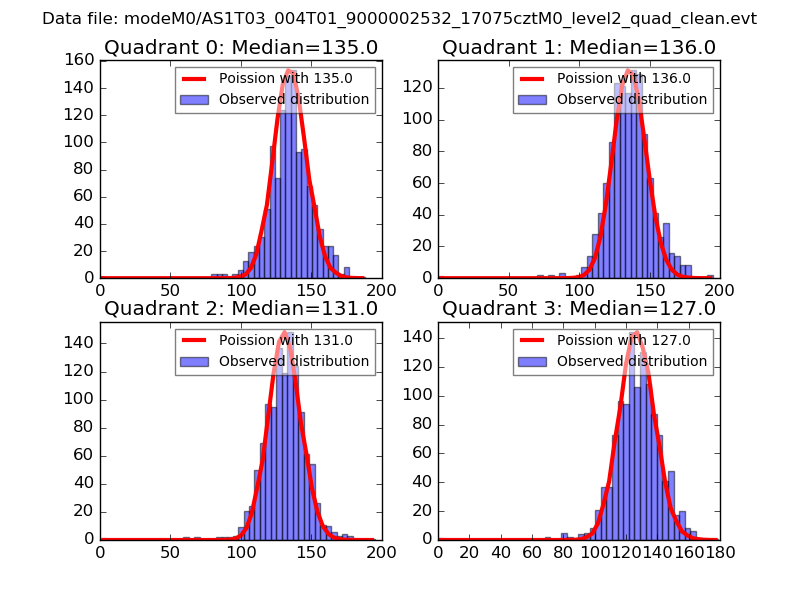 |
 |
| Quadrant-wise count rates Data is divided into 100 sec bins |
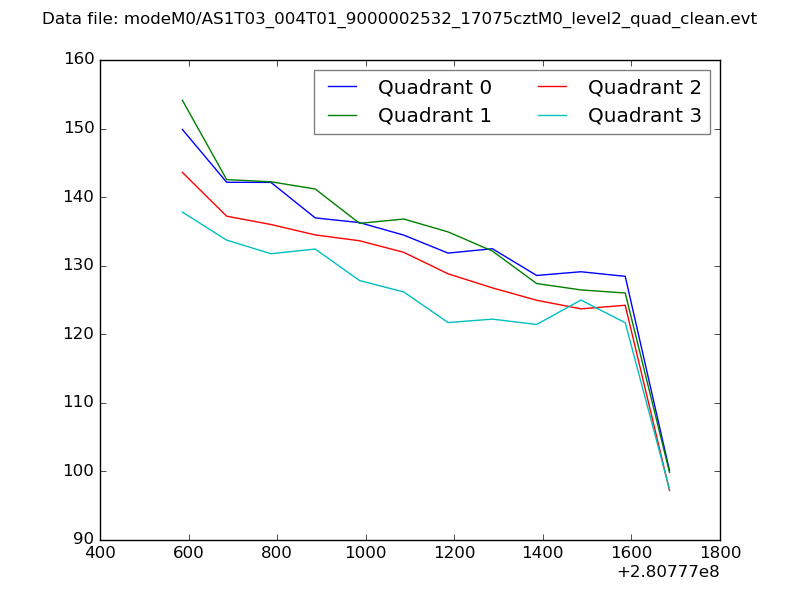 |
|
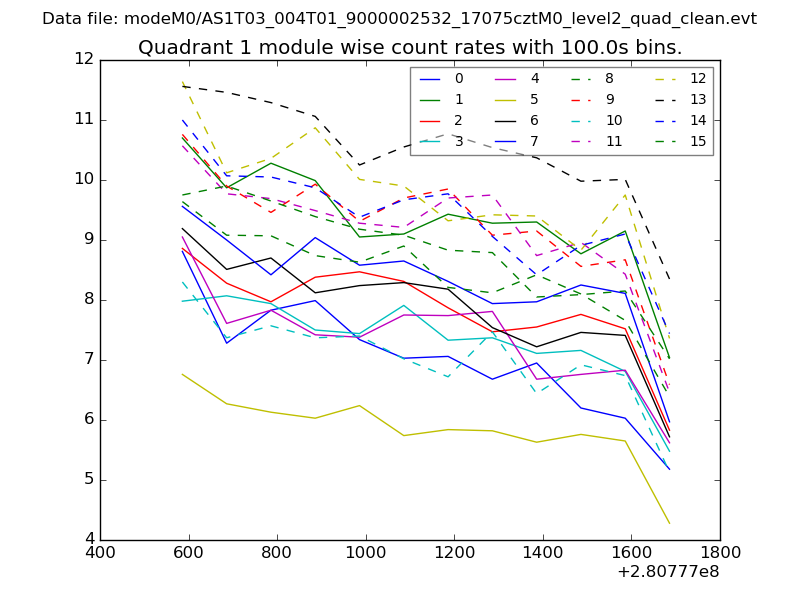
| Module-wise count rates for Quadrant A Data is divided into 100 sec bins |
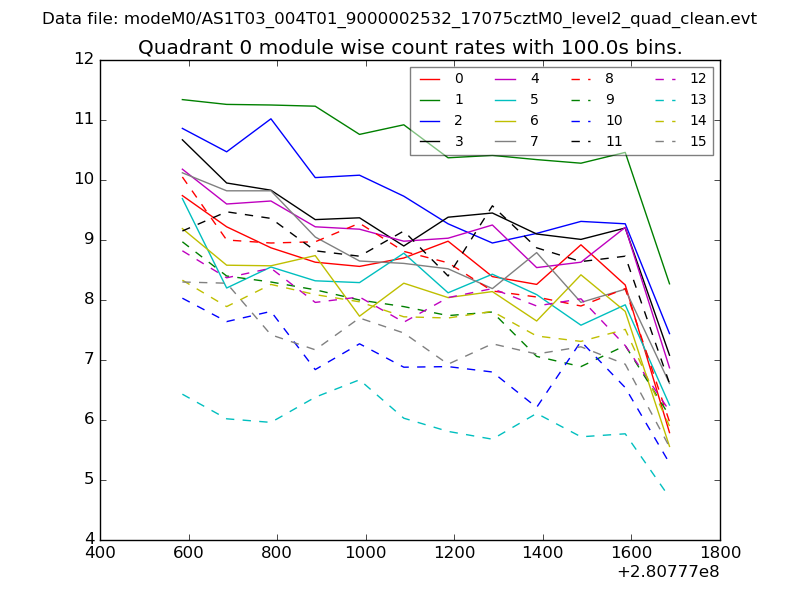 |
 |
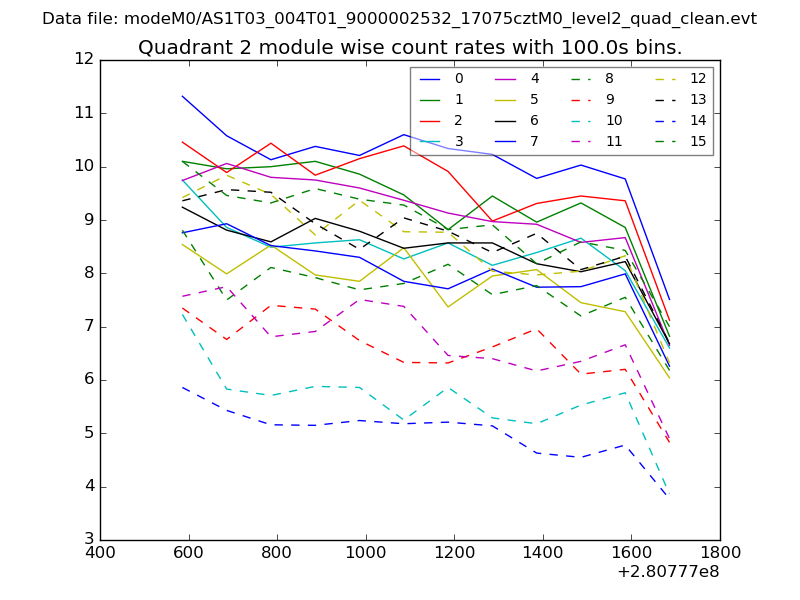
| Module-wise count rates for Quadrant B Data is divided into 100 sec bins |
 |
 |
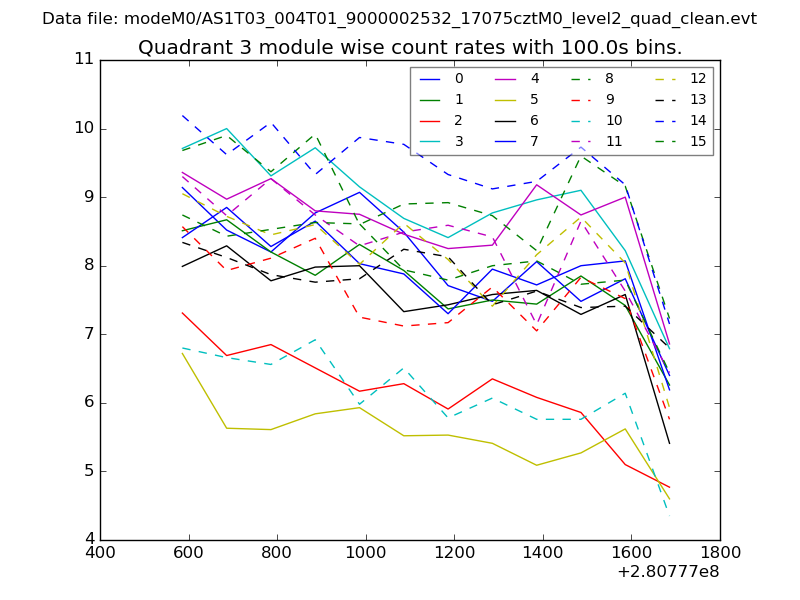
| Module-wise count rates for Quadrant C Data is divided into 100 sec bins |
 |
 |
| Module-wise count rates for Quadrant D Data is divided into 100 sec bins |
 |
 |
| Parameter | Plot |
|---|---|
| CZT HV Monitor | 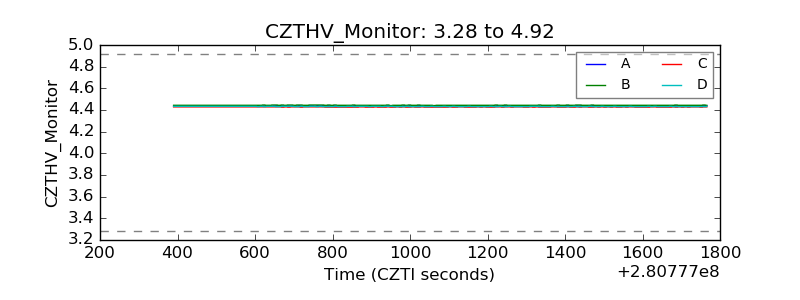 |
| D_VDD | 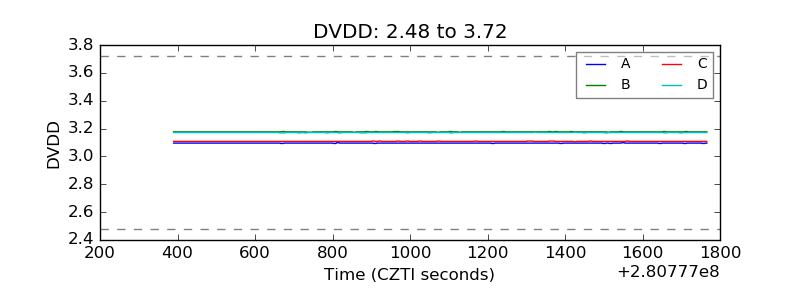 |
| Temperature 1 | 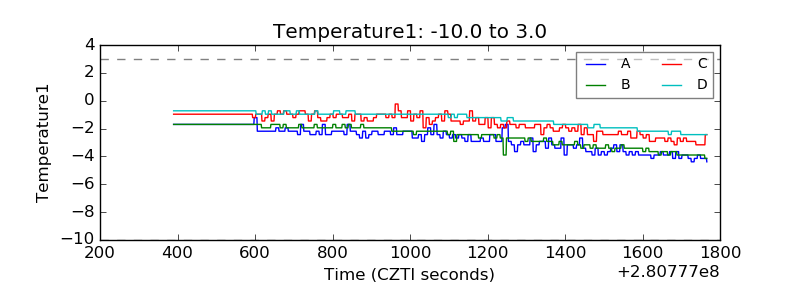 |
| Veto HV Monitor |  |
| Veto LLD | 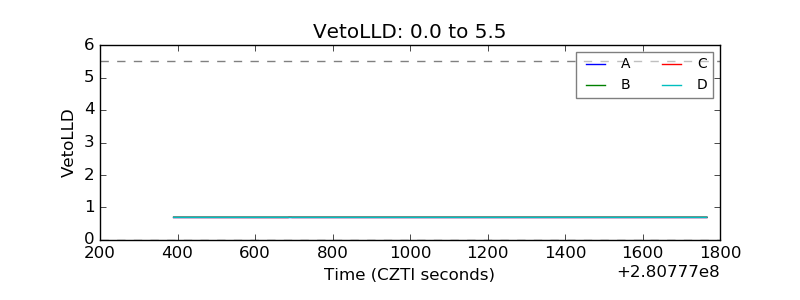 |
| Alpha Counter | 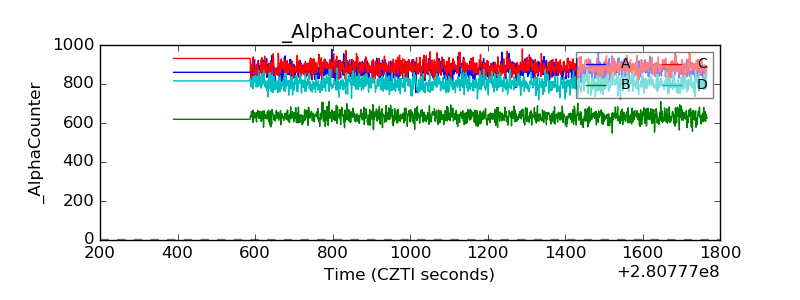 |
| _CPM_Rate | 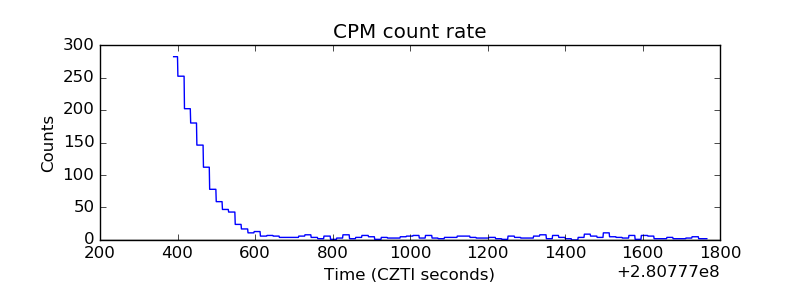 |
| CZT Counter | 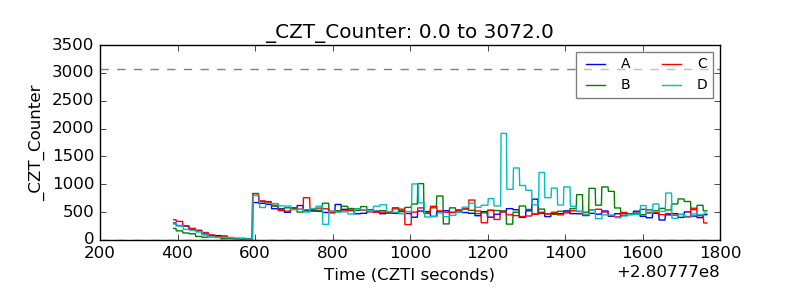 |
| +2.5 Volts monitor | 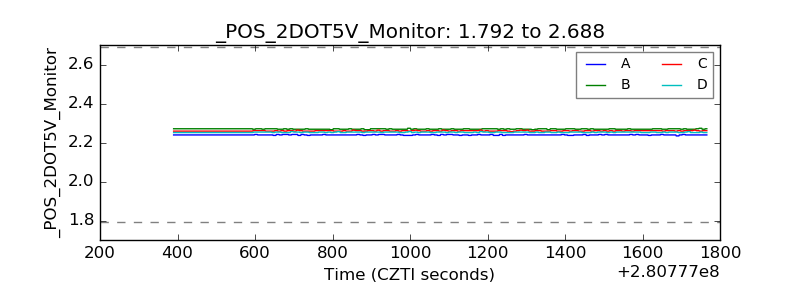 |
| +5 Volts monitor |  |
| _ROLL_ROT | 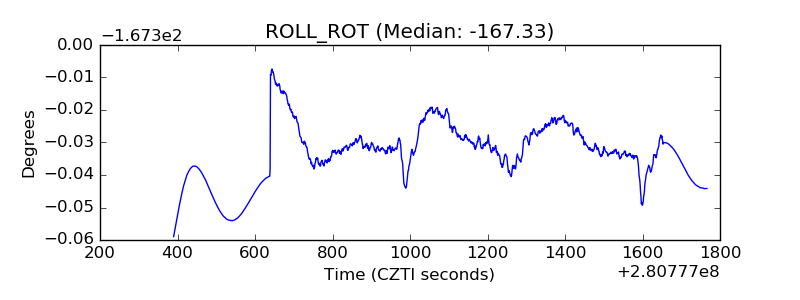 |
| _Roll_DEC | 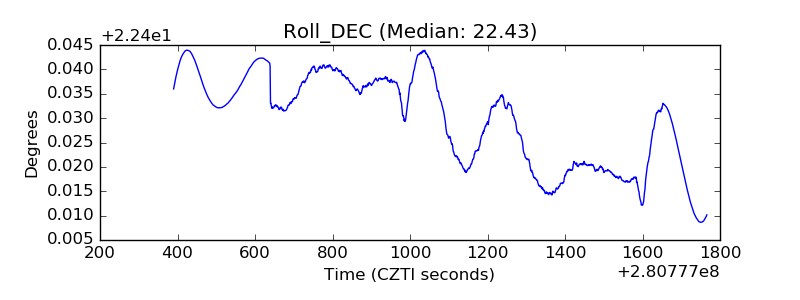 |
| _Roll_RA | 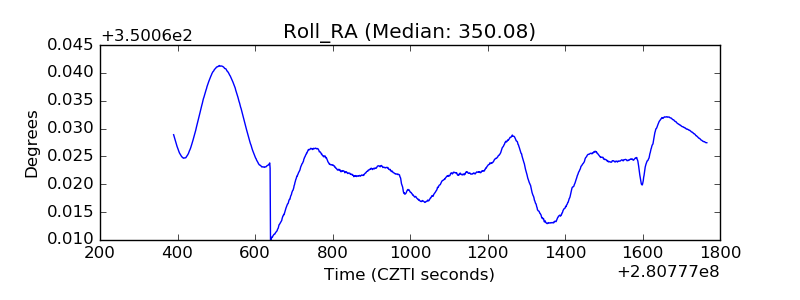 |
| Veto Counter | 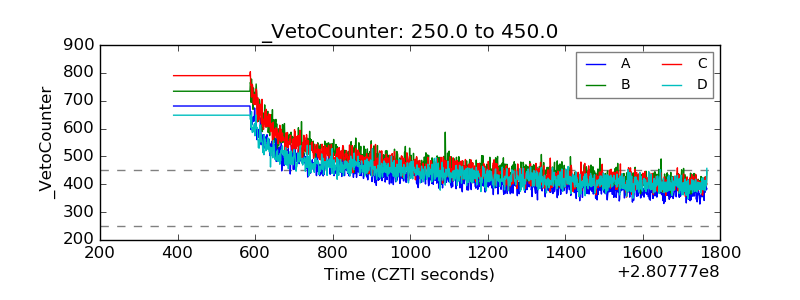 |