| Param | Original file | Final file |
|---|---|---|
| Filename | modeM0/AS1A05_004T04_9000002534cztM0_level2.fits | modeM0/AS1A05_004T04_9000002534cztM0_level2_quad_clean.evt |
| Size (bytes) | 682,214,400 | 594,581,760 |
| Size | 650.6 MB | 567.0 MB |
| Events in quadrant A | 4,184,268 | 3,442,073 |
| Events in quadrant B | 4,029,880 | 3,443,936 |
| Events in quadrant C | 4,034,368 | 3,236,674 |
| Events in quadrant D | 3,522,996 | 2,994,552 |
| Mode M0 | |||
|---|---|---|---|
| Quadrant | BADHDUFLAG | Total packets | Discarded packets |
| A | 0 | 146524 | 0 |
| B | 0 | 152067 | 0 |
| C | 0 | 171569 | 0 |
| D | 0 | 160877 | 0 |
| Mode SS | |||
|---|---|---|---|
| Quadrant | BADHDUFLAG | Total packets | Discarded packets |
| A | 0 | 1454 | 0 |
| B | 0 | 1454 | 0 |
| C | 0 | 1454 | 0 |
| D | 0 | 1454 | 0 |
| Mode M9 | |||
|---|---|---|---|
| Quadrant | BADHDUFLAG | Total packets | Discarded packets |
| A | 0 | 110 | 0 |
| B | 0 | 110 | 0 |
| C | 0 | 110 | 0 |
| D | 0 | 110 | 0 |
| Quadrant | Total seconds | Saturated seconds | Saturation percentage |
|---|---|---|---|
| A | 71286 | 943 | 1.322840% |
| B | 71286 | 1129 | 1.583761% |
| C | 71286 | 1459 | 2.046685% |
| D | 71286 | 1725 | 2.419830% |
Noise dominated data is calculated using 1-second bins in cleaned event files. If a bin has >2000 counts, and if more than 50% of those come from <1% of pixels, then it is considered to be noise-dominated and hence unusable.
| Quadrant | # 1 sec bins | Bins with >0 counts | Bins with >2000 counts | High rate bins dominated by noise | Noise dominated (total time) | Noise dominated (detector-on time) | Marked lightcurve |
|---|---|---|---|---|---|---|---|
| A | 82331 | 71282 | 0 | 0 | 0.00% | 0.00% |  |
| B | 82331 | 71280 | 0 | 0 | 0.00% | 0.00% | 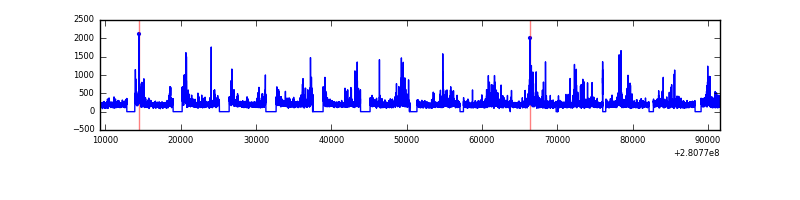 |
| C | 82331 | 71283 | 0 | 0 | 0.00% | 0.00% |  |
| D | 82331 | 71271 | 0 | 0 | 0.00% | 0.00% |  |
Top three noisy pixels from each quadrant. If the there are fewer than three noisy pixels in the level2.evt file, extra rows are filled as -1
| Pixel properties | Quadrant properties | ||||||
|---|---|---|---|---|---|---|---|
| Quadrant | DetID | PixID | Counts | Sigma | Mean | Median | Sigma |
| A | 0 | 29 | 4015 | 11.1 | 1088 | 1020 | 269.8 |
| A | 7 | 110 | 3344 | 8.61 | 1088 | 1020 | 269.8 |
| A | 0 | 30 | 3207 | 8.11 | 1088 | 1020 | 269.8 |
| B | 2 | 9 | 3245 | 10.69 | 1066 | 1018 | 208.2 |
| B | 2 | 8 | 2770 | 8.41 | 1066 | 1018 | 208.2 |
| B | 3 | 17 | 2695 | 8.05 | 1066 | 1018 | 208.2 |
| C | 2 | 191 | 2702 | 6.24 | 1067 | 997 | 273.1 |
| C | 3 | 126 | 2662 | 6.1 | 1067 | 997 | 273.1 |
| C | 9 | 242 | 2642 | 6.02 | 1067 | 997 | 273.1 |
| D | 3 | 14 | 2649 | 6.54 | 1003 | 912 | 265.8 |
| D | 6 | 231 | 2541 | 6.13 | 1003 | 912 | 265.8 |
| D | 10 | 189 | 2432 | 5.72 | 1003 | 912 | 265.8 |
Histogram calculated using DETX and DETY for each event in the final _common_clean file
| Quadrant A | 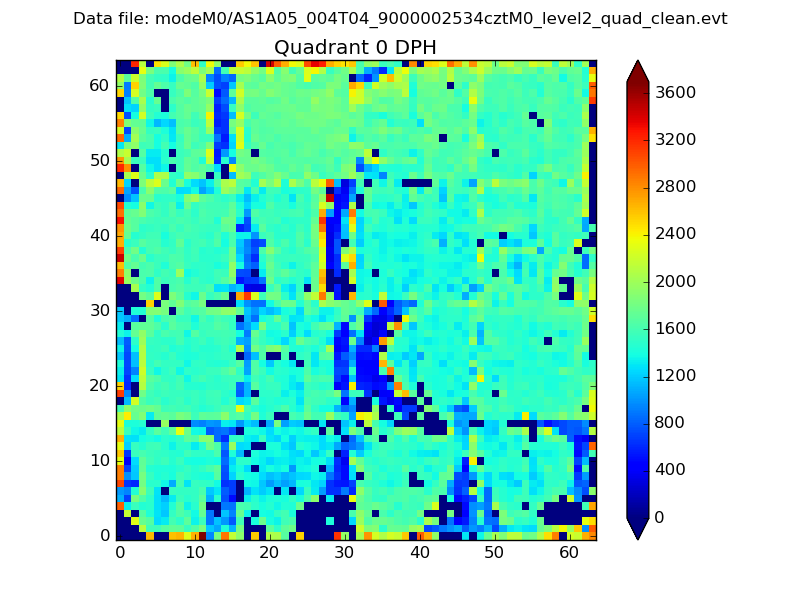 |
 |
Quadrant B |
|---|---|---|---|
| Quadrant D |  |
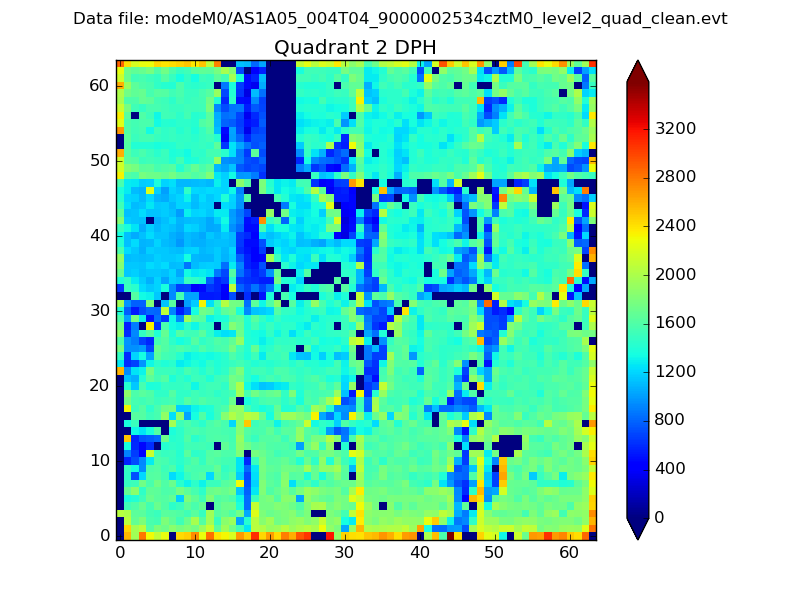 |
Quadrant C |
| Plot type | Count rate plots | Images |
|---|---|---|
| Comparison with Poisson distribution Blue bars denote a histogram of data divided into 1 sec bins. Red curve is a Poisson curve with rate = median count rate of data. |
 |
 |
| Quadrant-wise count rates Data is divided into 100 sec bins |
 |
|
| Module-wise count rates for Quadrant A Data is divided into 100 sec bins |
 |
 |
| Module-wise count rates for Quadrant B Data is divided into 100 sec bins |
 |
 |
| Module-wise count rates for Quadrant C Data is divided into 100 sec bins |
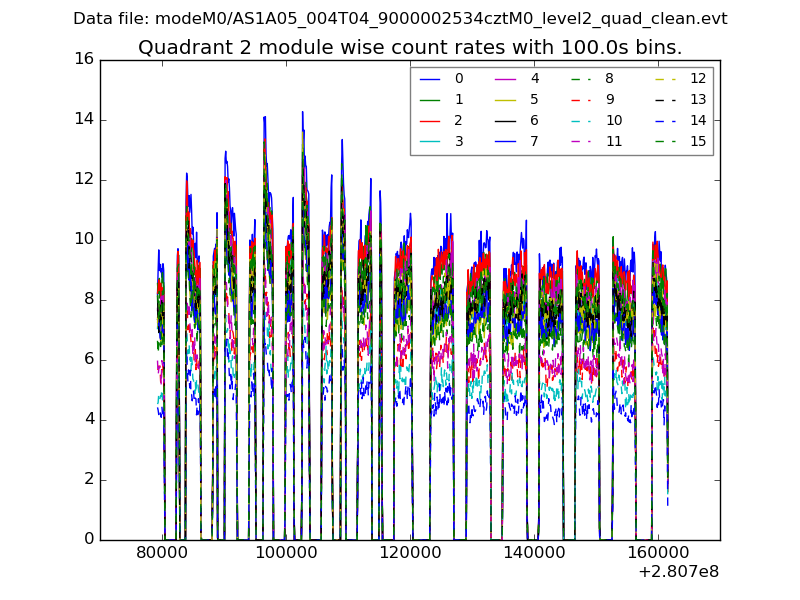 |
 |
| Module-wise count rates for Quadrant D Data is divided into 100 sec bins |
 |
 |
| Parameter | Plot |
|---|---|
| CZT HV Monitor |  |
| D_VDD |  |
| Temperature 1 |  |
| Veto HV Monitor |  |
| Veto LLD |  |
| Alpha Counter |  |
| _CPM_Rate |  |
| CZT Counter |  |
| +2.5 Volts monitor |  |
| +5 Volts monitor |  |
| _ROLL_ROT | 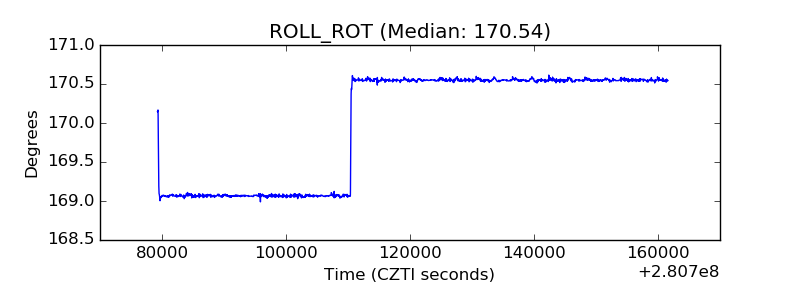 |
| _Roll_DEC |  |
| _Roll_RA |  |
| Veto Counter |  |