| Param | Original file | Final file |
|---|---|---|
| Filename | modeM0/AS1A05_004T04_9000002534_17075cztM0_level2.evt | modeM0/AS1A05_004T04_9000002534_17075cztM0_level2_quad_clean.evt |
| Size (bytes) | 343,506,240 | 59,520,960 |
| Size | 327.6 MB | 56.8 MB |
| Events in quadrant A | 2,181,156 | 375,205 |
| Events in quadrant B | 2,327,921 | 378,585 |
| Events in quadrant C | 2,283,569 | 362,783 |
| Events in quadrant D | 3,282,036 | 347,245 |
| Mode M0 | |||
|---|---|---|---|
| Quadrant | BADHDUFLAG | Total packets | Discarded packets |
| A | 0 | 9873 | 1 |
| B | 0 | 10254 | 1 |
| C | 0 | 9962 | 1 |
| D | 0 | 13412 | 1 |
| Mode SS | |||
|---|---|---|---|
| Quadrant | BADHDUFLAG | Total packets | Discarded packets |
| A | 0 | 100 | 0 |
| B | 0 | 100 | 0 |
| C | 0 | 100 | 0 |
| D | 0 | 100 | 0 |
| Mode M9 | |||
|---|---|---|---|
| Quadrant | BADHDUFLAG | Total packets | Discarded packets |
| A | 0 | 10 | 0 |
| B | 0 | 10 | 0 |
| C | 0 | 10 | 0 |
| D | 0 | 10 | 0 |
| Quadrant | Total seconds | Saturated seconds | Saturation percentage |
|---|---|---|---|
| A | 4813 | 30 | 0.623312% |
| B | 4813 | 43 | 0.893414% |
| C | 4813 | 43 | 0.893414% |
| D | 4812 | 217 | 4.509559% |
Noise dominated data is calculated using 1-second bins in cleaned event files. If a bin has >2000 counts, and if more than 50% of those come from <1% of pixels, then it is considered to be noise-dominated and hence unusable.
| Quadrant | # 1 sec bins | Bins with >0 counts | Bins with >2000 counts | High rate bins dominated by noise | Noise dominated (total time) | Noise dominated (detector-on time) | Marked lightcurve |
|---|---|---|---|---|---|---|---|
| A | 5868 | 4814 | 0 | 0 | 0.00% | 0.00% | 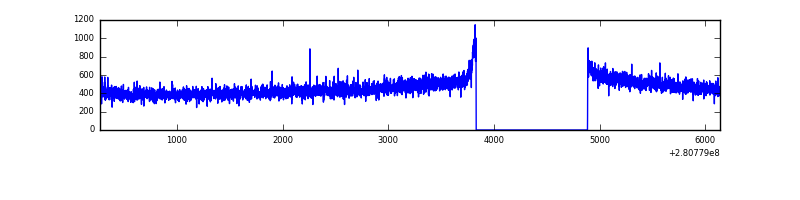 |
| B | 5868 | 4814 | 2 | 2 | 0.03% | 0.04% | 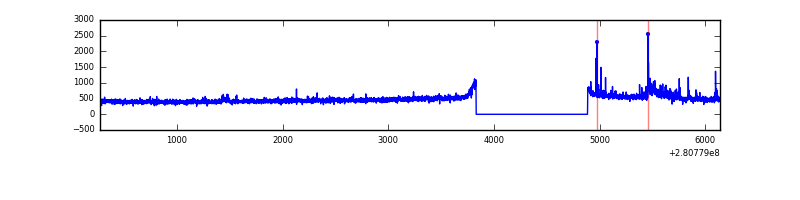 |
| C | 5868 | 4814 | 0 | 0 | 0.00% | 0.00% | 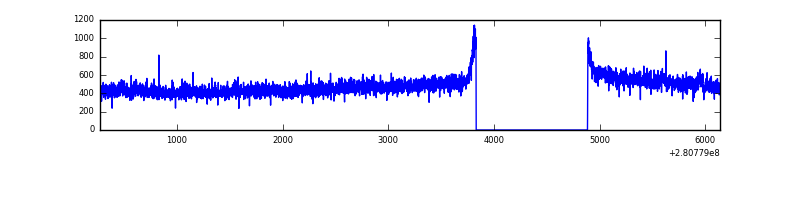 |
| D | 5867 | 4813 | 160 | 160 | 2.73% | 3.32% | 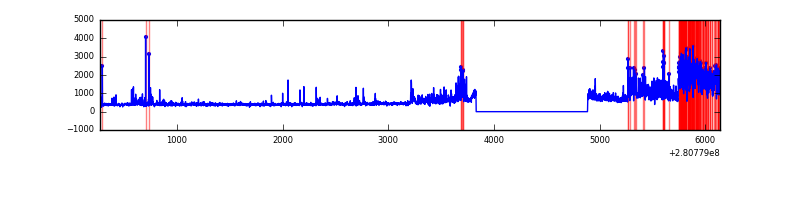 |
Top three noisy pixels from each quadrant. If the there are fewer than three noisy pixels in the level2.evt file, extra rows are filled as -1
| Pixel properties | Quadrant properties | ||||||
|---|---|---|---|---|---|---|---|
| Quadrant | DetID | PixID | Counts | Sigma | Mean | Median | Sigma |
| A | 0 | 226 | 5064 | 39.16 | 567 | 555 | 115.1 |
| A | 12 | 194 | 4172 | 31.41 | 567 | 555 | 115.1 |
| A | 3 | 137 | 4123 | 30.99 | 567 | 555 | 115.1 |
| B | 0 | 189 | 65562 | 592.53 | 569 | 555 | 109.7 |
| B | 0 | 197 | 17366 | 153.23 | 569 | 555 | 109.7 |
| B | 6 | 36 | 13220 | 115.44 | 569 | 555 | 109.7 |
| C | 14 | 238 | 85315 | 656.48 | 548 | 552 | 129.1 |
| C | 3 | 233 | 53005 | 406.24 | 548 | 552 | 129.1 |
| C | 7 | 247 | 8656 | 62.76 | 548 | 552 | 129.1 |
| D | 5 | 222 | 1124877 | 8492.19 | 547 | 532 | 132.4 |
| D | 15 | 0 | 36123 | 268.82 | 547 | 532 | 132.4 |
| D | 10 | 70 | 33924 | 252.21 | 547 | 532 | 132.4 |
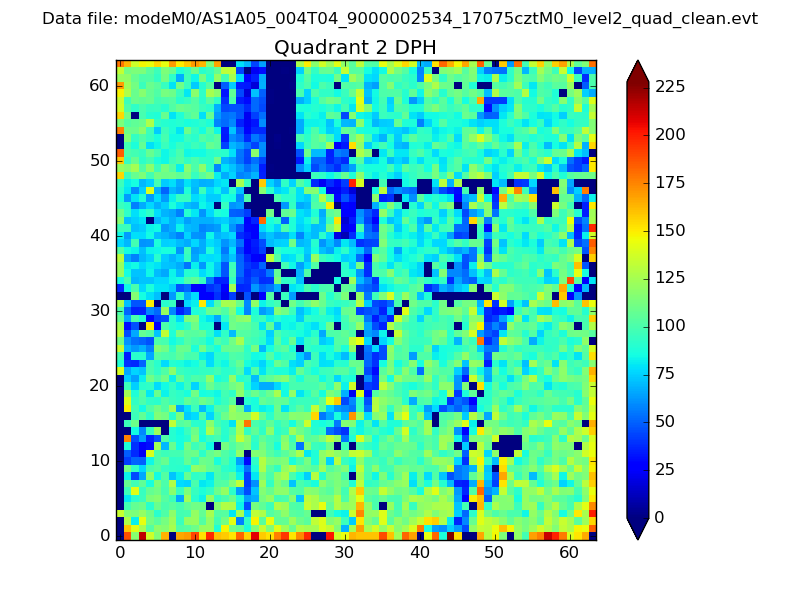
Histogram calculated using DETX and DETY for each event in the final _common_clean file
| Quadrant A | 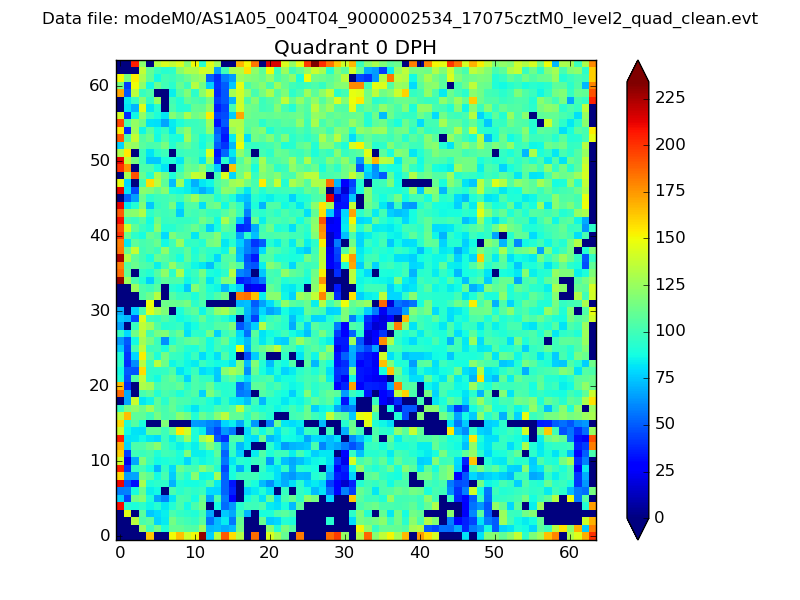 |
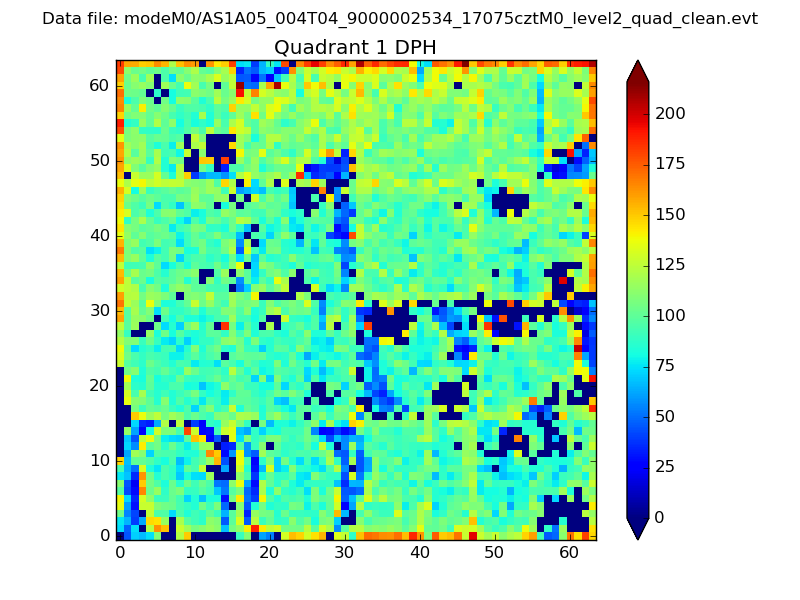 |
Quadrant B |
|---|---|---|---|
| Quadrant D | 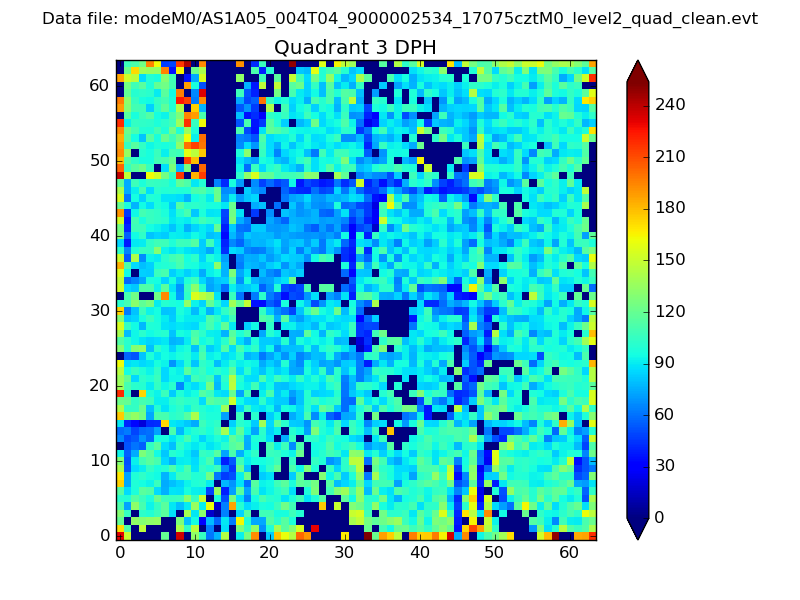 |
 |
Quadrant C |
| Plot type | Count rate plots | Images |
|---|---|---|
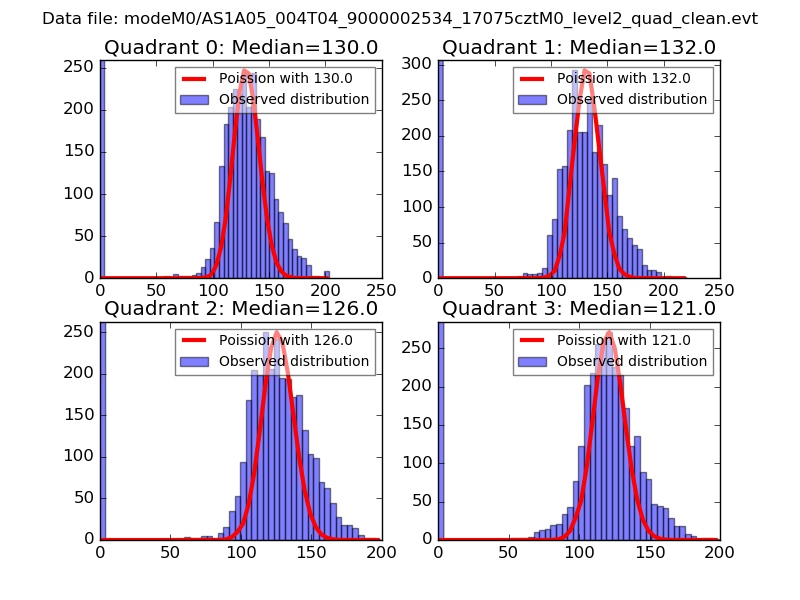
| Comparison with Poisson distribution Blue bars denote a histogram of data divided into 1 sec bins. Red curve is a Poisson curve with rate = median count rate of data. |
 |
 |
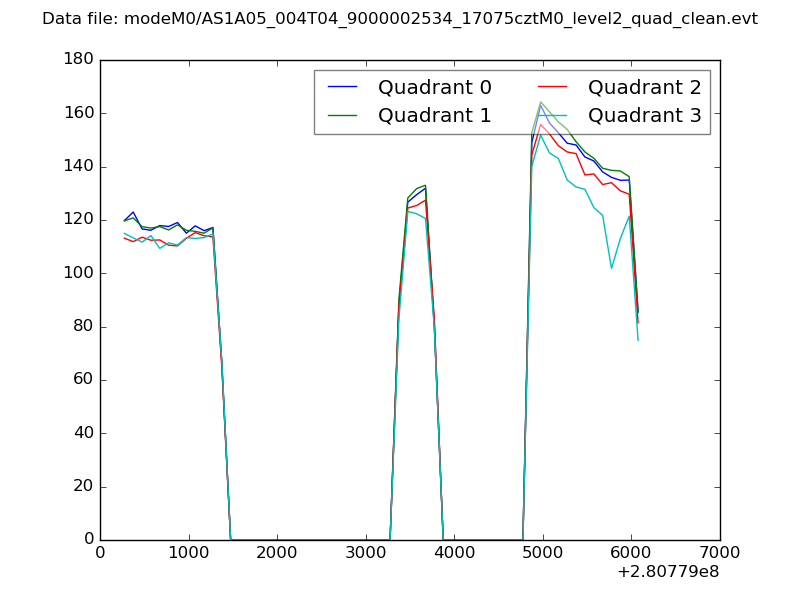
| Quadrant-wise count rates Data is divided into 100 sec bins |
 |
|
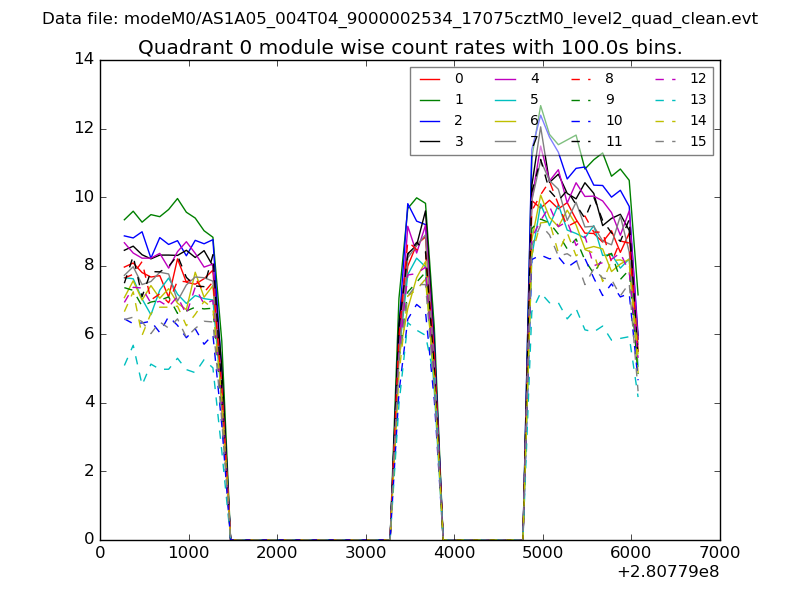
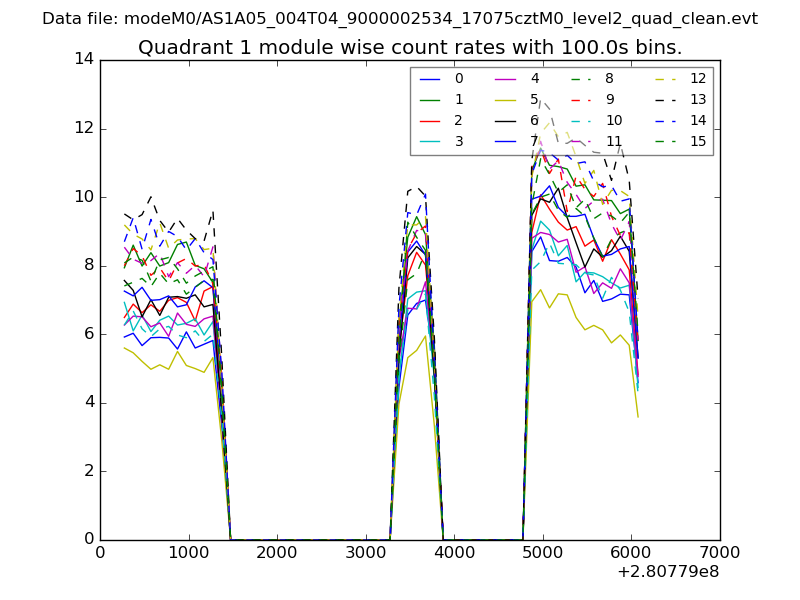
| Module-wise count rates for Quadrant A Data is divided into 100 sec bins |
 |
 |
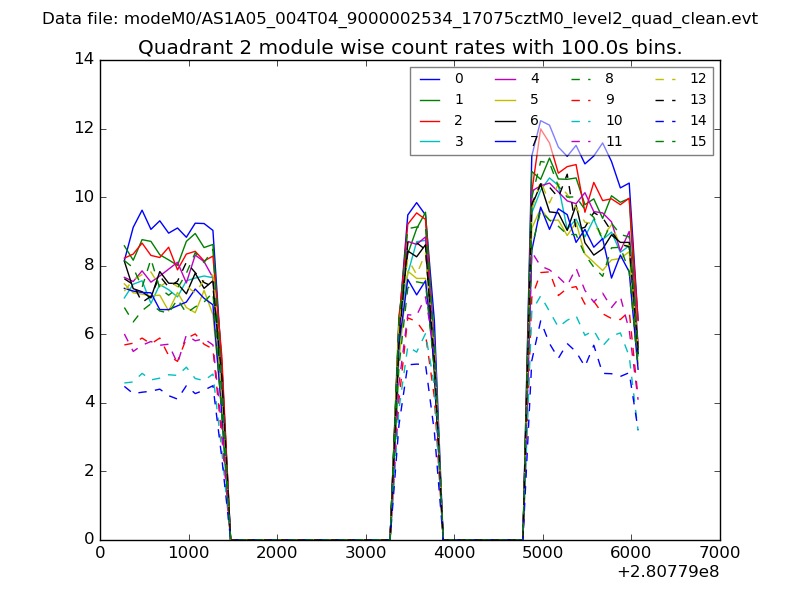
| Module-wise count rates for Quadrant B Data is divided into 100 sec bins |
 |
 |
| Module-wise count rates for Quadrant C Data is divided into 100 sec bins |
 |
 |
| Module-wise count rates for Quadrant D Data is divided into 100 sec bins |
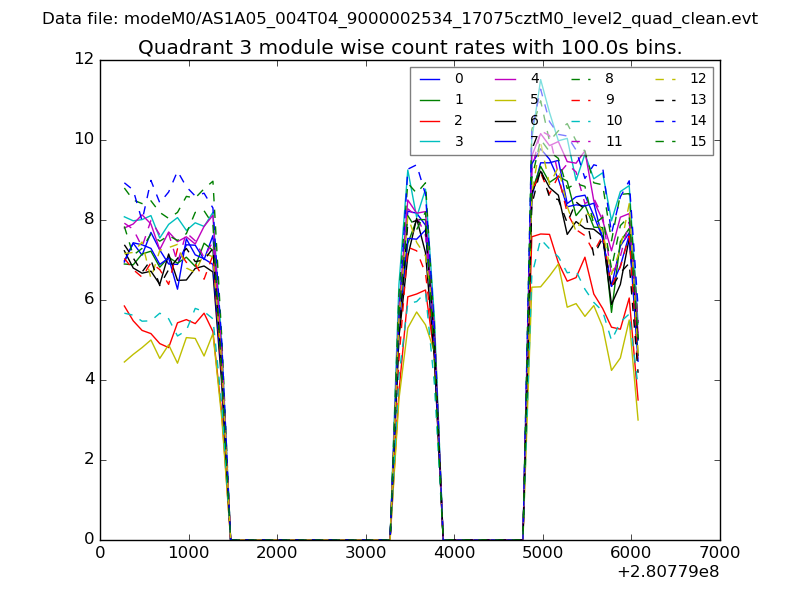 |
 |
| Parameter | Plot |
|---|---|
| CZT HV Monitor | 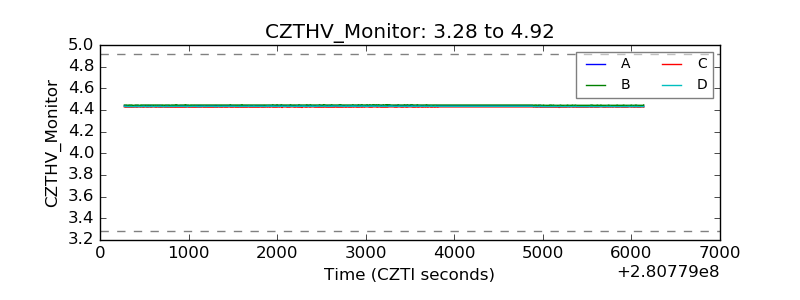 |
| D_VDD | 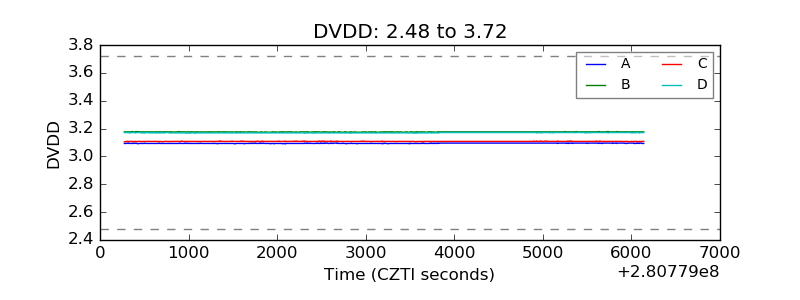 |
| Temperature 1 | 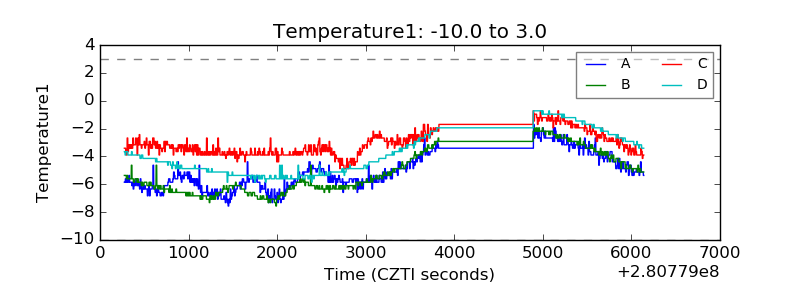 |
| Veto HV Monitor | 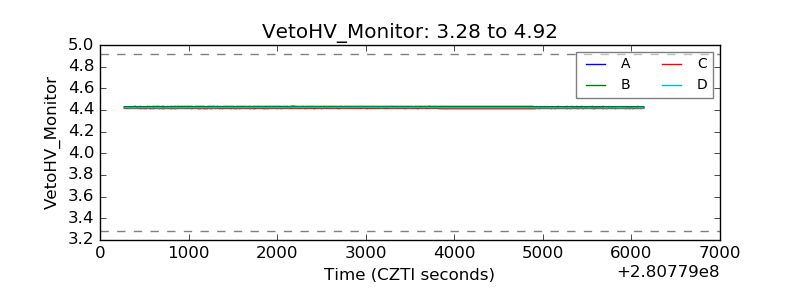 |
| Veto LLD | 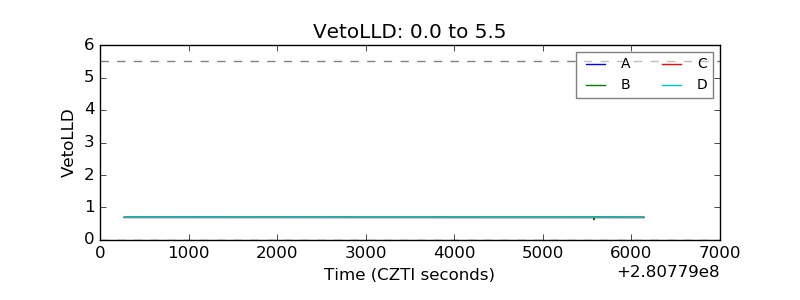 |
| Alpha Counter | 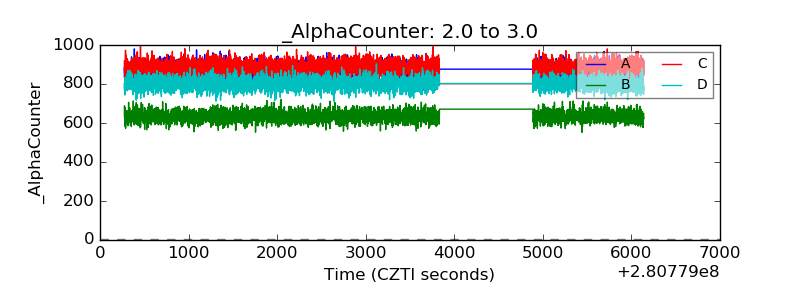 |
| _CPM_Rate | 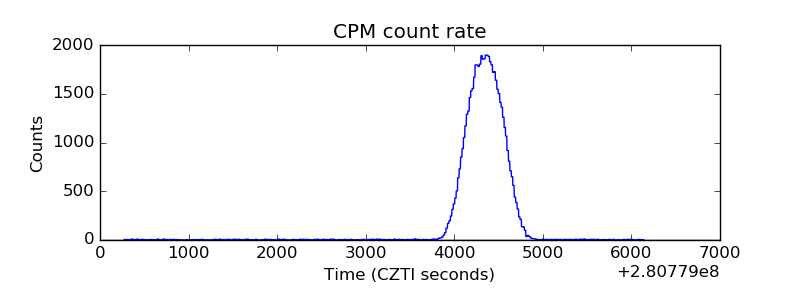 |
| CZT Counter | 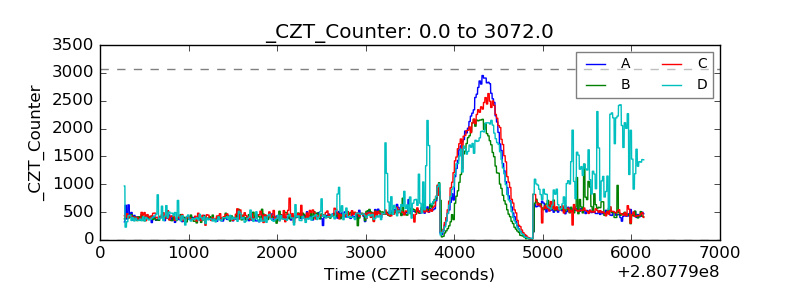 |
| +2.5 Volts monitor | 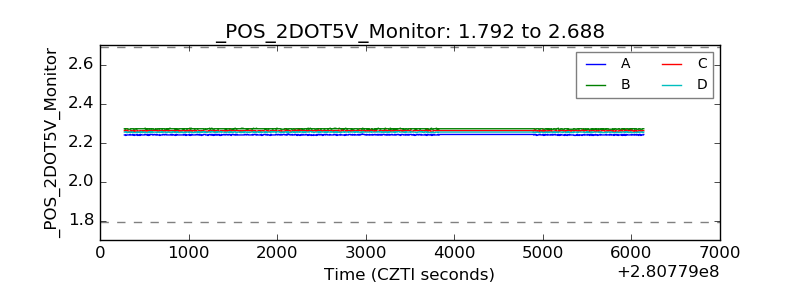 |
| +5 Volts monitor |  |
| _ROLL_ROT | 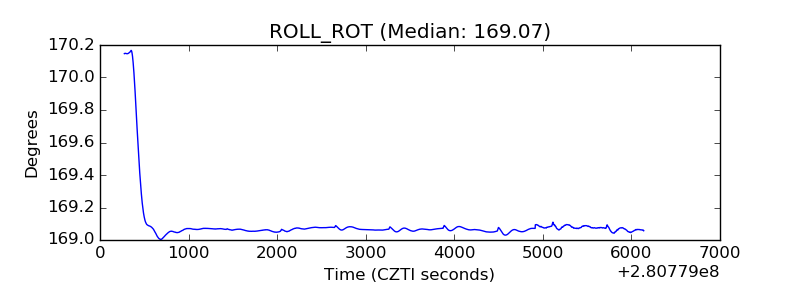 |
| _Roll_DEC | 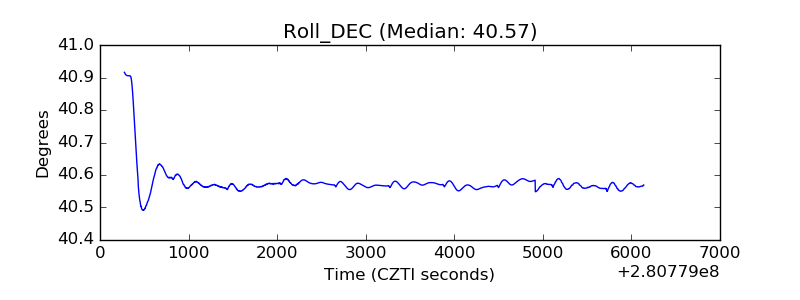 |
| _Roll_RA | 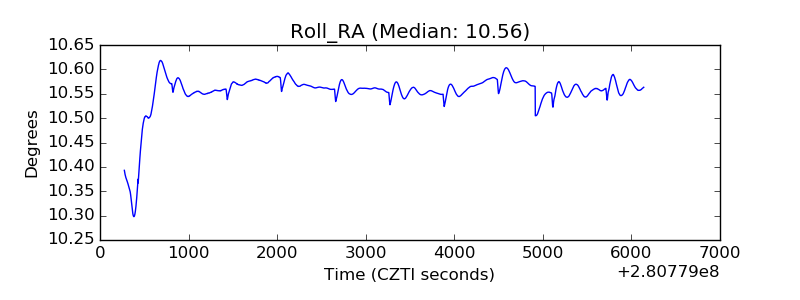 |
| Veto Counter |  |