| Param | Original file | Final file |
|---|---|---|
| Filename | modeM0/AS1A05_004T04_9000002534_17077cztM0_level2.evt | modeM0/AS1A05_004T04_9000002534_17077cztM0_level2_quad_clean.evt |
| Size (bytes) | 475,562,880 | 94,236,480 |
| Size | 453.5 MB | 89.9 MB |
| Events in quadrant A | 2,988,324 | 616,471 |
| Events in quadrant B | 3,357,678 | 626,290 |
| Events in quadrant C | 3,353,945 | 596,264 |
| Events in quadrant D | 4,270,757 | 571,090 |
| Mode M0 | |||
|---|---|---|---|
| Quadrant | BADHDUFLAG | Total packets | Discarded packets |
| A | 0 | 13149 | 2 |
| B | 0 | 14267 | 2 |
| C | 0 | 14034 | 2 |
| D | 0 | 17015 | 2 |
| Mode SS | |||
|---|---|---|---|
| Quadrant | BADHDUFLAG | Total packets | Discarded packets |
| A | 0 | 132 | 0 |
| B | 0 | 132 | 0 |
| C | 0 | 132 | 0 |
| D | 0 | 132 | 0 |
| Mode M9 | |||
|---|---|---|---|
| Quadrant | BADHDUFLAG | Total packets | Discarded packets |
| A | 0 | 22 | 0 |
| B | 0 | 22 | 0 |
| C | 0 | 22 | 0 |
| D | 0 | 22 | 0 |
| Quadrant | Total seconds | Saturated seconds | Saturation percentage |
|---|---|---|---|
| A | 6356 | 33 | 0.519194% |
| B | 6356 | 59 | 0.928257% |
| C | 6356 | 64 | 1.006923% |
| D | 6356 | 250 | 3.933291% |
Noise dominated data is calculated using 1-second bins in cleaned event files. If a bin has >2000 counts, and if more than 50% of those come from <1% of pixels, then it is considered to be noise-dominated and hence unusable.
| Quadrant | # 1 sec bins | Bins with >0 counts | Bins with >2000 counts | High rate bins dominated by noise | Noise dominated (total time) | Noise dominated (detector-on time) | Marked lightcurve |
|---|---|---|---|---|---|---|---|
| A | 8616 | 6358 | 1 | 1 | 0.01% | 0.02% | 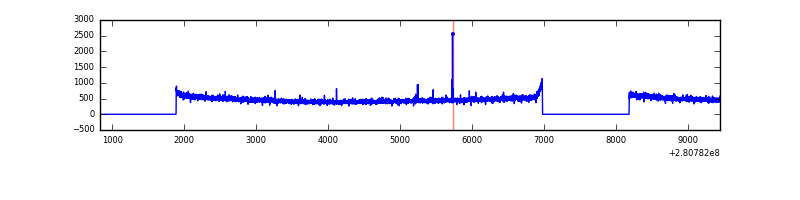 |
| B | 8616 | 6358 | 7 | 7 | 0.08% | 0.11% | 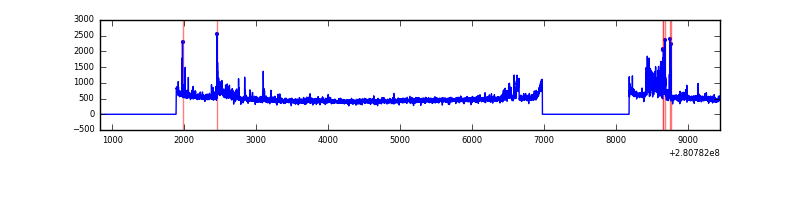 |
| C | 8616 | 6358 | 0 | 0 | 0.00% | 0.00% | 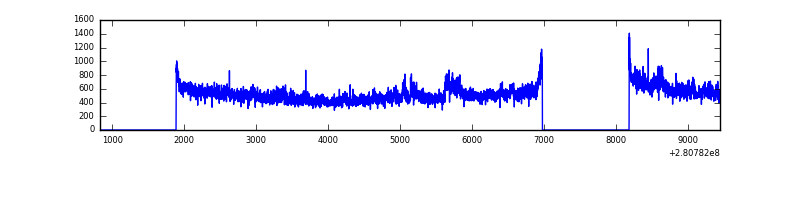 |
| D | 8616 | 6358 | 192 | 192 | 2.23% | 3.02% | 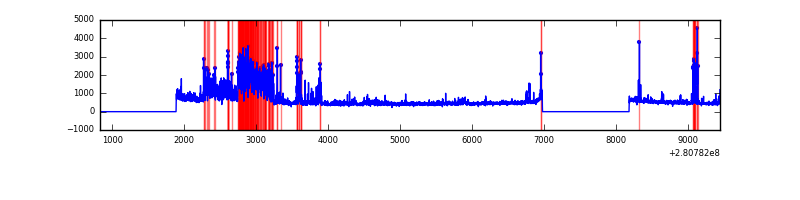 |
Top three noisy pixels from each quadrant. If the there are fewer than three noisy pixels in the level2.evt file, extra rows are filled as -1
| Pixel properties | Quadrant properties | ||||||
|---|---|---|---|---|---|---|---|
| Quadrant | DetID | PixID | Counts | Sigma | Mean | Median | Sigma |
| A | 4 | 2 | 9974 | 59.29 | 775 | 759 | 155.4 |
| A | 0 | 226 | 6844 | 39.15 | 775 | 759 | 155.4 |
| A | 12 | 194 | 5822 | 32.57 | 775 | 759 | 155.4 |
| B | 0 | 189 | 206775 | 1410.04 | 777 | 759 | 146.1 |
| B | 0 | 197 | 45552 | 306.58 | 777 | 759 | 146.1 |
| B | 0 | 246 | 29709 | 198.14 | 777 | 759 | 146.1 |
| C | 3 | 233 | 299541 | 1697.22 | 752 | 760 | 176.0 |
| C | 14 | 238 | 115455 | 651.52 | 752 | 760 | 176.0 |
| C | 7 | 247 | 7907 | 40.6 | 752 | 760 | 176.0 |
| D | 5 | 222 | 1183863 | 6515.34 | 753 | 733 | 181.6 |
| D | 10 | 70 | 168468 | 923.69 | 753 | 733 | 181.6 |
| D | 15 | 0 | 50787 | 275.64 | 753 | 733 | 181.6 |
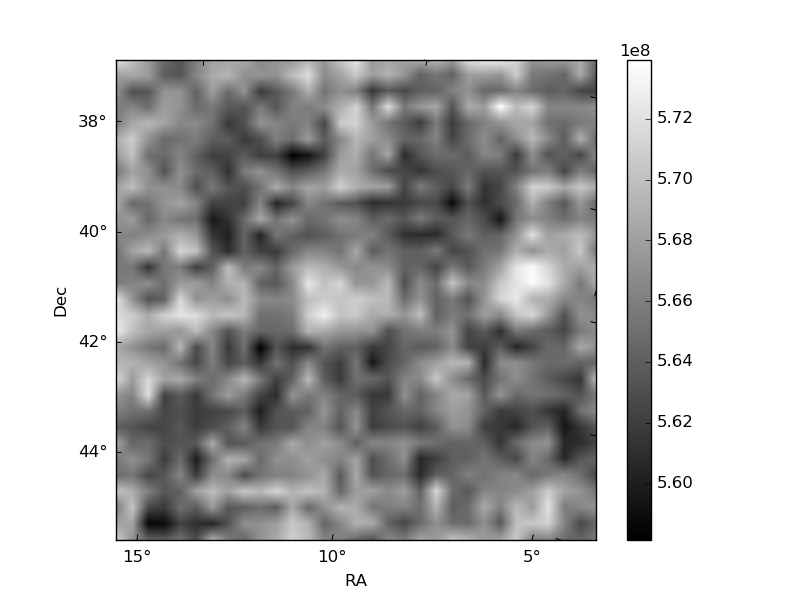
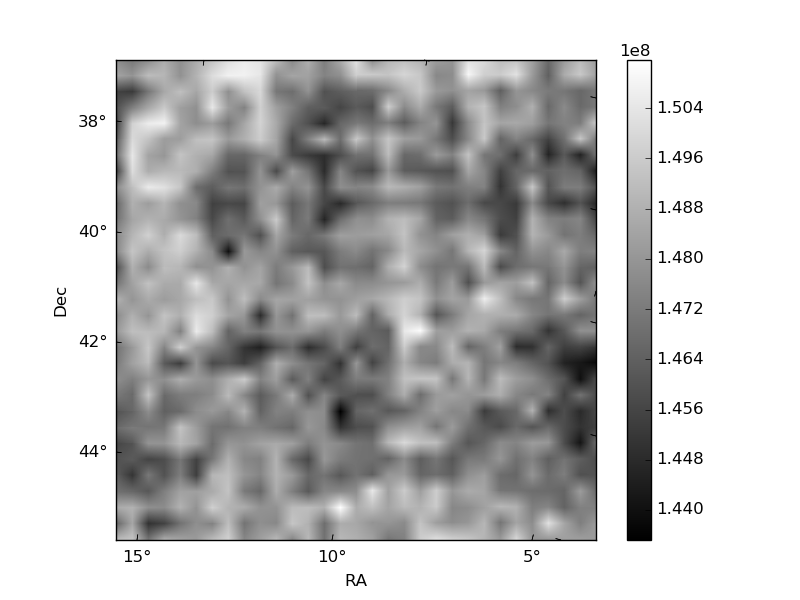
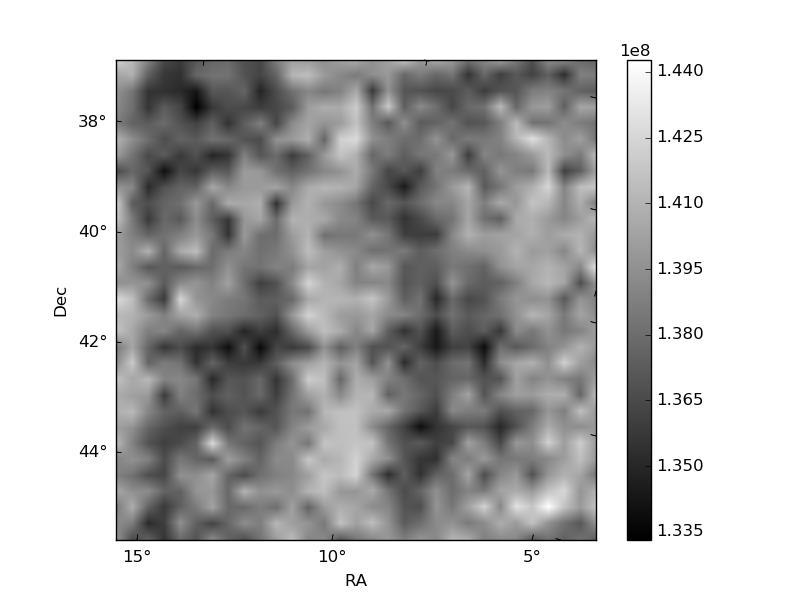
Histogram calculated using DETX and DETY for each event in the final _common_clean file
| Quadrant A | 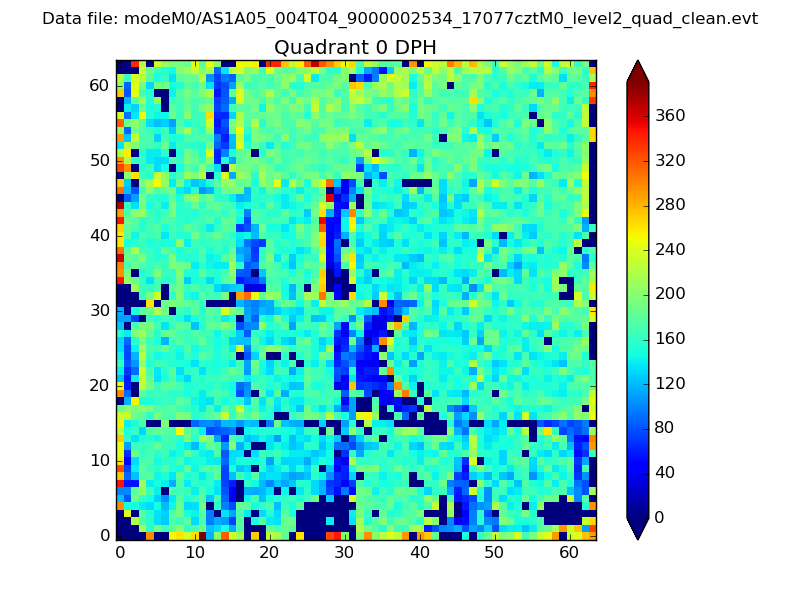 |
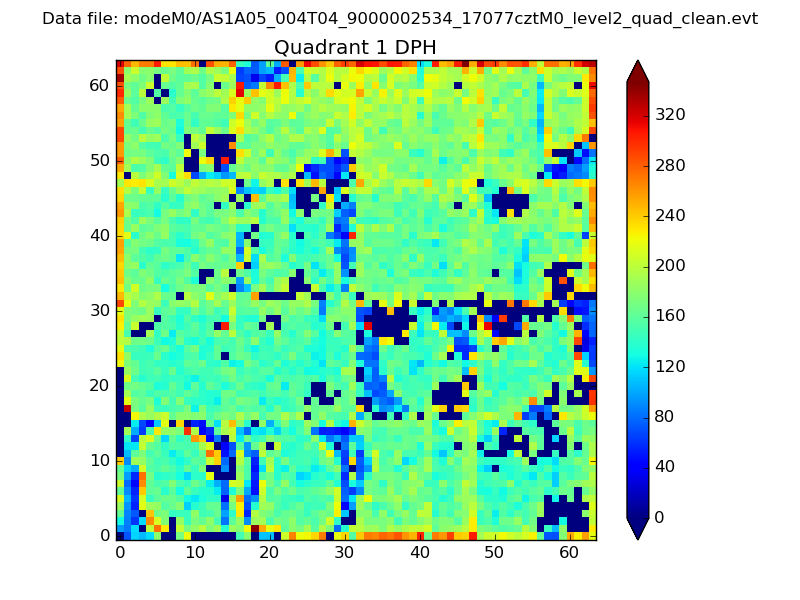 |
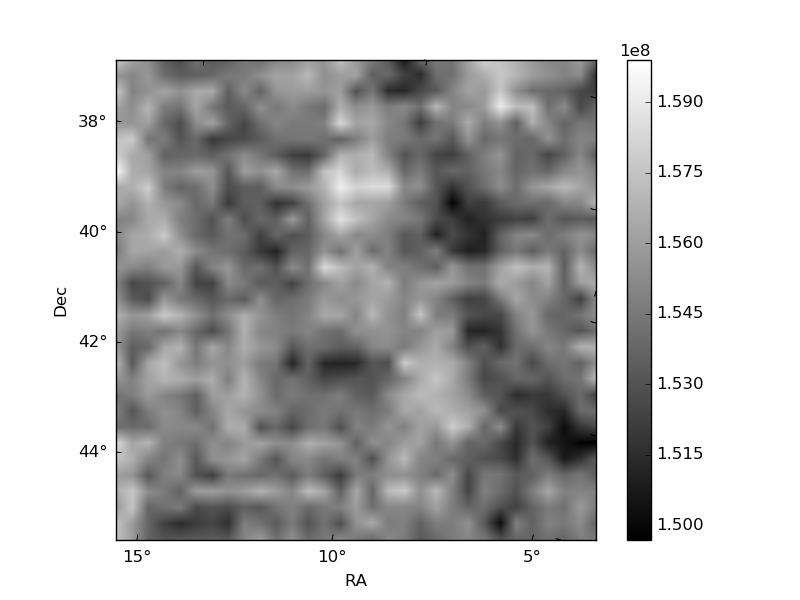
Quadrant B |
|---|---|---|---|
| Quadrant D | 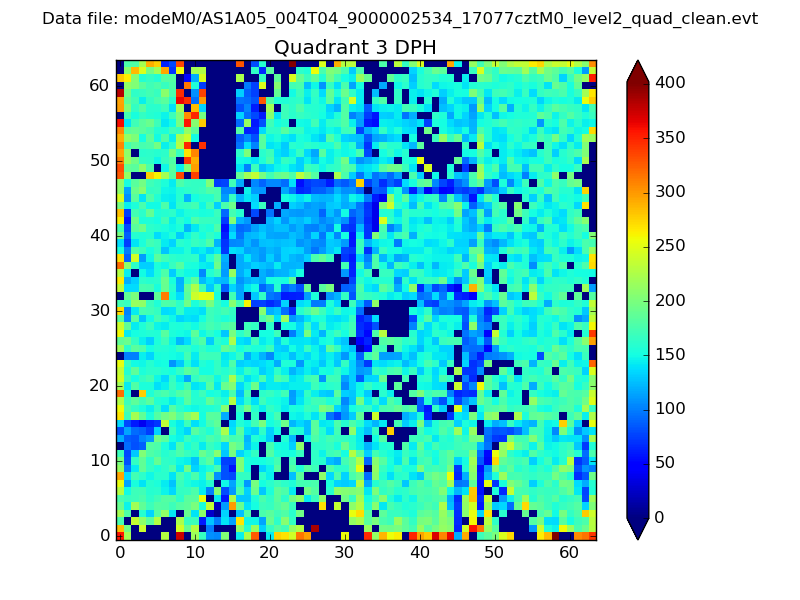 |
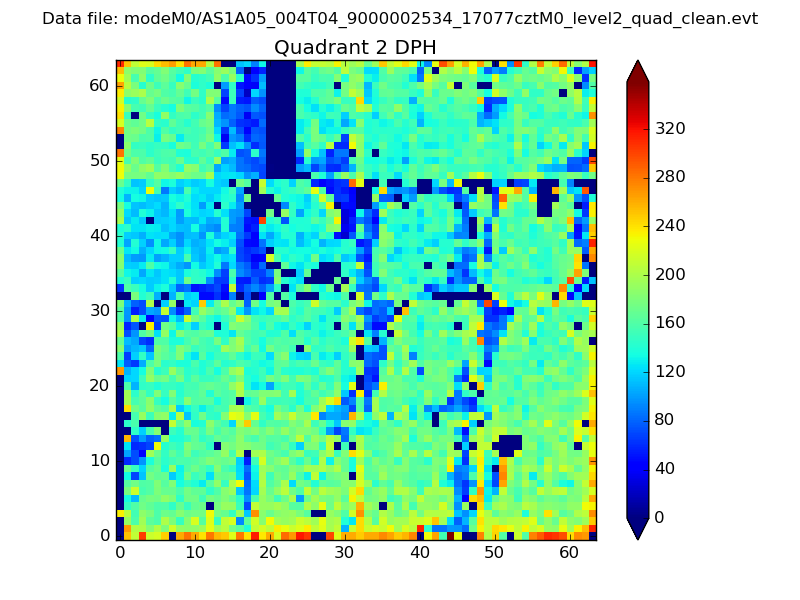 |
Quadrant C |
| Plot type | Count rate plots | Images |
|---|---|---|
| Comparison with Poisson distribution Blue bars denote a histogram of data divided into 1 sec bins. Red curve is a Poisson curve with rate = median count rate of data. |
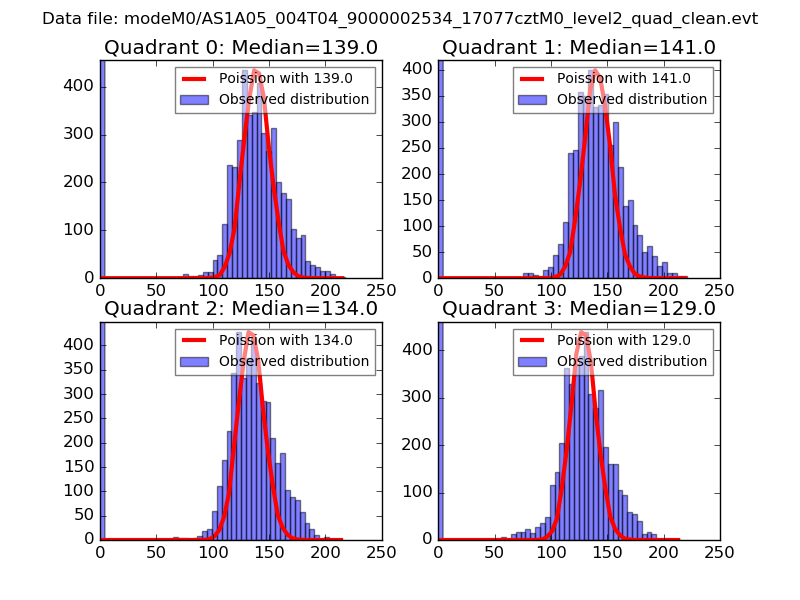 |
 |
| Quadrant-wise count rates Data is divided into 100 sec bins |
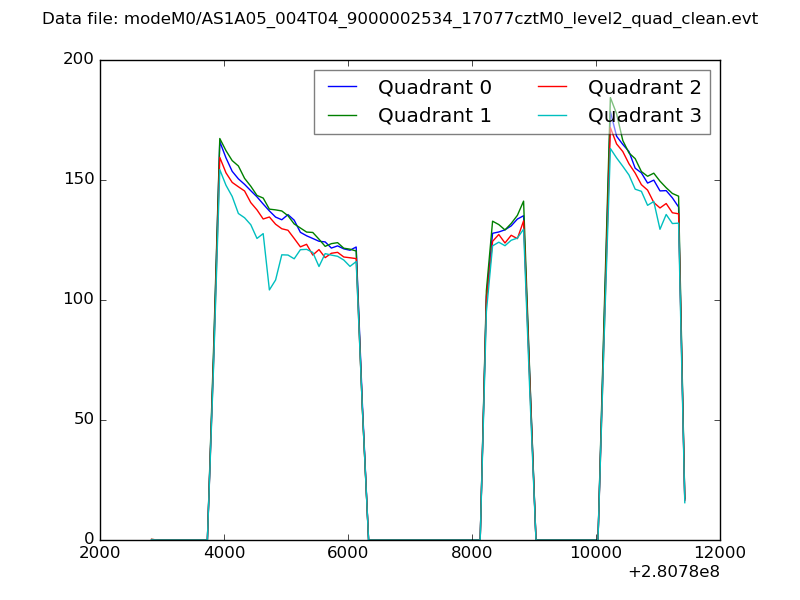 |
|
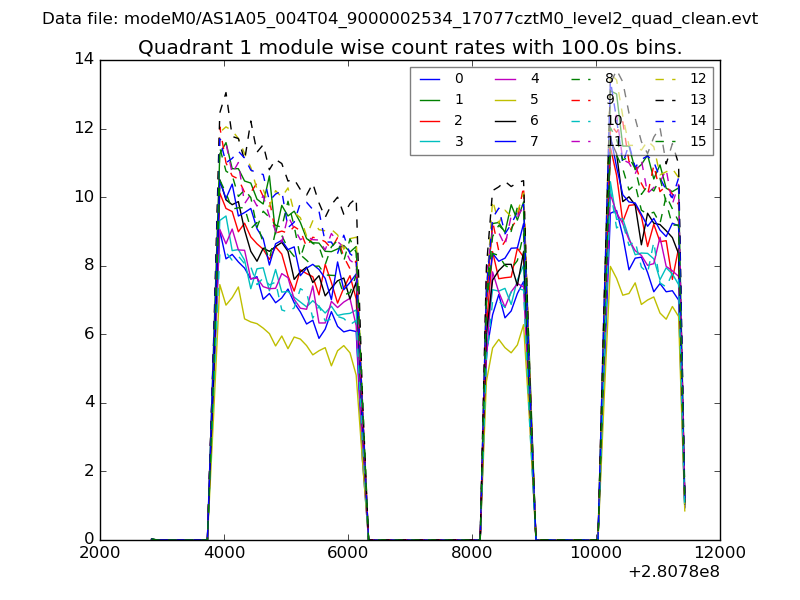
| Module-wise count rates for Quadrant A Data is divided into 100 sec bins |
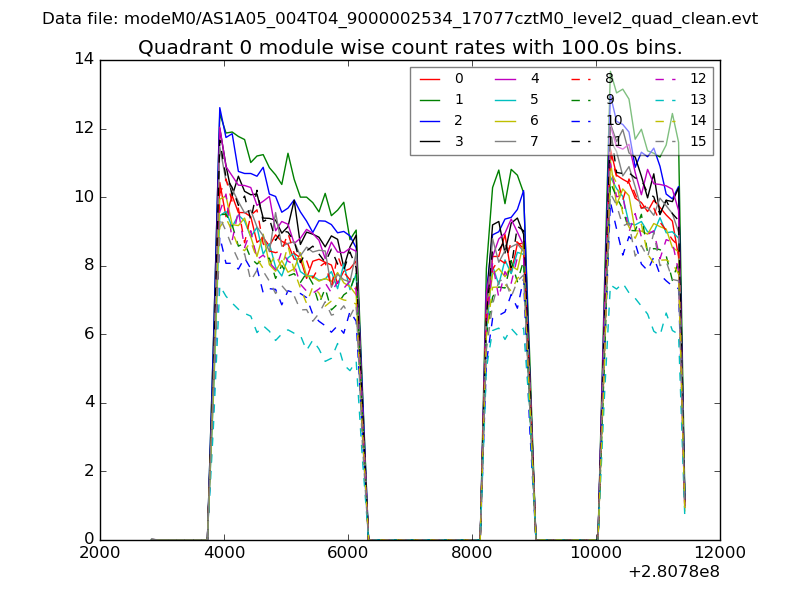 |
 |
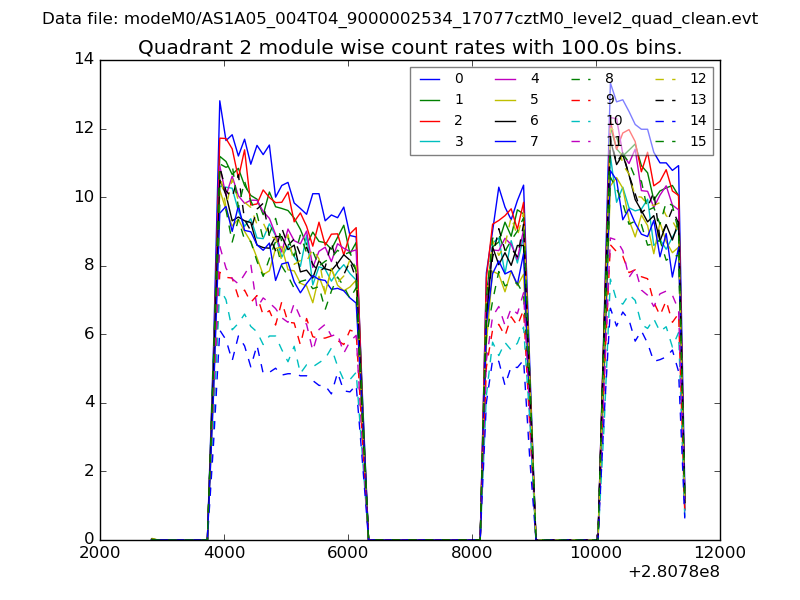
| Module-wise count rates for Quadrant B Data is divided into 100 sec bins |
 |
 |
| Module-wise count rates for Quadrant C Data is divided into 100 sec bins |
 |
 |
| Module-wise count rates for Quadrant D Data is divided into 100 sec bins |
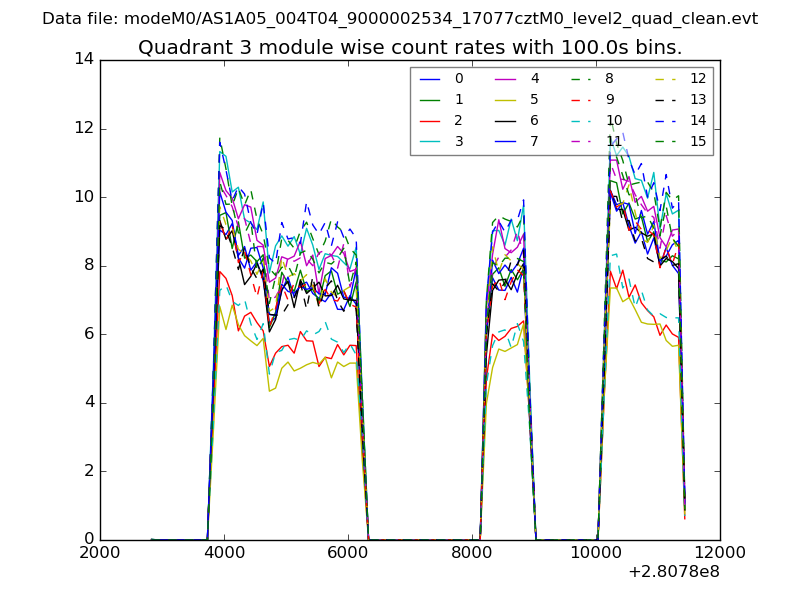 |
 |
| Parameter | Plot |
|---|---|
| CZT HV Monitor | 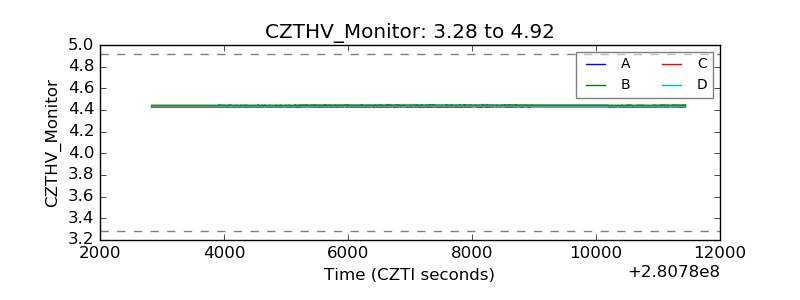 |
| D_VDD | 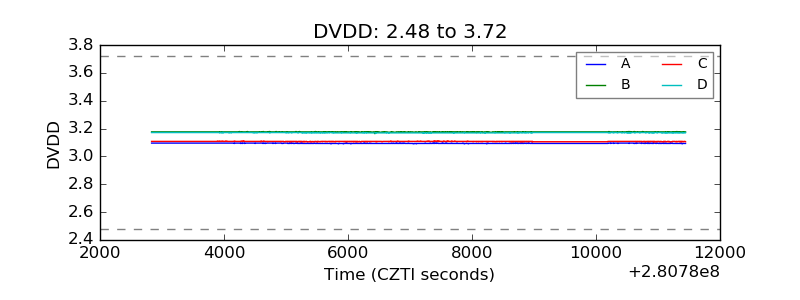 |
| Temperature 1 |  |
| Veto HV Monitor | 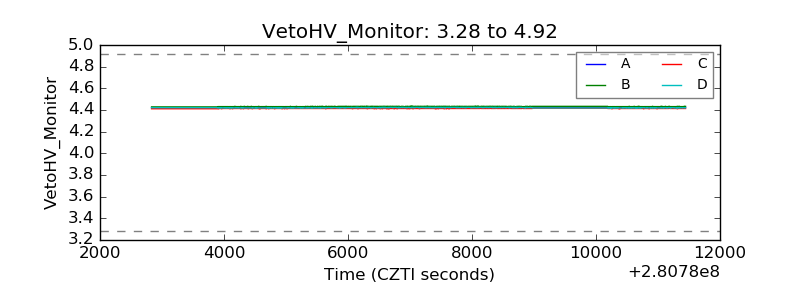 |
| Veto LLD | 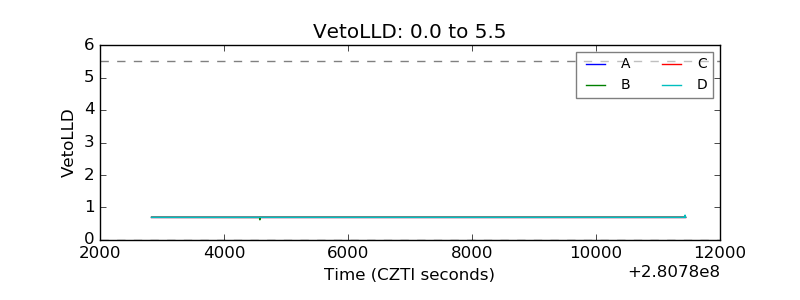 |
| Alpha Counter |  |
| _CPM_Rate | 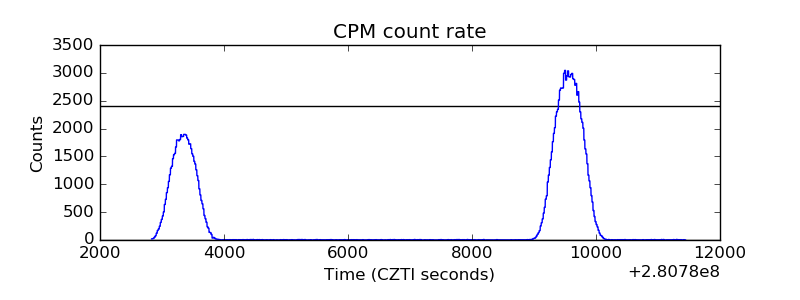 |
| CZT Counter | 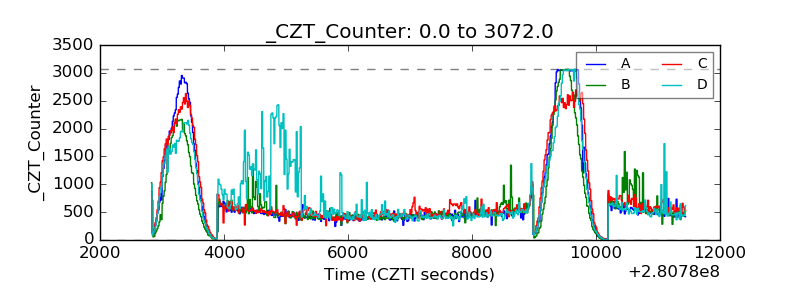 |
| +2.5 Volts monitor |  |
| +5 Volts monitor |  |
| _ROLL_ROT | 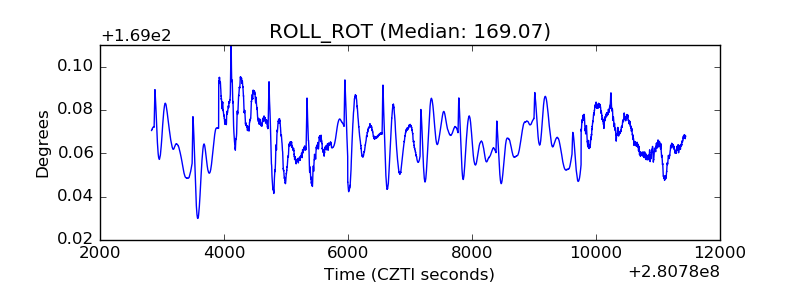 |
| _Roll_DEC |  |
| _Roll_RA | 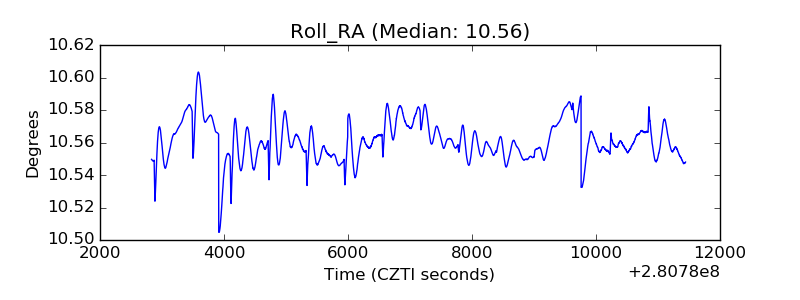 |
| Veto Counter | 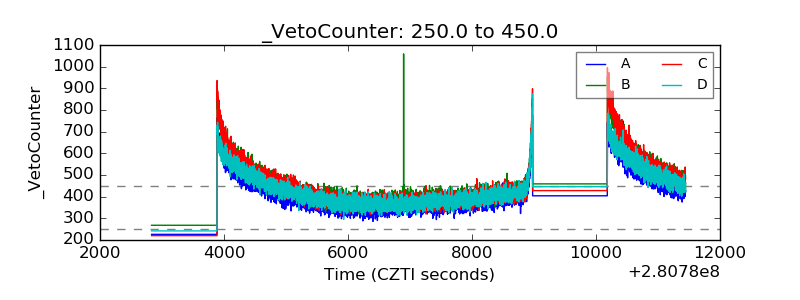 |