| Param | Original file | Final file |
|---|---|---|
| Filename | modeM0/AS1A05_004T04_9000002534_17078cztM0_level2.evt | modeM0/AS1A05_004T04_9000002534_17078cztM0_level2_quad_clean.evt |
| Size (bytes) | 457,482,240 | 96,586,560 |
| Size | 436.3 MB | 92.1 MB |
| Events in quadrant A | 2,998,225 | 633,428 |
| Events in quadrant B | 3,301,391 | 651,056 |
| Events in quadrant C | 3,727,890 | 615,006 |
| Events in quadrant D | 3,403,408 | 589,867 |
| Mode M0 | |||
|---|---|---|---|
| Quadrant | BADHDUFLAG | Total packets | Discarded packets |
| A | 0 | 12973 | 2 |
| B | 0 | 13810 | 2 |
| C | 0 | 15175 | 2 |
| D | 0 | 14432 | 2 |
| Mode SS | |||
|---|---|---|---|
| Quadrant | BADHDUFLAG | Total packets | Discarded packets |
| A | 0 | 128 | 0 |
| B | 0 | 128 | 0 |
| C | 0 | 128 | 0 |
| D | 0 | 128 | 0 |
| Mode M9 | |||
|---|---|---|---|
| Quadrant | BADHDUFLAG | Total packets | Discarded packets |
| A | 0 | 22 | 0 |
| B | 0 | 23 | 0 |
| C | 0 | 23 | 0 |
| D | 0 | 23 | 0 |
| Quadrant | Total seconds | Saturated seconds | Saturation percentage |
|---|---|---|---|
| A | 6239 | 17 | 0.272480% |
| B | 6239 | 36 | 0.577016% |
| C | 6238 | 62 | 0.993908% |
| D | 6238 | 115 | 1.843540% |
Noise dominated data is calculated using 1-second bins in cleaned event files. If a bin has >2000 counts, and if more than 50% of those come from <1% of pixels, then it is considered to be noise-dominated and hence unusable.
| Quadrant | # 1 sec bins | Bins with >0 counts | Bins with >2000 counts | High rate bins dominated by noise | Noise dominated (total time) | Noise dominated (detector-on time) | Marked lightcurve |
|---|---|---|---|---|---|---|---|
| A | 7544 | 6240 | 0 | 0 | 0.00% | 0.00% | 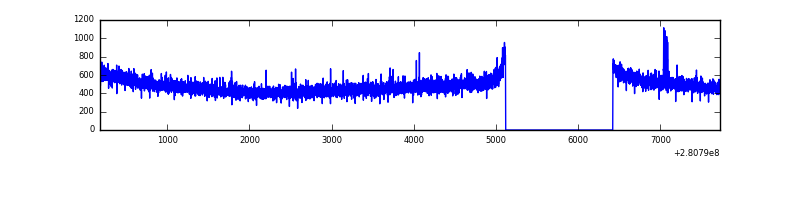 |
| B | 7544 | 6240 | 7 | 7 | 0.09% | 0.11% | 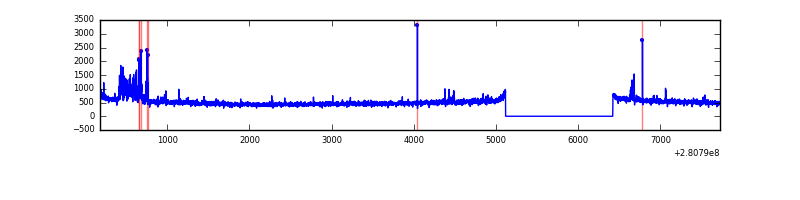 |
| C | 7543 | 6239 | 0 | 0 | 0.00% | 0.00% | 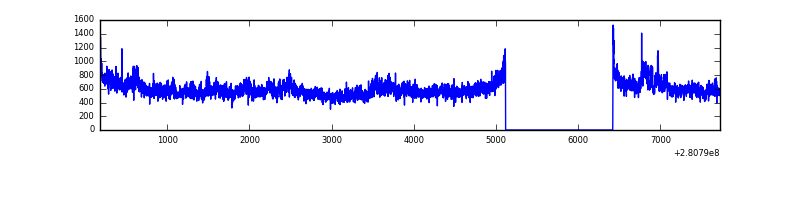 |
| D | 7543 | 6239 | 83 | 83 | 1.10% | 1.33% | 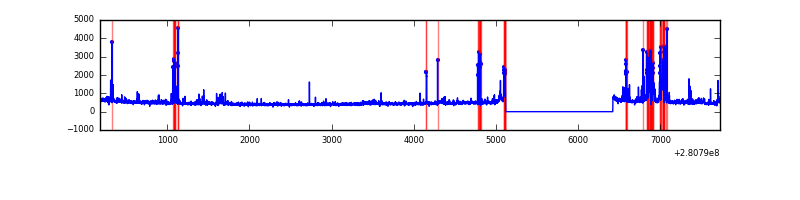 |
Top three noisy pixels from each quadrant. If the there are fewer than three noisy pixels in the level2.evt file, extra rows are filled as -1
| Pixel properties | Quadrant properties | ||||||
|---|---|---|---|---|---|---|---|
| Quadrant | DetID | PixID | Counts | Sigma | Mean | Median | Sigma |
| A | 4 | 2 | 12337 | 74.01 | 777 | 762 | 156.4 |
| A | 0 | 226 | 6770 | 38.41 | 777 | 762 | 156.4 |
| A | 12 | 194 | 5753 | 31.91 | 777 | 762 | 156.4 |
| B | 0 | 189 | 130686 | 893.69 | 784 | 767 | 145.4 |
| B | 0 | 197 | 39281 | 264.93 | 784 | 767 | 145.4 |
| B | 0 | 219 | 22763 | 151.31 | 784 | 767 | 145.4 |
| C | 3 | 233 | 647680 | 3673.94 | 756 | 762 | 176.1 |
| C | 14 | 238 | 117427 | 662.56 | 756 | 762 | 176.1 |
| C | 7 | 247 | 16014 | 86.62 | 756 | 762 | 176.1 |
| D | 5 | 222 | 331762 | 1840.9 | 750 | 729 | 179.8 |
| D | 10 | 70 | 170006 | 941.36 | 750 | 729 | 179.8 |
| D | 15 | 0 | 49684 | 272.24 | 750 | 729 | 179.8 |
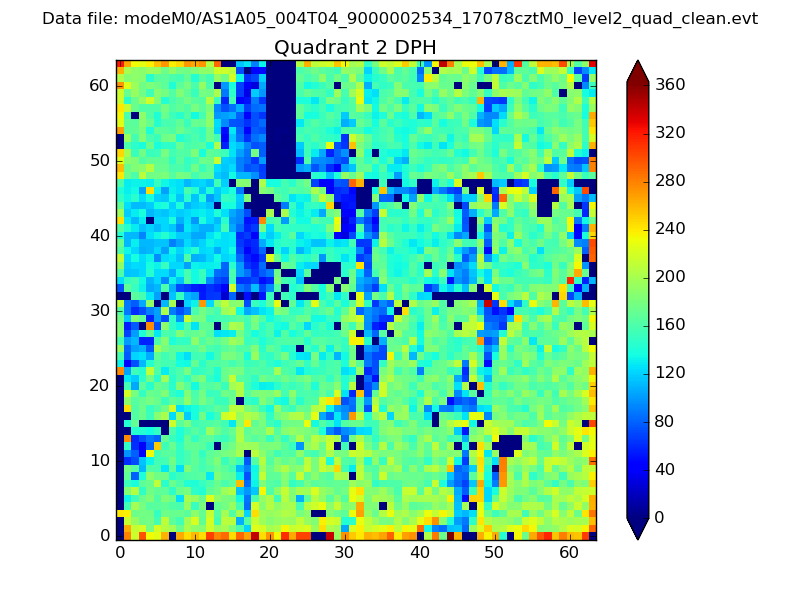
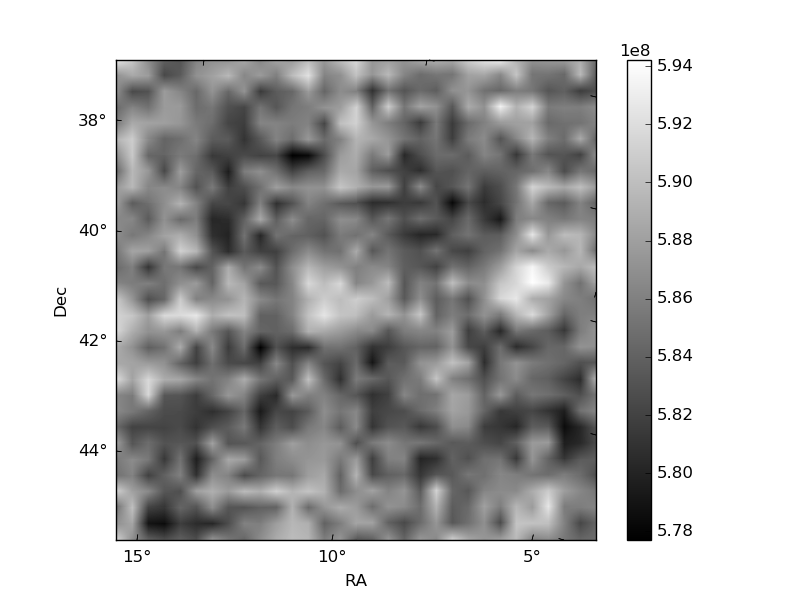
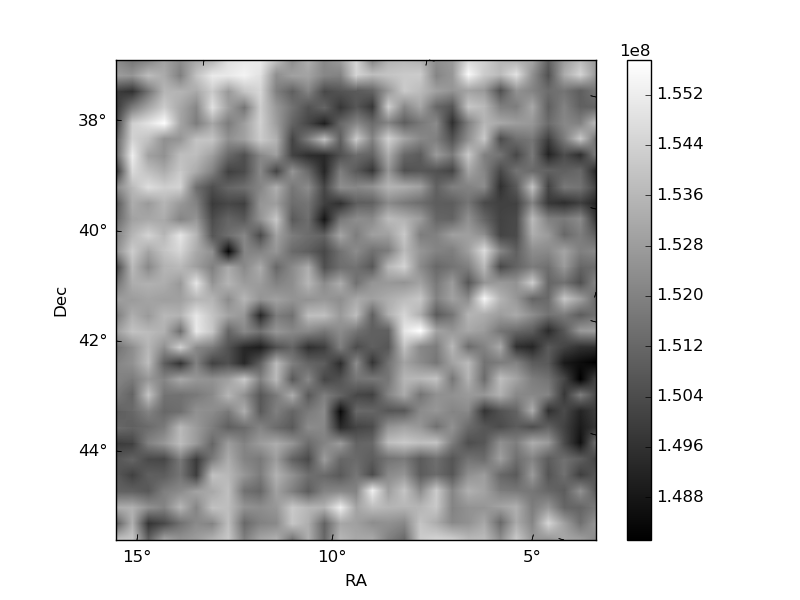
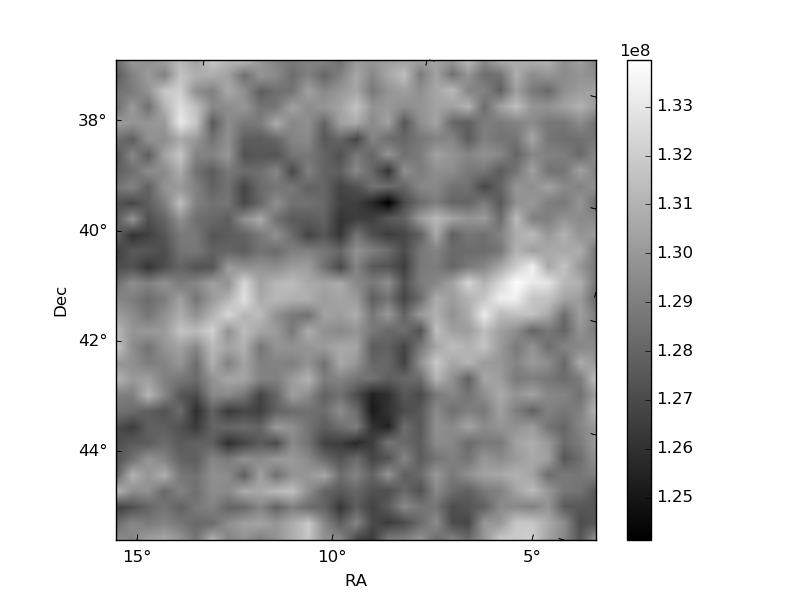
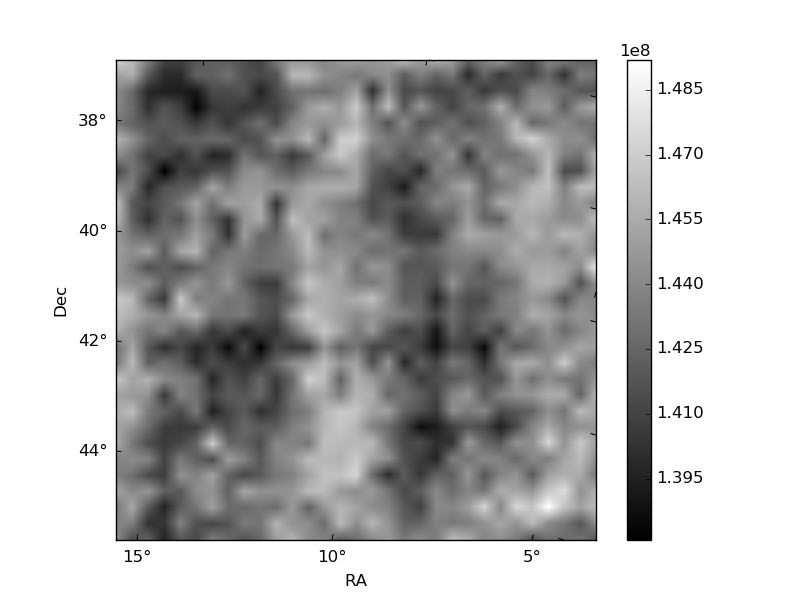
Histogram calculated using DETX and DETY for each event in the final _common_clean file
| Quadrant A | 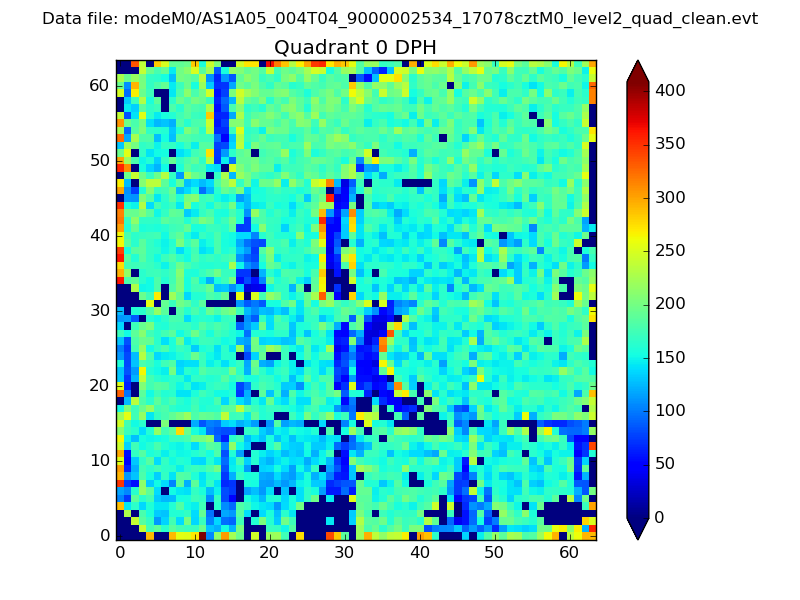 |
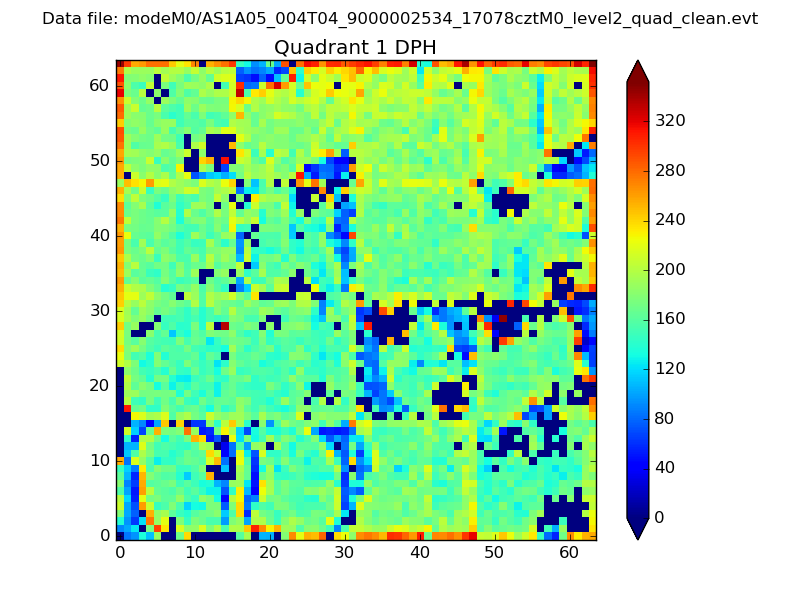 |
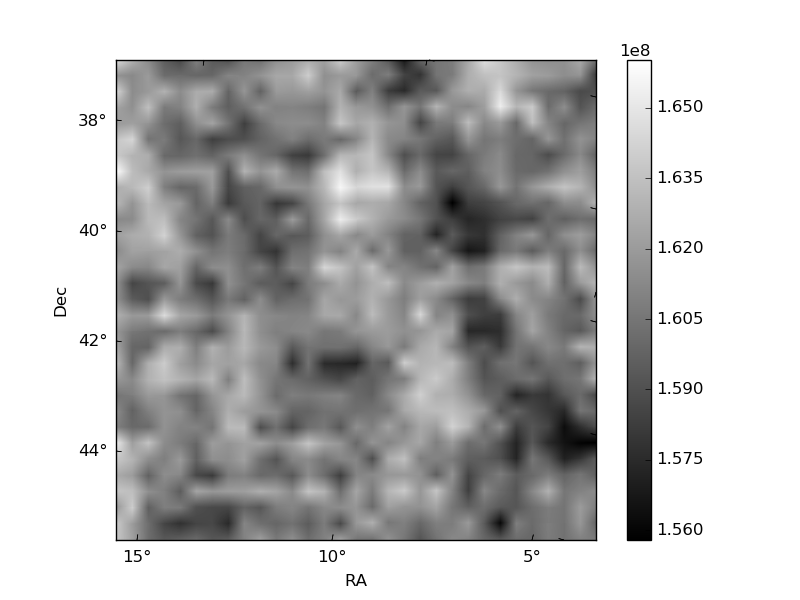
Quadrant B |
|---|---|---|---|
| Quadrant D | 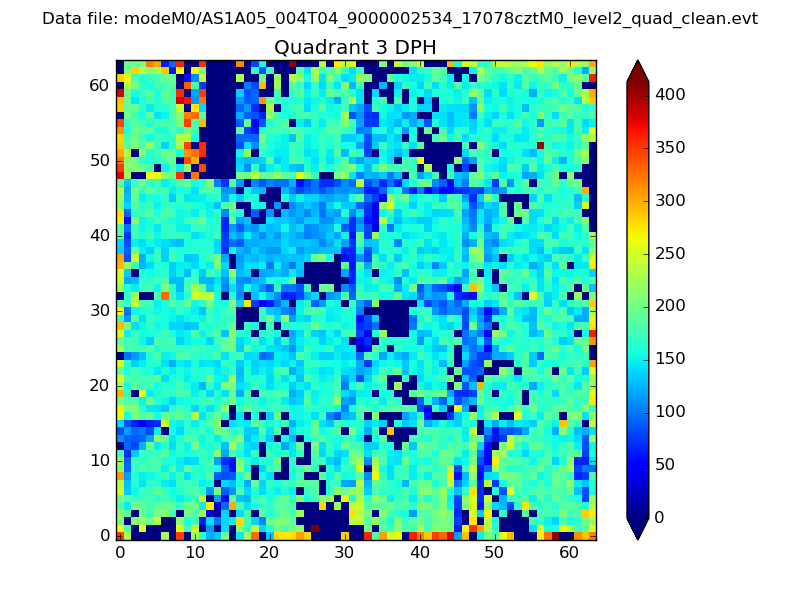 |
 |
Quadrant C |
| Plot type | Count rate plots | Images |
|---|---|---|
| Comparison with Poisson distribution Blue bars denote a histogram of data divided into 1 sec bins. Red curve is a Poisson curve with rate = median count rate of data. |
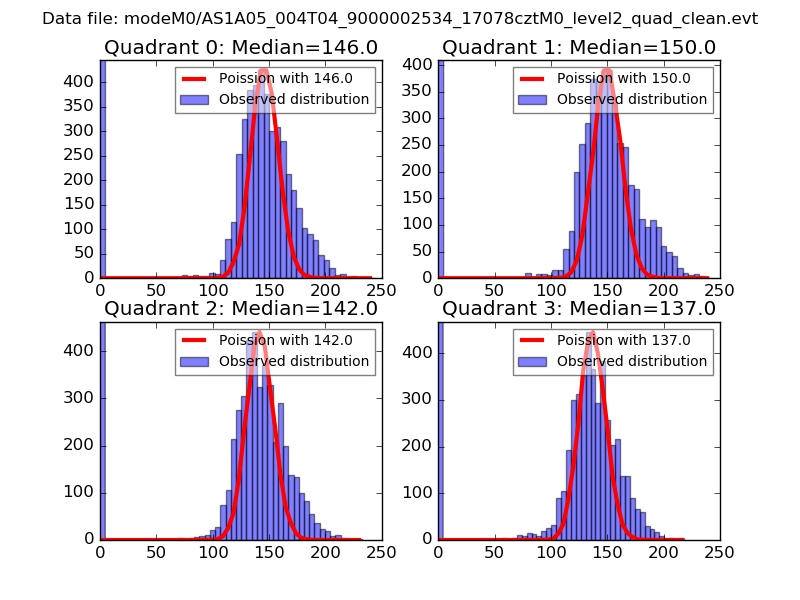 |
 |
| Quadrant-wise count rates Data is divided into 100 sec bins |
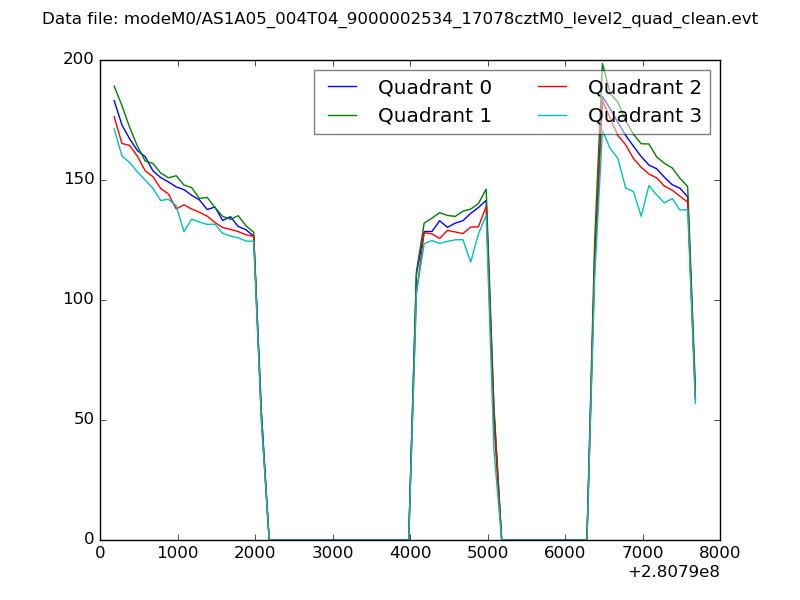 |
|
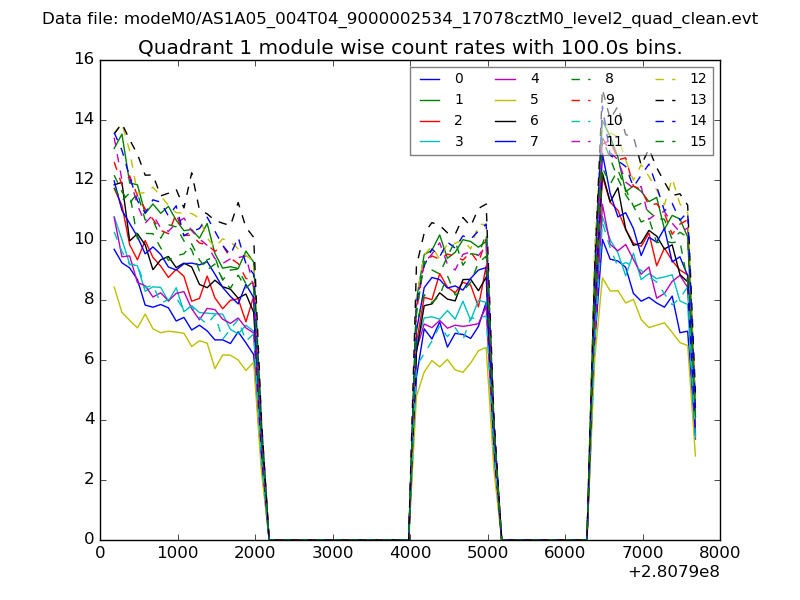
| Module-wise count rates for Quadrant A Data is divided into 100 sec bins |
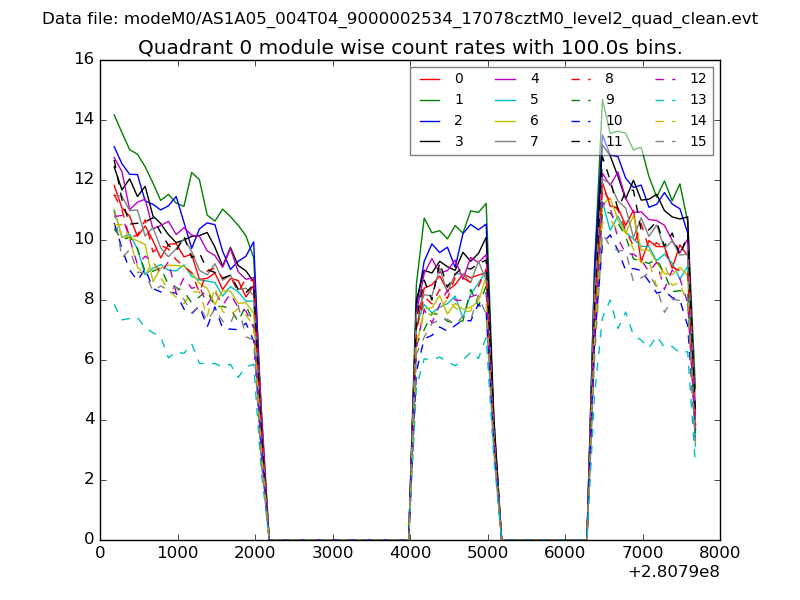 |
 |
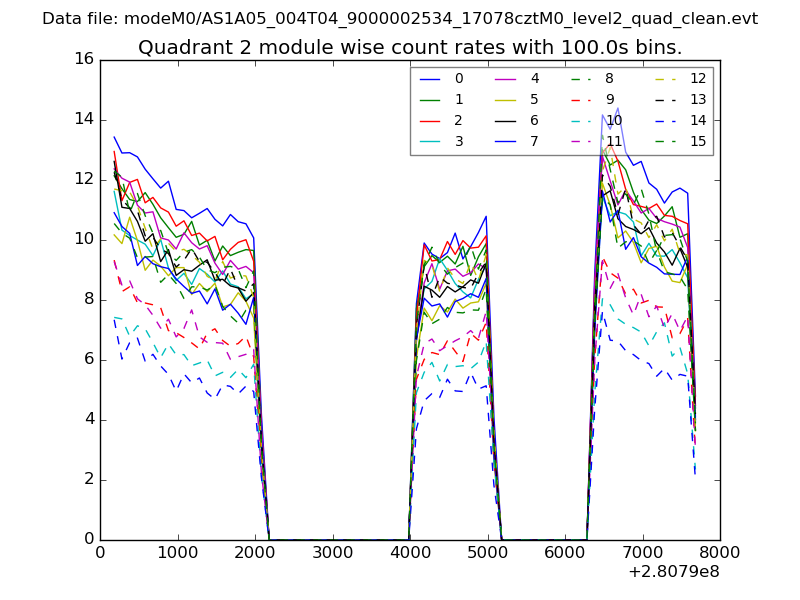
| Module-wise count rates for Quadrant B Data is divided into 100 sec bins |
 |
 |
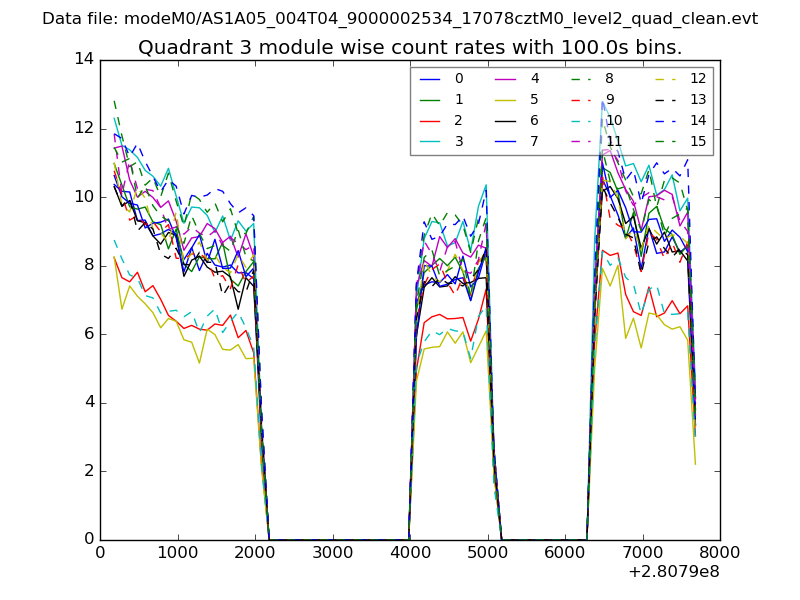
| Module-wise count rates for Quadrant C Data is divided into 100 sec bins |
 |
 |
| Module-wise count rates for Quadrant D Data is divided into 100 sec bins |
 |
 |
| Parameter | Plot |
|---|---|
| CZT HV Monitor | 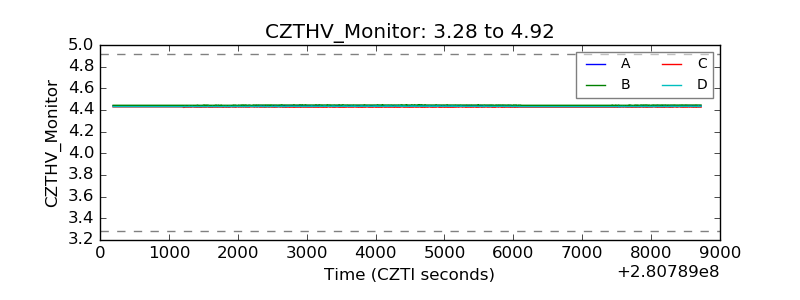 |
| D_VDD | 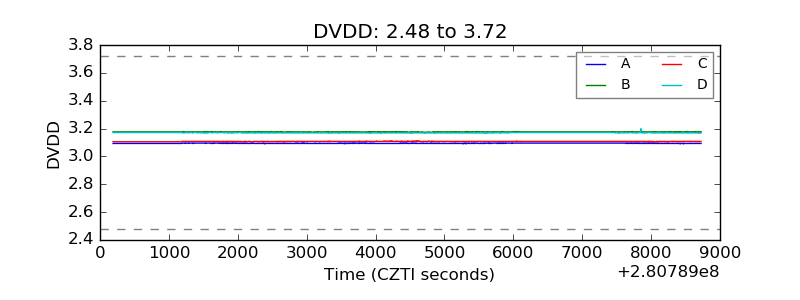 |
| Temperature 1 | 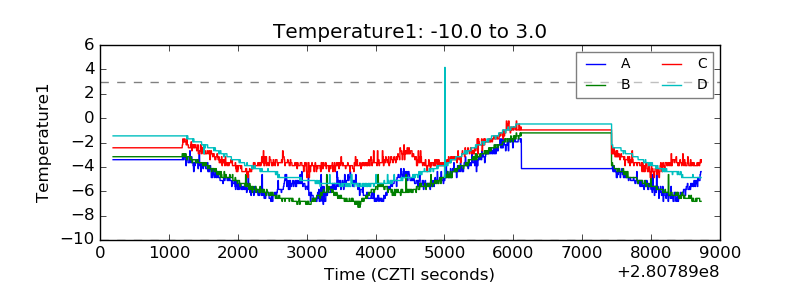 |
| Veto HV Monitor | 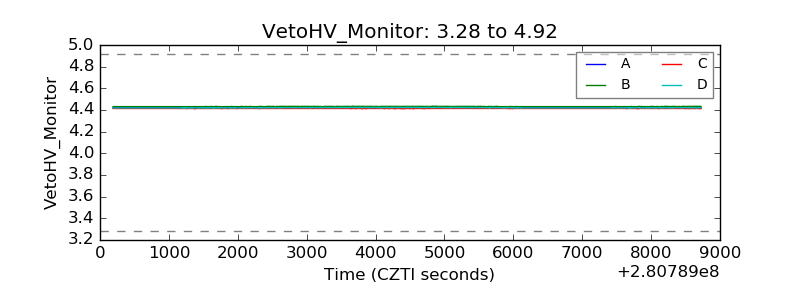 |
| Veto LLD | 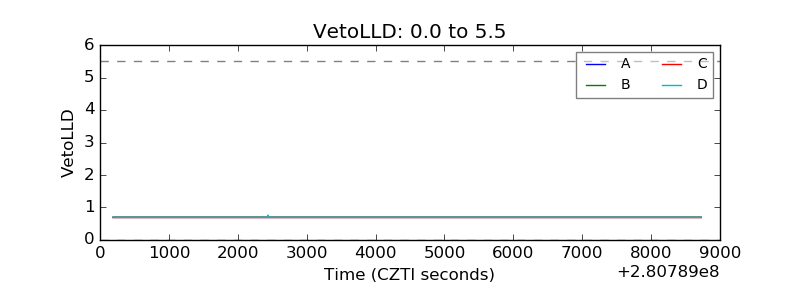 |
| Alpha Counter | 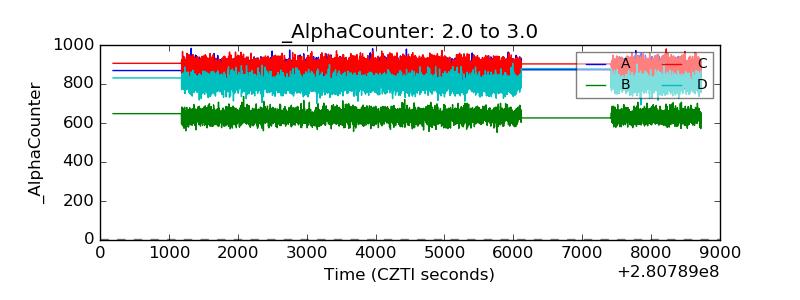 |
| _CPM_Rate | 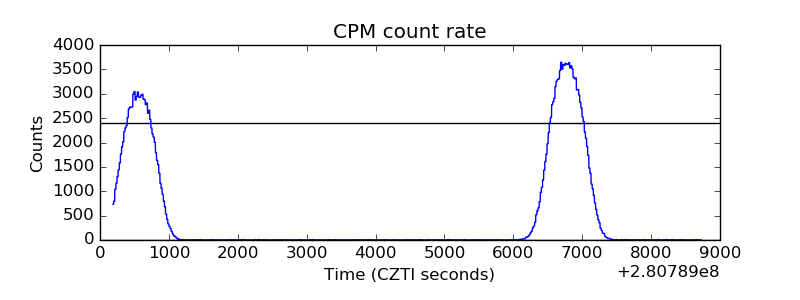 |
| CZT Counter | 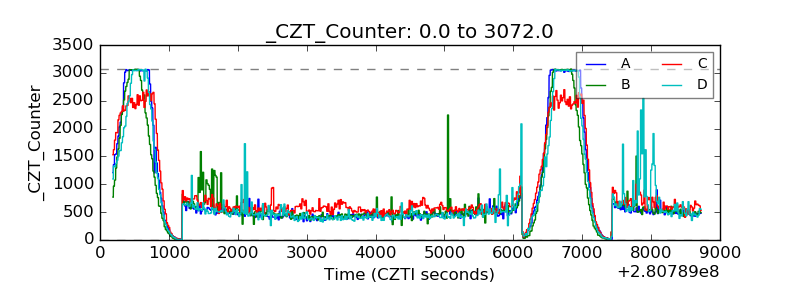 |
| +2.5 Volts monitor | 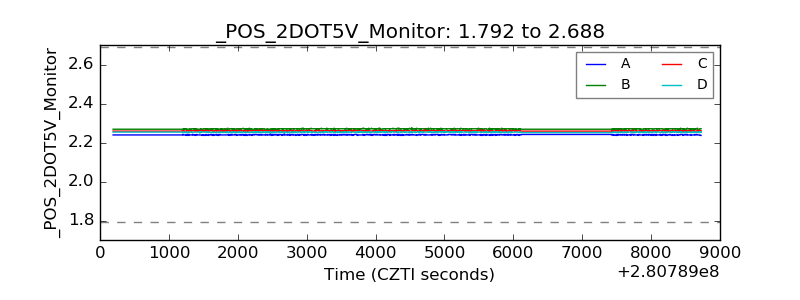 |
| +5 Volts monitor |  |
| _ROLL_ROT | 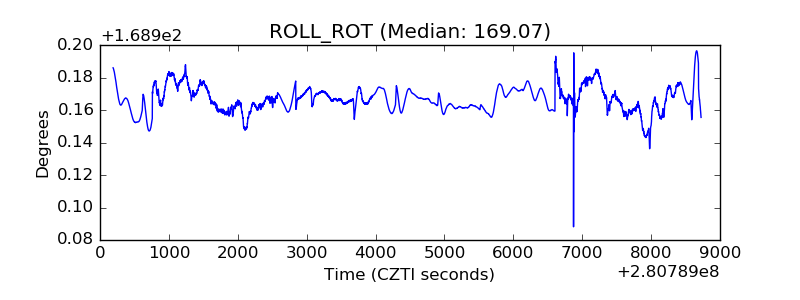 |
| _Roll_DEC | 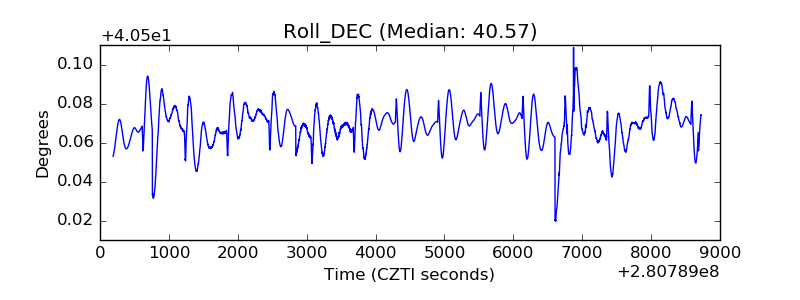 |
| _Roll_RA | 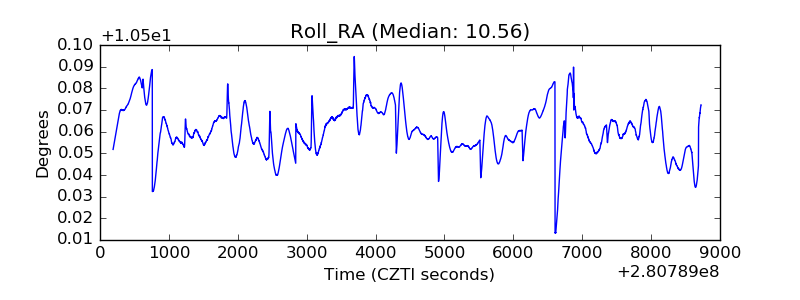 |
| Veto Counter | 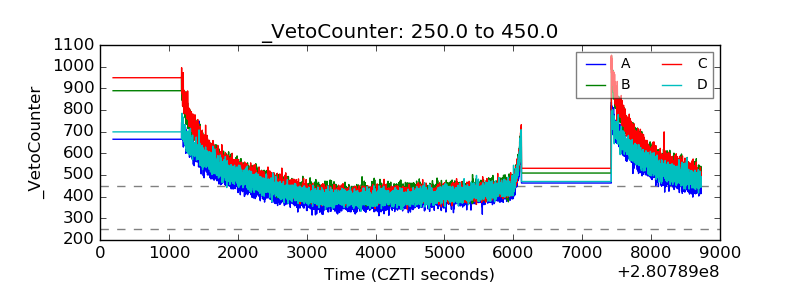 |