| Param | Original file | Final file |
|---|---|---|
| Filename | modeM0/AS1A05_004T04_9000002534_17079cztM0_level2.evt | modeM0/AS1A05_004T04_9000002534_17079cztM0_level2_quad_clean.evt |
| Size (bytes) | 508,328,640 | 93,608,640 |
| Size | 484.8 MB | 89.3 MB |
| Events in quadrant A | 3,054,444 | 621,013 |
| Events in quadrant B | 3,204,853 | 643,160 |
| Events in quadrant C | 4,299,846 | 598,491 |
| Events in quadrant D | 4,416,490 | 540,641 |
| Mode M0 | |||
|---|---|---|---|
| Quadrant | BADHDUFLAG | Total packets | Discarded packets |
| A | 0 | 12931 | 2 |
| B | 0 | 13367 | 2 |
| C | 0 | 16906 | 2 |
| D | 0 | 17401 | 2 |
| Mode SS | |||
|---|---|---|---|
| Quadrant | BADHDUFLAG | Total packets | Discarded packets |
| A | 0 | 126 | 0 |
| B | 0 | 126 | 0 |
| C | 0 | 126 | 0 |
| D | 0 | 126 | 0 |
| Mode M9 | |||
|---|---|---|---|
| Quadrant | BADHDUFLAG | Total packets | Discarded packets |
| A | 0 | 23 | 0 |
| B | 0 | 24 | 0 |
| C | 0 | 24 | 0 |
| D | 0 | 24 | 0 |
| Quadrant | Total seconds | Saturated seconds | Saturation percentage |
|---|---|---|---|
| A | 6180 | 17 | 0.275081% |
| B | 6180 | 31 | 0.501618% |
| C | 6180 | 116 | 1.877023% |
| D | 6180 | 457 | 7.394822% |
Noise dominated data is calculated using 1-second bins in cleaned event files. If a bin has >2000 counts, and if more than 50% of those come from <1% of pixels, then it is considered to be noise-dominated and hence unusable.
| Quadrant | # 1 sec bins | Bins with >0 counts | Bins with >2000 counts | High rate bins dominated by noise | Noise dominated (total time) | Noise dominated (detector-on time) | Marked lightcurve |
|---|---|---|---|---|---|---|---|
| A | 7545 | 6181 | 0 | 0 | 0.00% | 0.00% | 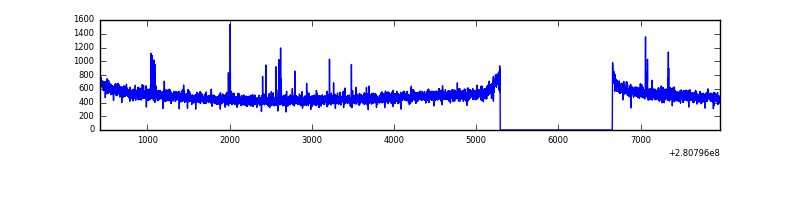 |
| B | 7545 | 6181 | 2 | 2 | 0.03% | 0.03% | 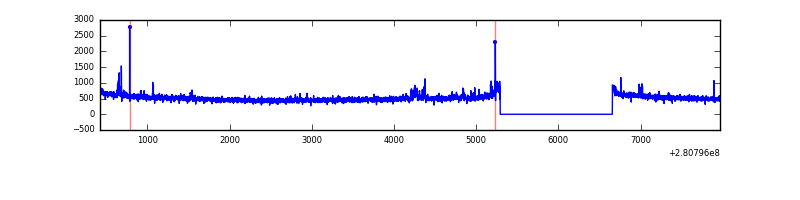 |
| C | 7545 | 6181 | 1 | 1 | 0.01% | 0.02% | 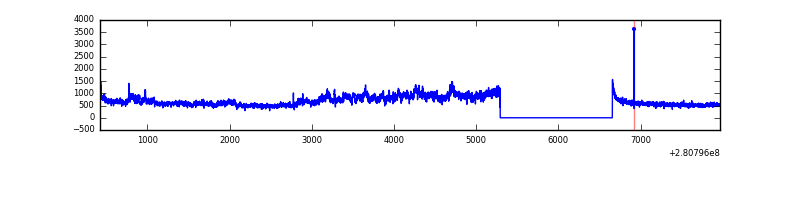 |
| D | 7545 | 6181 | 389 | 389 | 5.16% | 6.29% | 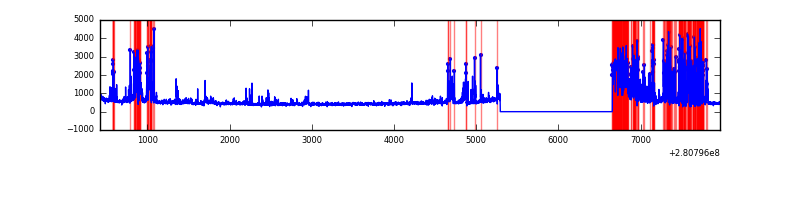 |
Top three noisy pixels from each quadrant. If the there are fewer than three noisy pixels in the level2.evt file, extra rows are filled as -1
| Pixel properties | Quadrant properties | ||||||
|---|---|---|---|---|---|---|---|
| Quadrant | DetID | PixID | Counts | Sigma | Mean | Median | Sigma |
| A | 4 | 2 | 28208 | 174.36 | 787 | 773 | 157.3 |
| A | 0 | 226 | 6975 | 39.42 | 787 | 773 | 157.3 |
| A | 12 | 194 | 5676 | 31.16 | 787 | 773 | 157.3 |
| B | 0 | 189 | 41134 | 272.57 | 799 | 779 | 148.1 |
| B | 12 | 111 | 16793 | 108.16 | 799 | 779 | 148.1 |
| B | 0 | 197 | 16074 | 103.31 | 799 | 779 | 148.1 |
| C | 3 | 233 | 1190684 | 6749.19 | 763 | 769 | 176.3 |
| C | 14 | 238 | 120293 | 677.94 | 763 | 769 | 176.3 |
| C | 7 | 247 | 8492 | 43.8 | 763 | 769 | 176.3 |
| D | 5 | 222 | 1344438 | 7604.51 | 732 | 713 | 176.7 |
| D | 10 | 70 | 271984 | 1535.2 | 732 | 713 | 176.7 |
| D | 2 | 234 | 22096 | 121.01 | 732 | 713 | 176.7 |
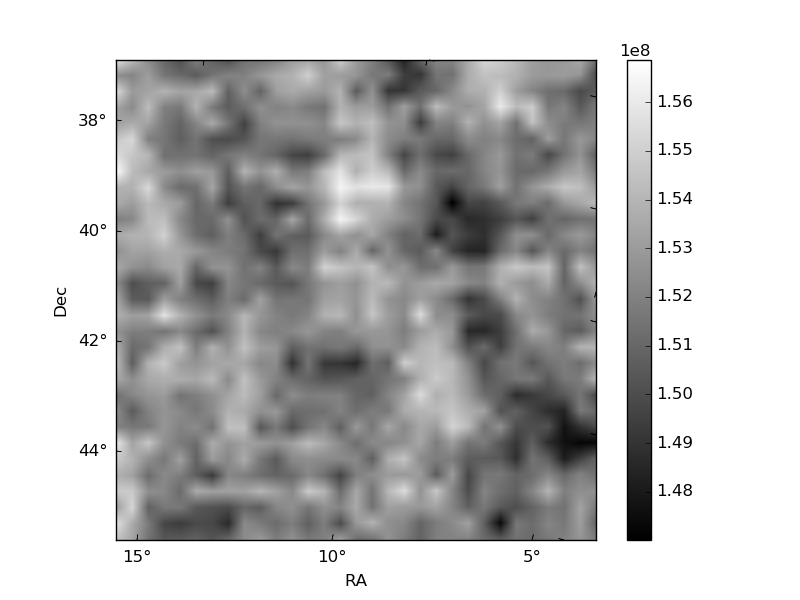
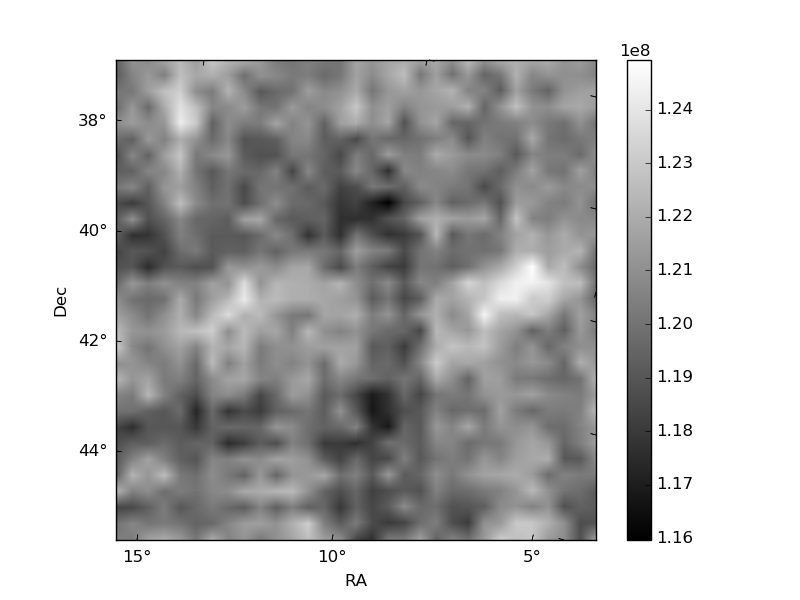
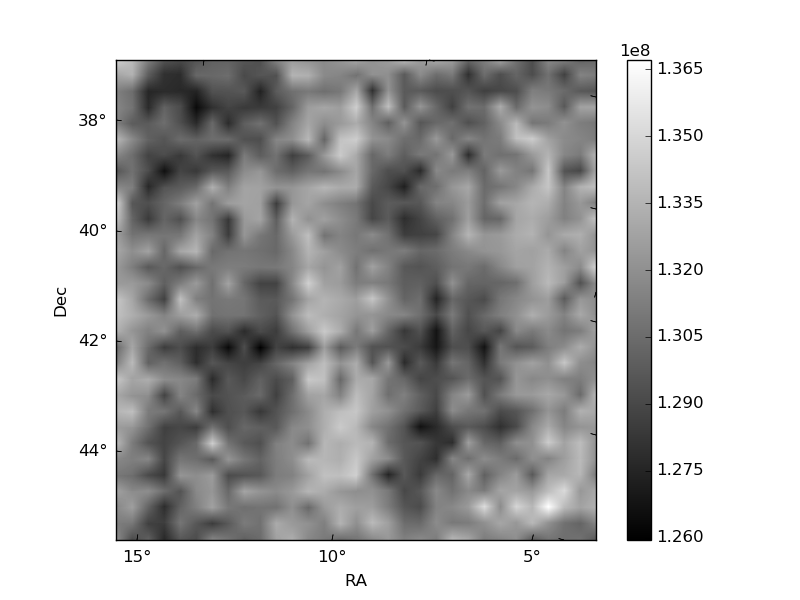
Histogram calculated using DETX and DETY for each event in the final _common_clean file
| Quadrant A | 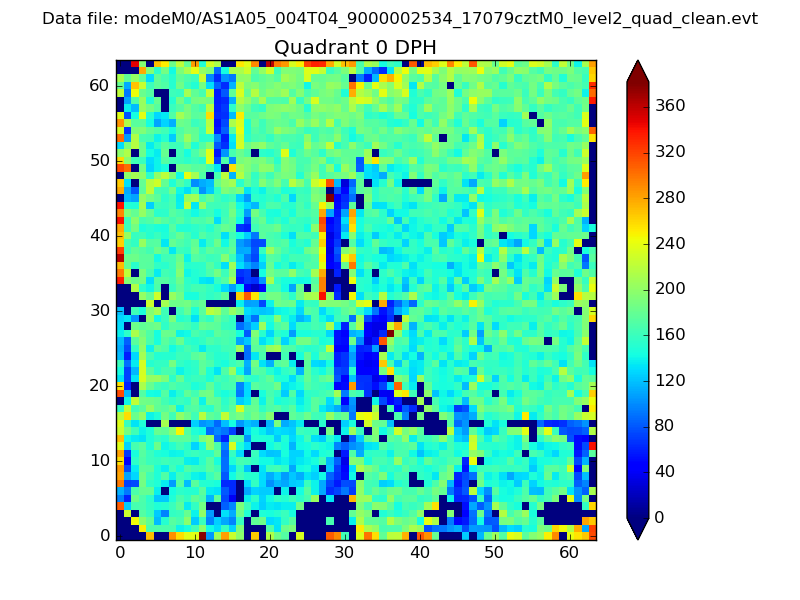 |
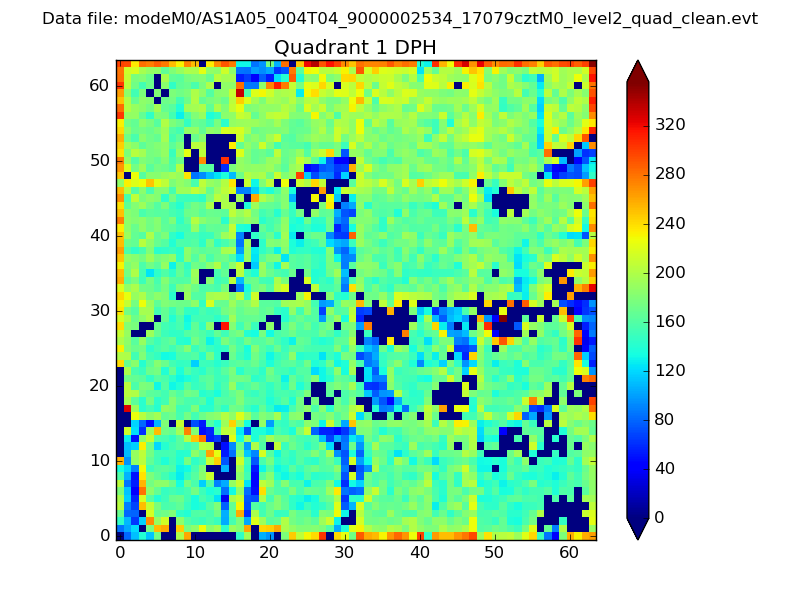 |
Quadrant B |
|---|---|---|---|
| Quadrant D | 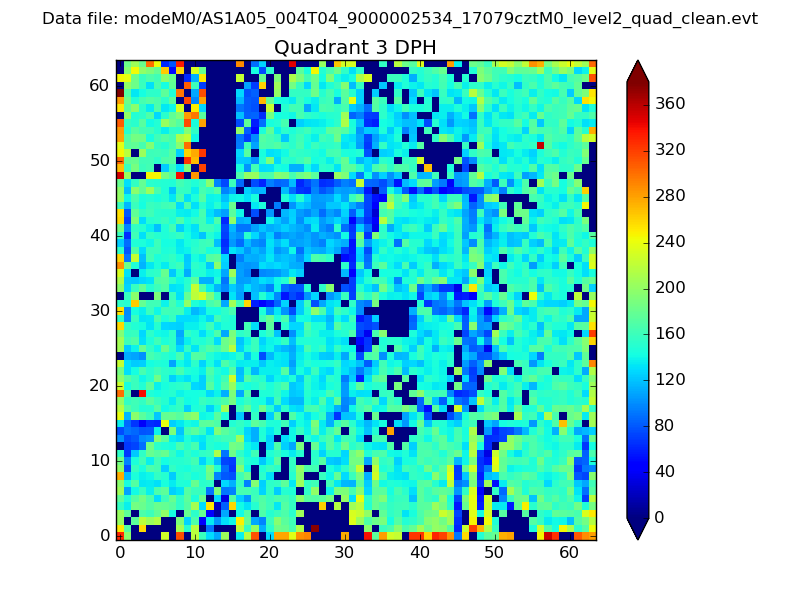 |
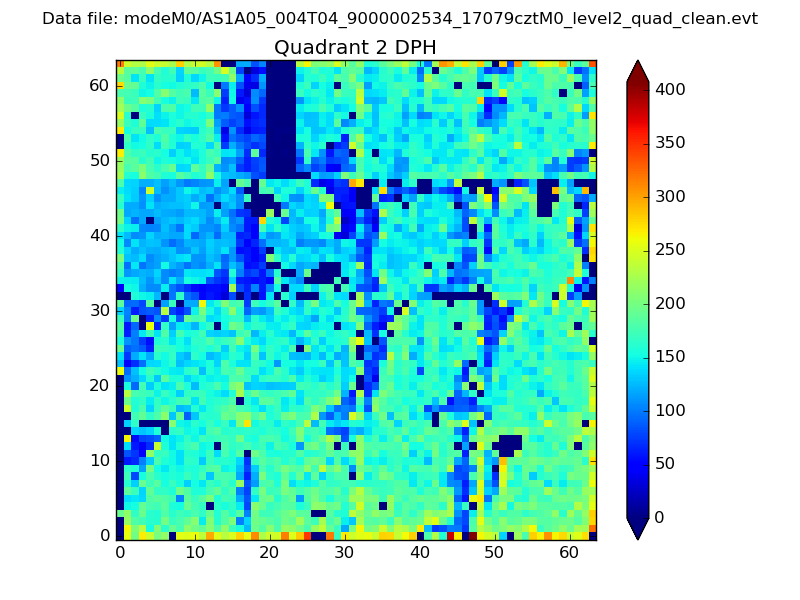 |
Quadrant C |
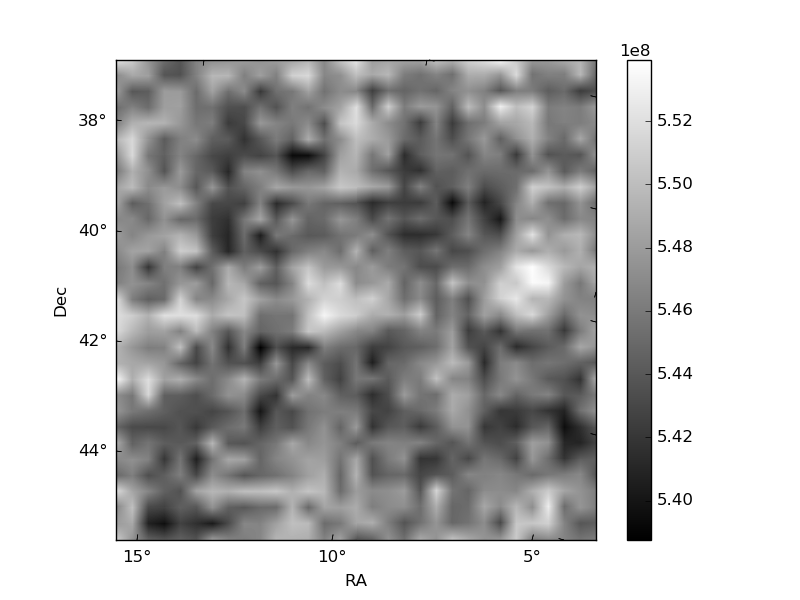
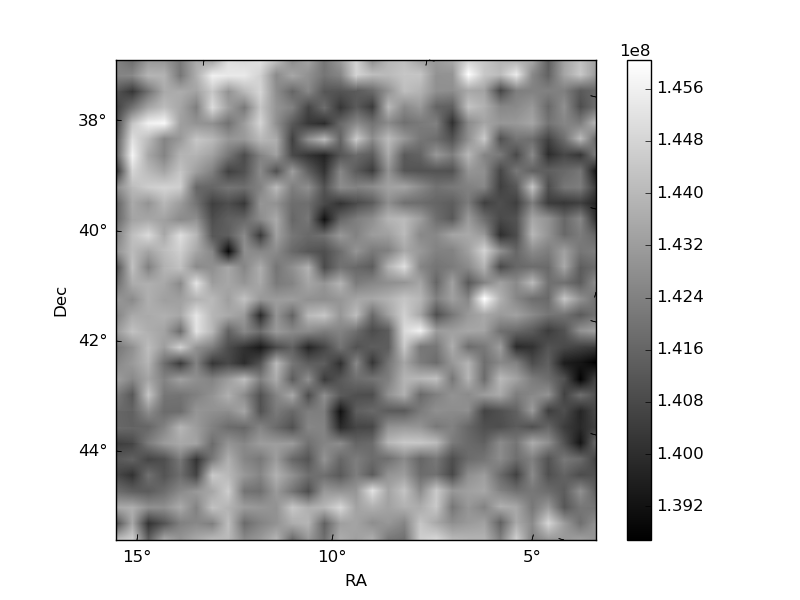
| Plot type | Count rate plots | Images |
|---|---|---|
| Comparison with Poisson distribution Blue bars denote a histogram of data divided into 1 sec bins. Red curve is a Poisson curve with rate = median count rate of data. |
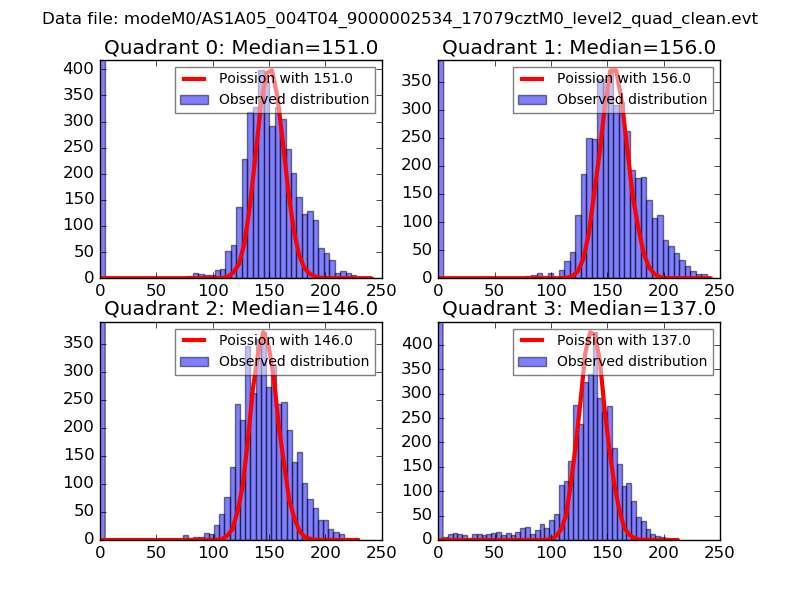 |
 |
| Quadrant-wise count rates Data is divided into 100 sec bins |
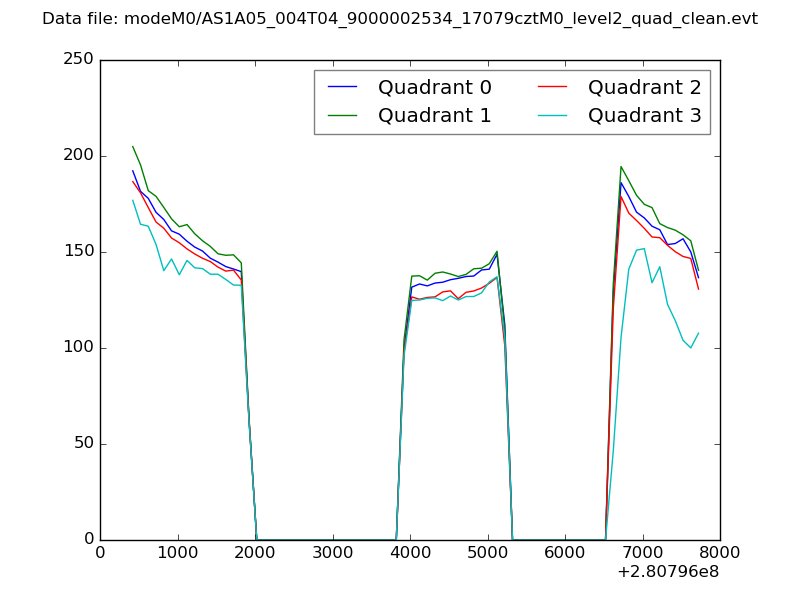 |
|
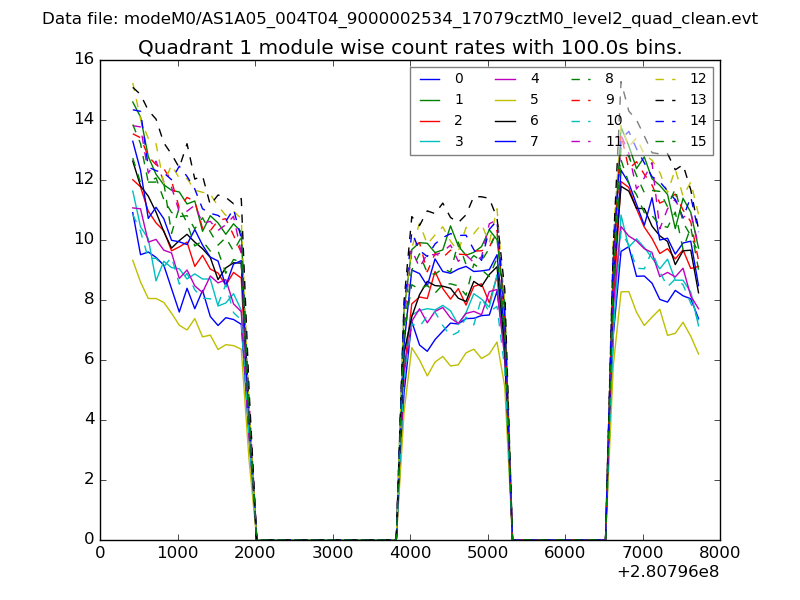
| Module-wise count rates for Quadrant A Data is divided into 100 sec bins |
 |
 |
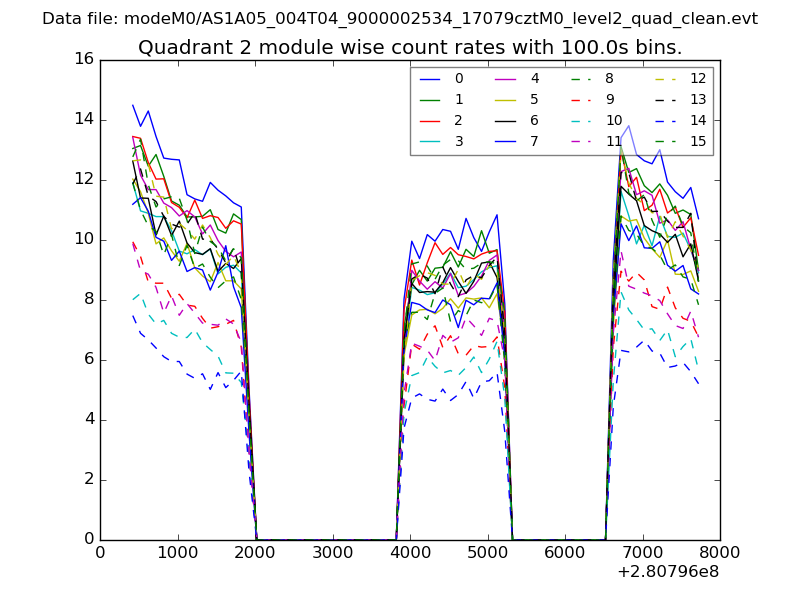
| Module-wise count rates for Quadrant B Data is divided into 100 sec bins |
 |
 |
| Module-wise count rates for Quadrant C Data is divided into 100 sec bins |
 |
 |
| Module-wise count rates for Quadrant D Data is divided into 100 sec bins |
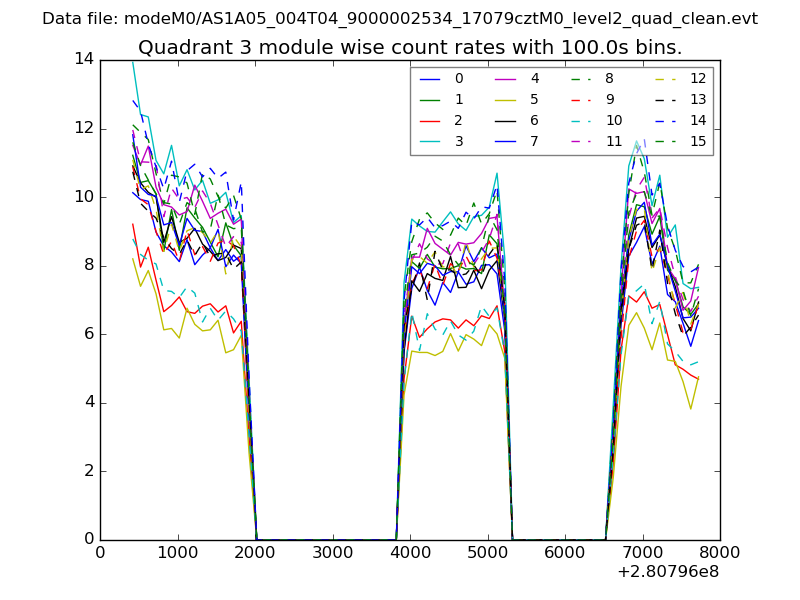 |
 |
| Parameter | Plot |
|---|---|
| CZT HV Monitor | 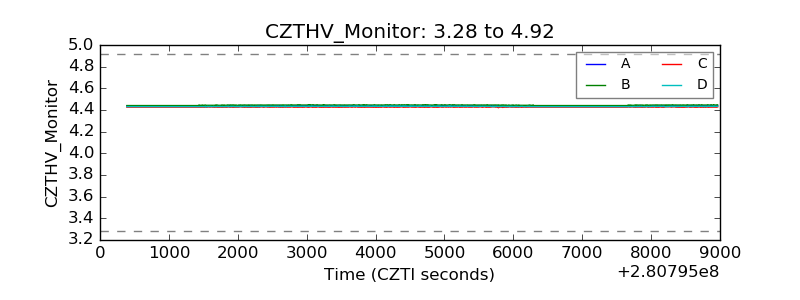 |
| D_VDD | 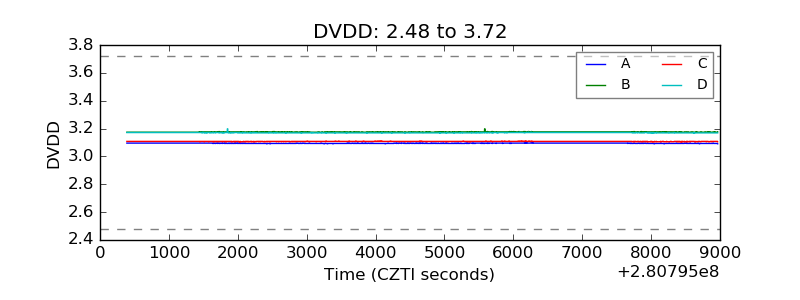 |
| Temperature 1 |  |
| Veto HV Monitor | 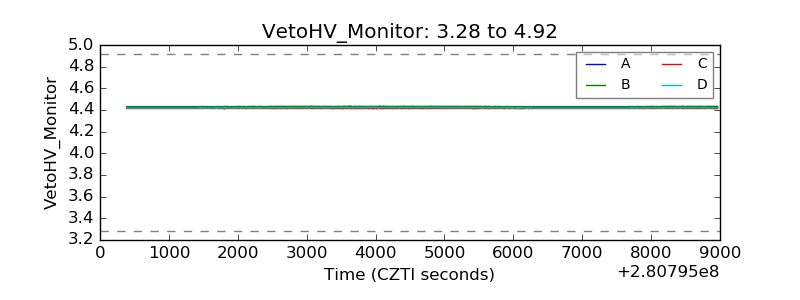 |
| Veto LLD | 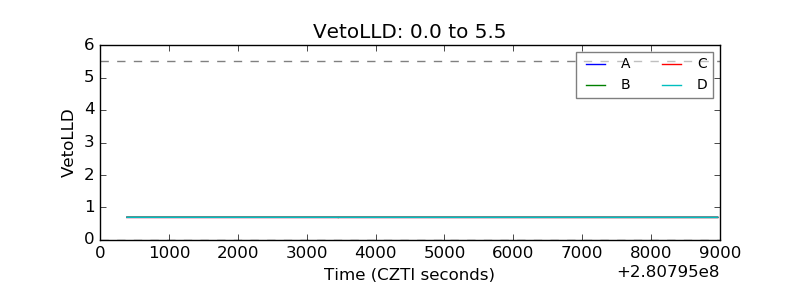 |
| Alpha Counter | 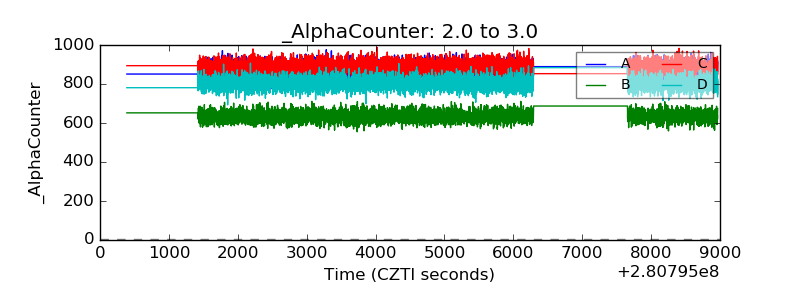 |
| _CPM_Rate | 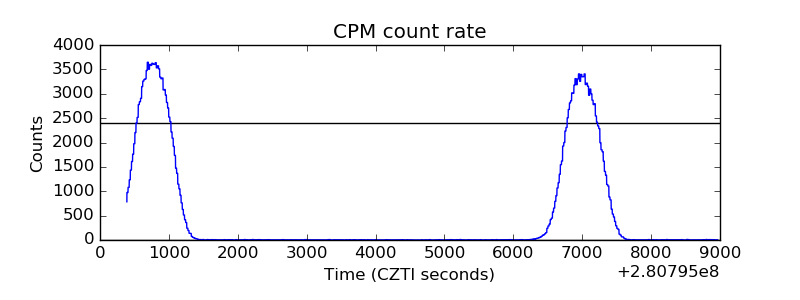 |
| CZT Counter | 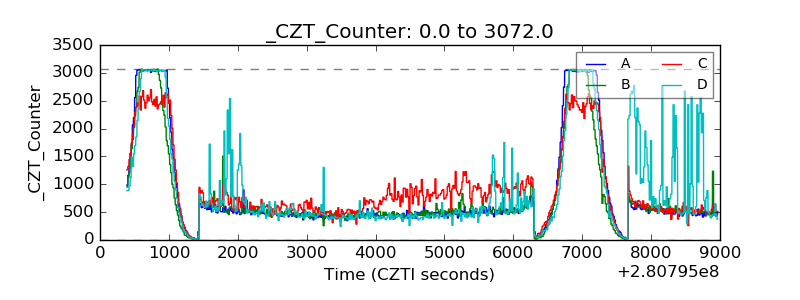 |
| +2.5 Volts monitor |  |
| +5 Volts monitor |  |
| _ROLL_ROT | 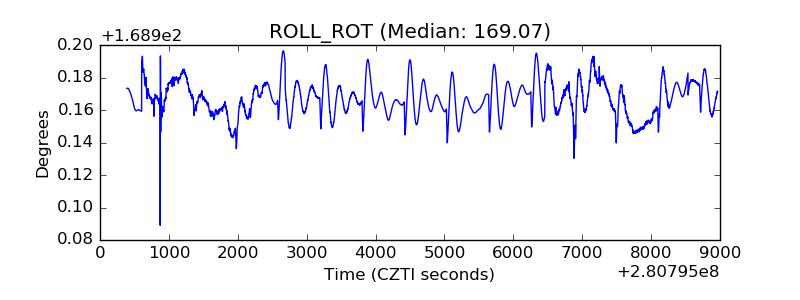 |
| _Roll_DEC | 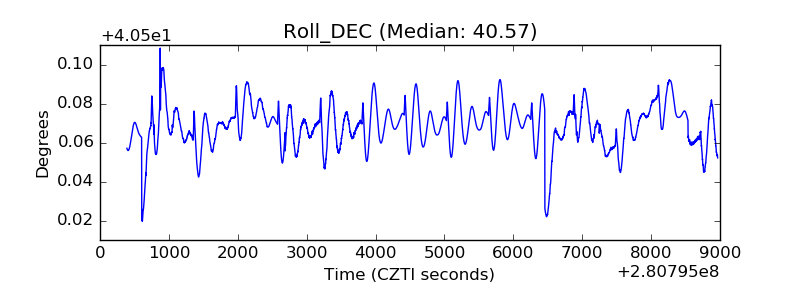 |
| _Roll_RA |  |
| Veto Counter |  |