| Param | Original file | Final file |
|---|---|---|
| Filename | modeM0/AS1A05_004T04_9000002534_17080cztM0_level2.evt | modeM0/AS1A05_004T04_9000002534_17080cztM0_level2_quad_clean.evt |
| Size (bytes) | 467,360,640 | 84,211,200 |
| Size | 445.7 MB | 80.3 MB |
| Events in quadrant A | 2,994,853 | 551,213 |
| Events in quadrant B | 3,264,326 | 568,307 |
| Events in quadrant C | 3,413,424 | 530,753 |
| Events in quadrant D | 4,069,264 | 475,957 |
| Mode M0 | |||
|---|---|---|---|
| Quadrant | BADHDUFLAG | Total packets | Discarded packets |
| A | 0 | 12633 | 2 |
| B | 0 | 13439 | 3 |
| C | 0 | 13862 | 2 |
| D | 0 | 16260 | 2 |
| Mode SS | |||
|---|---|---|---|
| Quadrant | BADHDUFLAG | Total packets | Discarded packets |
| A | 0 | 124 | 0 |
| B | 0 | 124 | 0 |
| C | 0 | 124 | 0 |
| D | 0 | 124 | 0 |
| Mode M9 | |||
|---|---|---|---|
| Quadrant | BADHDUFLAG | Total packets | Discarded packets |
| A | 0 | 15 | 0 |
| B | 0 | 16 | 0 |
| C | 0 | 16 | 0 |
| D | 0 | 16 | 0 |
| Quadrant | Total seconds | Saturated seconds | Saturation percentage |
|---|---|---|---|
| A | 6075 | 30 | 0.493827% |
| B | 6074 | 51 | 0.839644% |
| C | 6074 | 82 | 1.350016% |
| D | 6074 | 425 | 6.997037% |
Noise dominated data is calculated using 1-second bins in cleaned event files. If a bin has >2000 counts, and if more than 50% of those come from <1% of pixels, then it is considered to be noise-dominated and hence unusable.
| Quadrant | # 1 sec bins | Bins with >0 counts | Bins with >2000 counts | High rate bins dominated by noise | Noise dominated (total time) | Noise dominated (detector-on time) | Marked lightcurve |
|---|---|---|---|---|---|---|---|
| A | 7470 | 6077 | 0 | 0 | 0.00% | 0.00% | 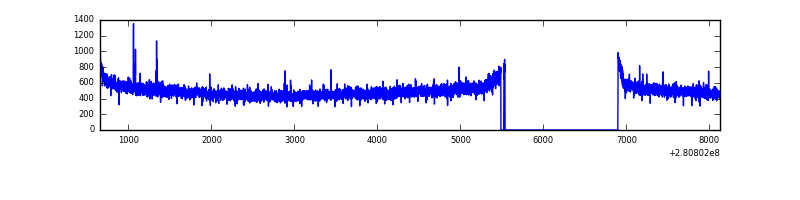 |
| B | 7469 | 6075 | 2 | 2 | 0.03% | 0.03% | 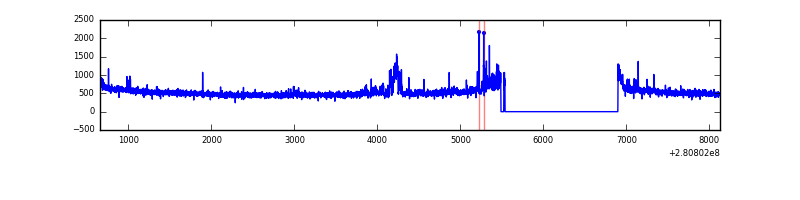 |
| C | 7469 | 6075 | 1 | 1 | 0.01% | 0.02% | 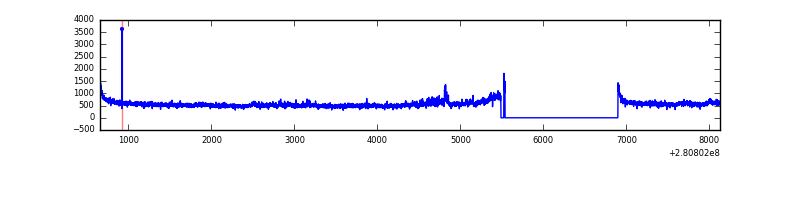 |
| D | 7469 | 6076 | 352 | 352 | 4.71% | 5.79% | 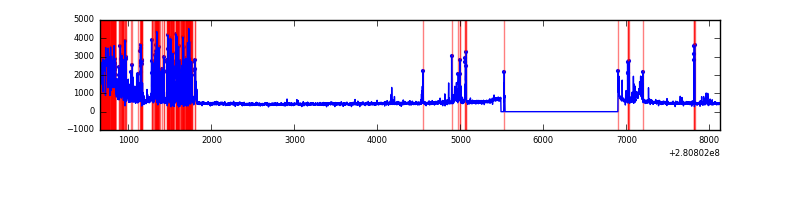 |
Top three noisy pixels from each quadrant. If the there are fewer than three noisy pixels in the level2.evt file, extra rows are filled as -1
| Pixel properties | Quadrant properties | ||||||
|---|---|---|---|---|---|---|---|
| Quadrant | DetID | PixID | Counts | Sigma | Mean | Median | Sigma |
| A | 4 | 2 | 8107 | 47.6 | 776 | 763 | 154.3 |
| A | 0 | 226 | 6722 | 38.62 | 776 | 763 | 154.3 |
| A | 12 | 194 | 5527 | 30.88 | 776 | 763 | 154.3 |
| B | 0 | 189 | 125555 | 860.05 | 784 | 765 | 145.1 |
| B | 7 | 220 | 32431 | 218.24 | 784 | 765 | 145.1 |
| B | 0 | 219 | 16879 | 111.06 | 784 | 765 | 145.1 |
| C | 3 | 233 | 362593 | 2083.84 | 748 | 753 | 173.6 |
| C | 14 | 238 | 119009 | 681.04 | 748 | 753 | 173.6 |
| C | 7 | 247 | 9427 | 49.95 | 748 | 753 | 173.6 |
| D | 5 | 222 | 972944 | 5610.89 | 718 | 697 | 173.3 |
| D | 10 | 70 | 261971 | 1507.83 | 718 | 697 | 173.3 |
| D | 12 | 144 | 40653 | 230.59 | 718 | 697 | 173.3 |
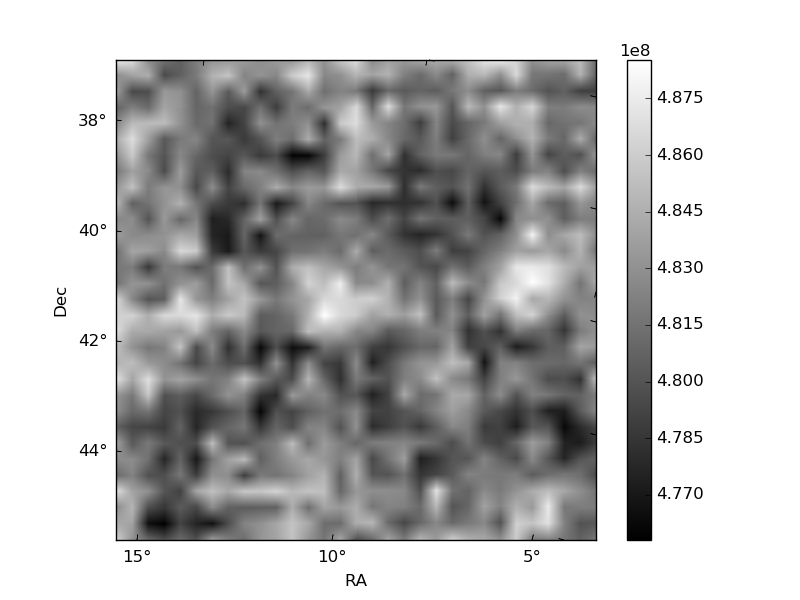
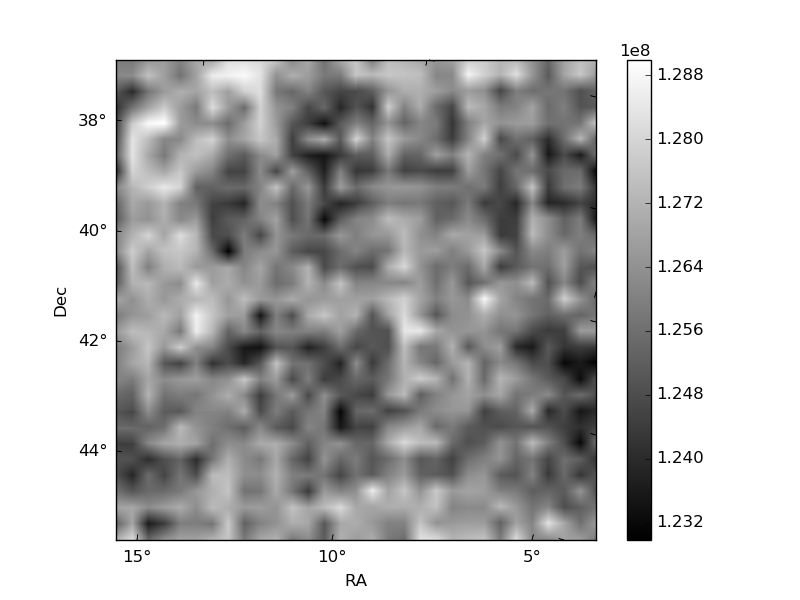
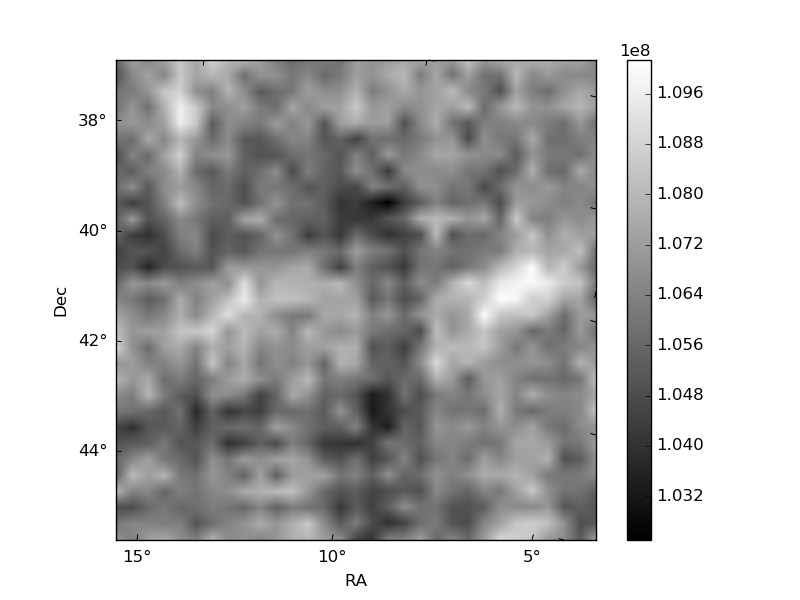
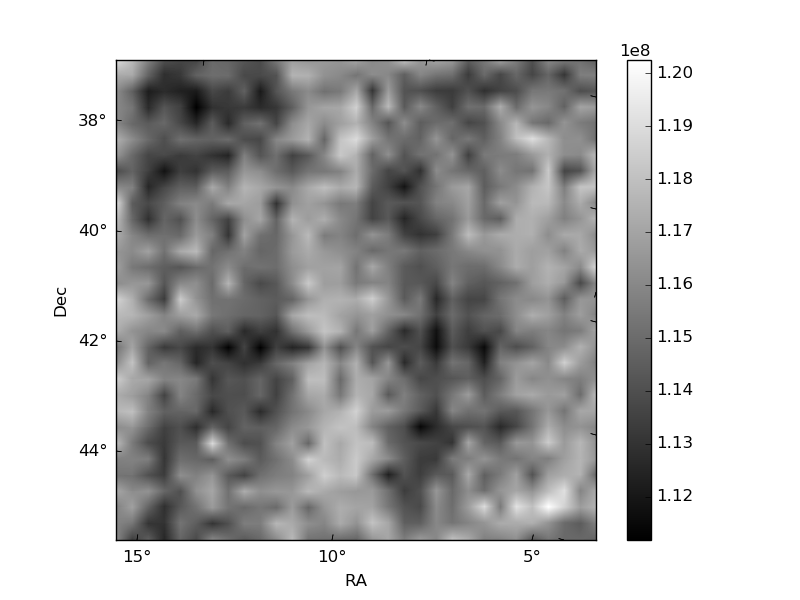
Histogram calculated using DETX and DETY for each event in the final _common_clean file
| Quadrant A | 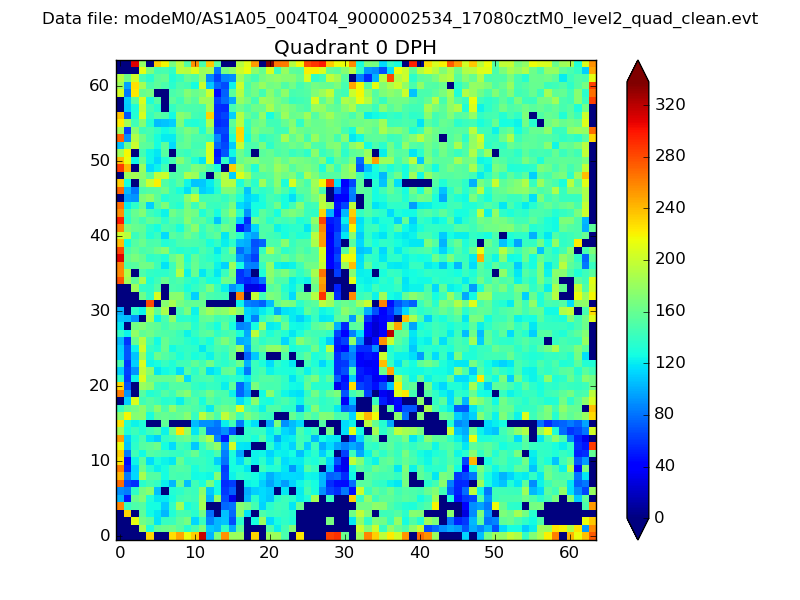 |
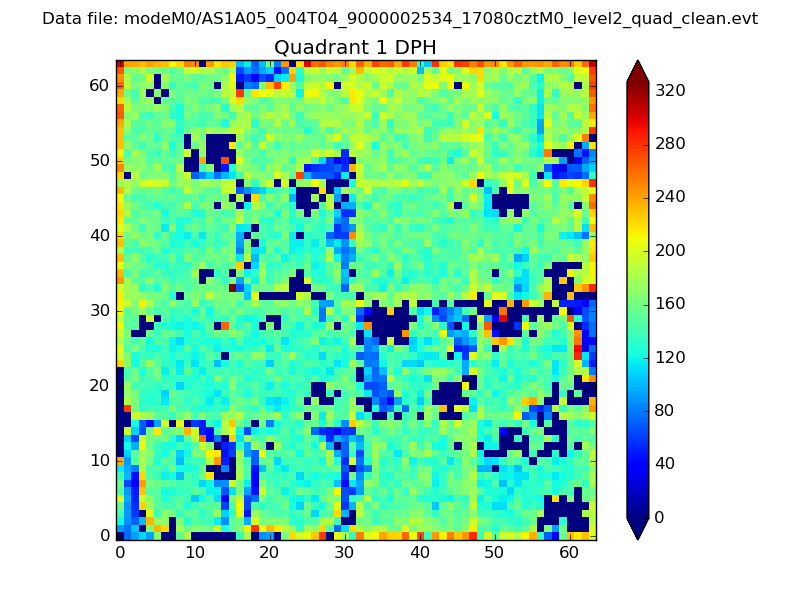 |
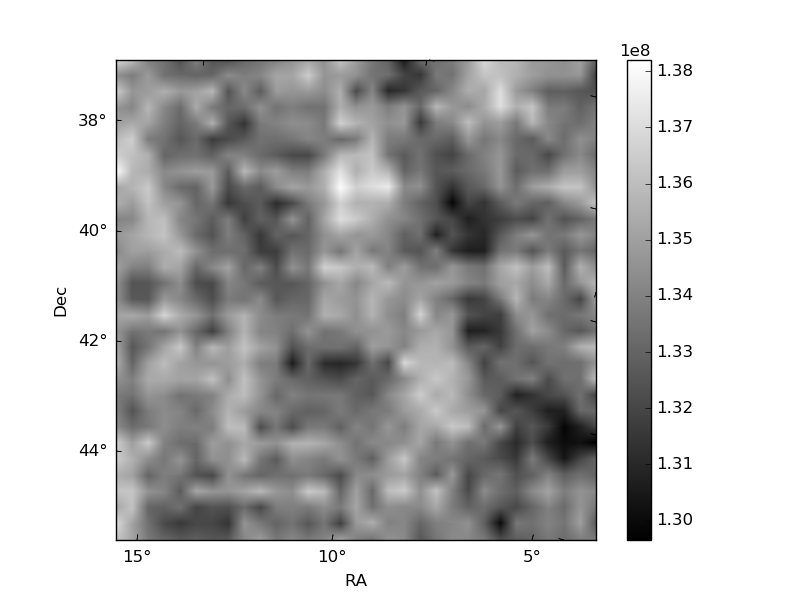
Quadrant B |
|---|---|---|---|
| Quadrant D | 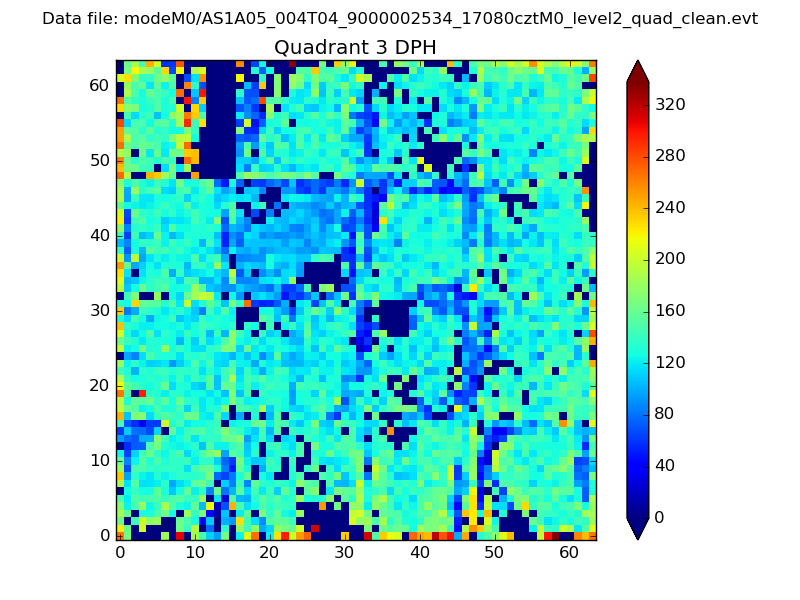 |
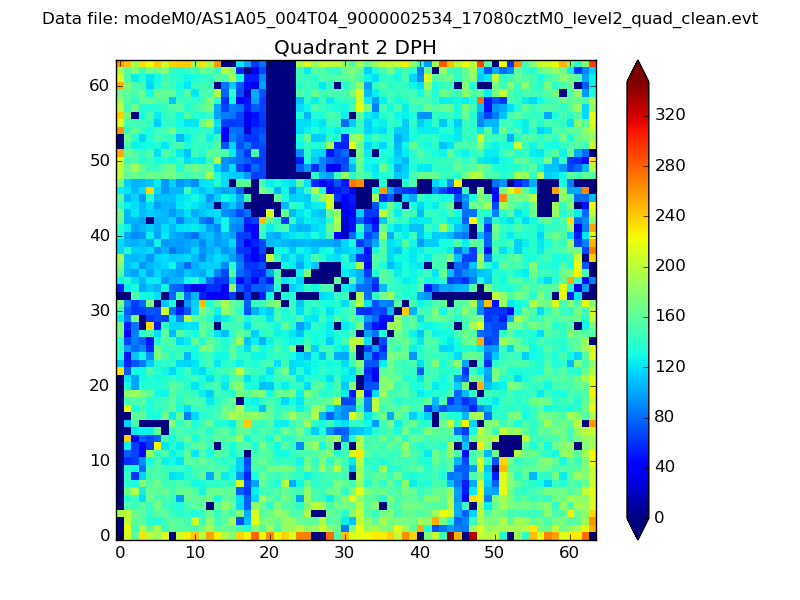 |
Quadrant C |
| Plot type | Count rate plots | Images |
|---|---|---|
| Comparison with Poisson distribution Blue bars denote a histogram of data divided into 1 sec bins. Red curve is a Poisson curve with rate = median count rate of data. |
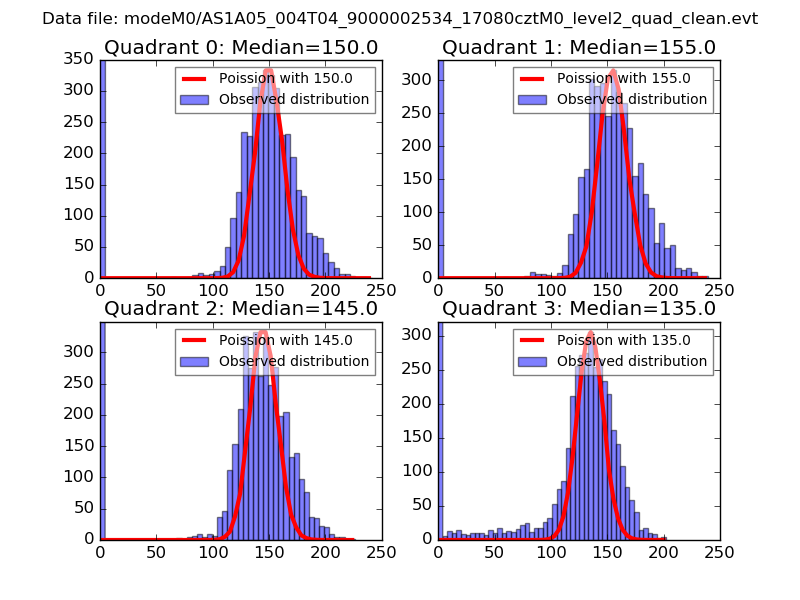 |
 |
| Quadrant-wise count rates Data is divided into 100 sec bins |
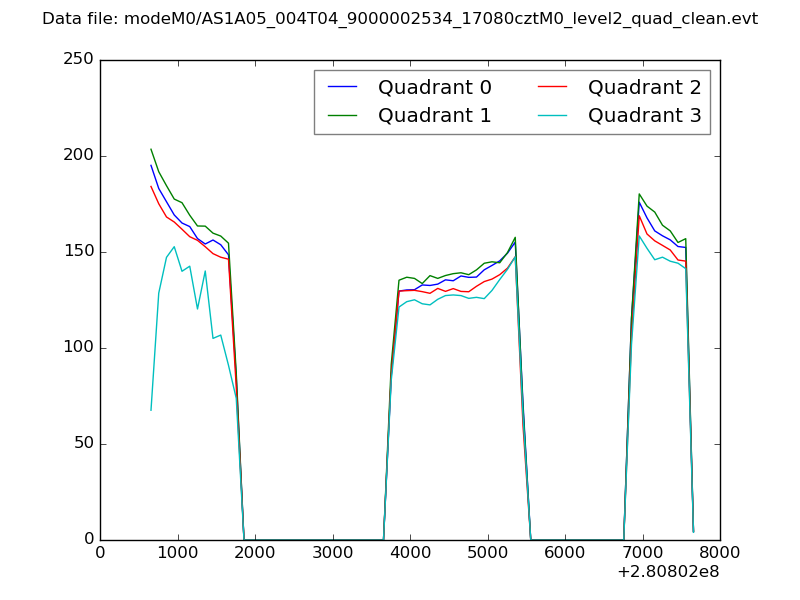 |
|
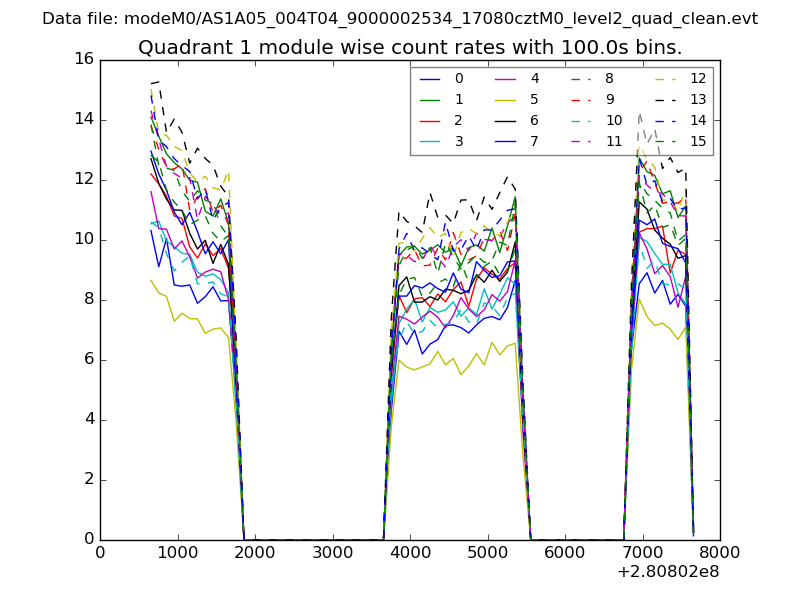
| Module-wise count rates for Quadrant A Data is divided into 100 sec bins |
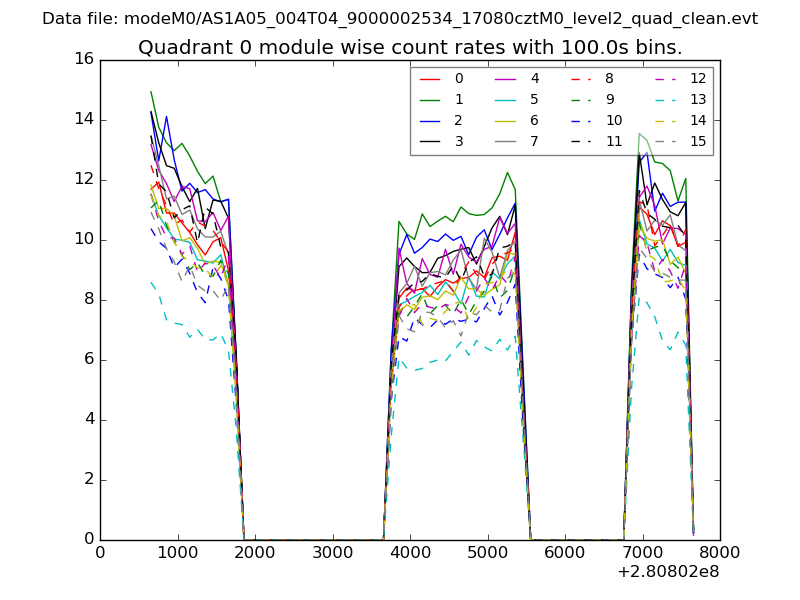 |
 |
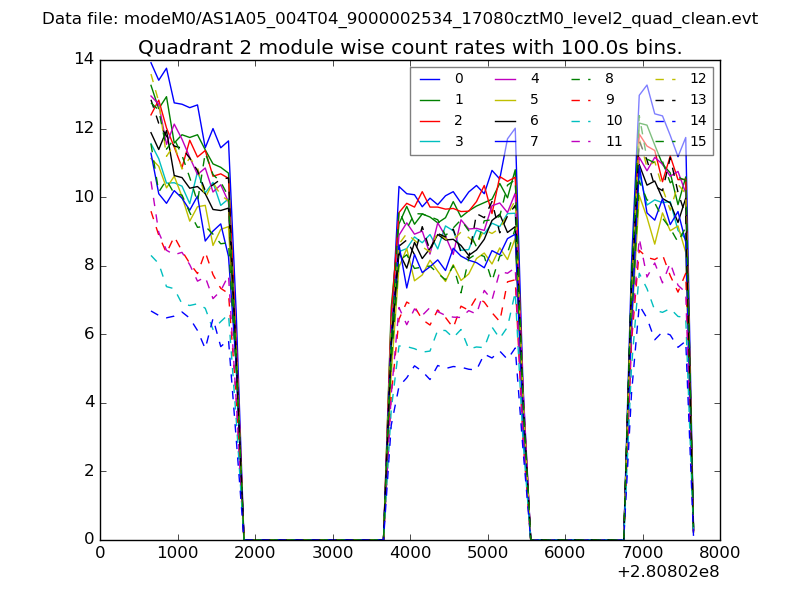
| Module-wise count rates for Quadrant B Data is divided into 100 sec bins |
 |
 |
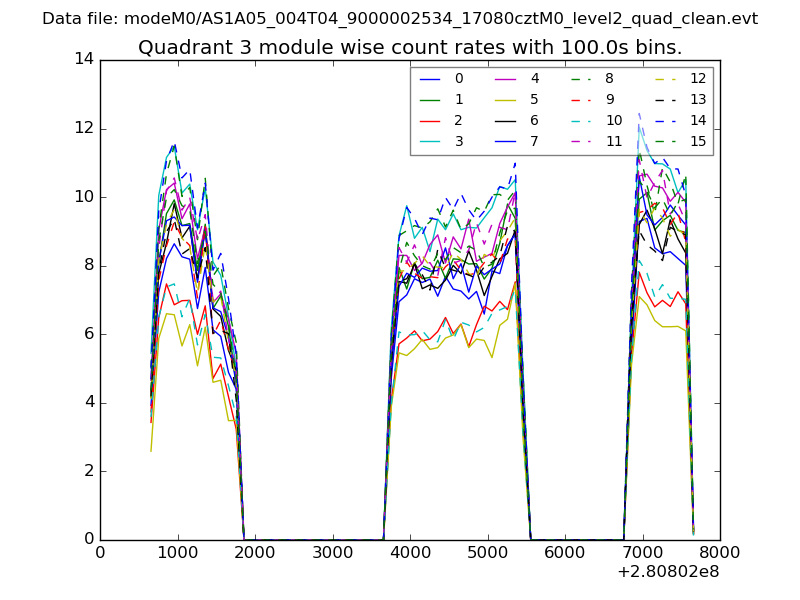
| Module-wise count rates for Quadrant C Data is divided into 100 sec bins |
 |
 |
| Module-wise count rates for Quadrant D Data is divided into 100 sec bins |
 |
 |
| Parameter | Plot |
|---|---|
| CZT HV Monitor | 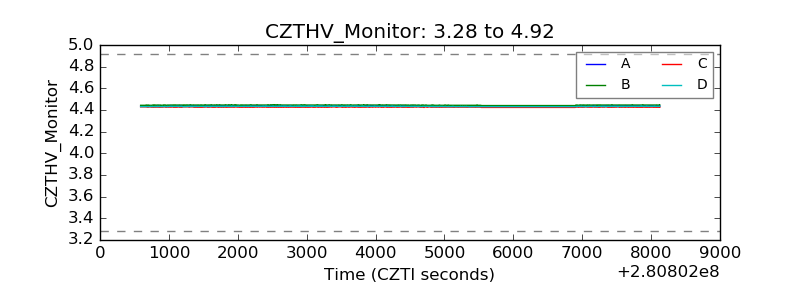 |
| D_VDD | 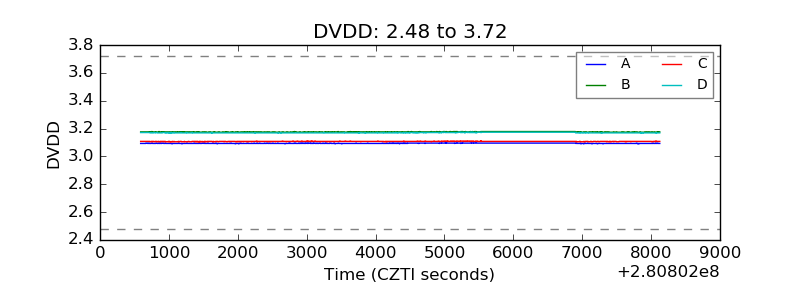 |
| Temperature 1 | 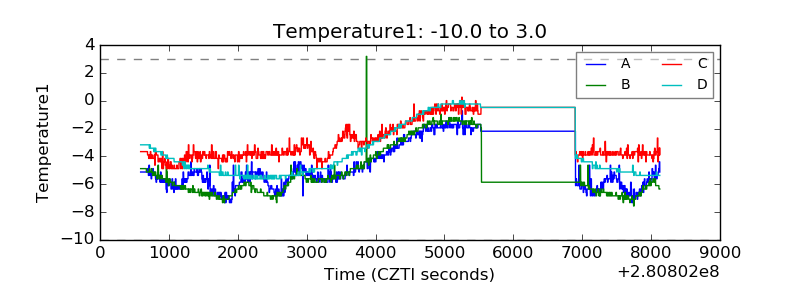 |
| Veto HV Monitor | 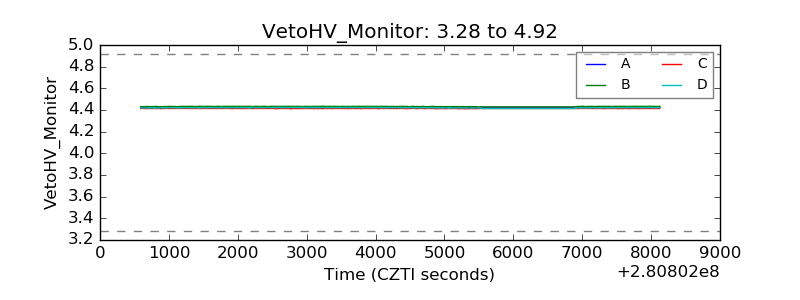 |
| Veto LLD | 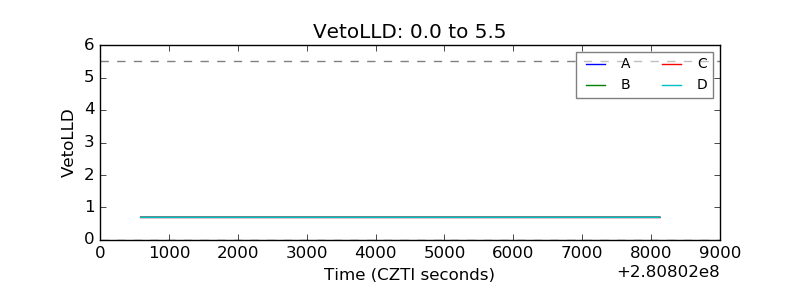 |
| Alpha Counter | 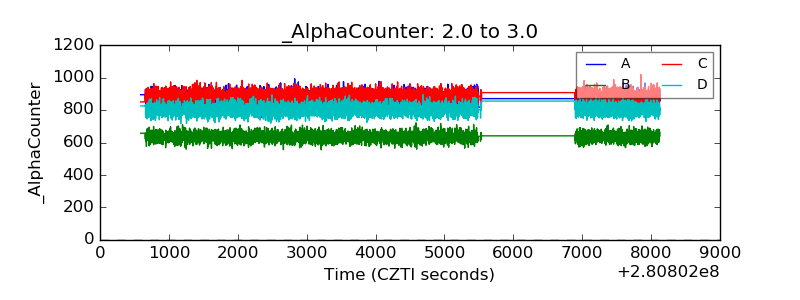 |
| _CPM_Rate | 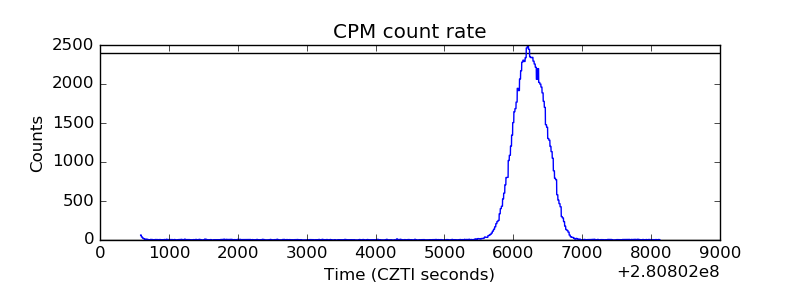 |
| CZT Counter | 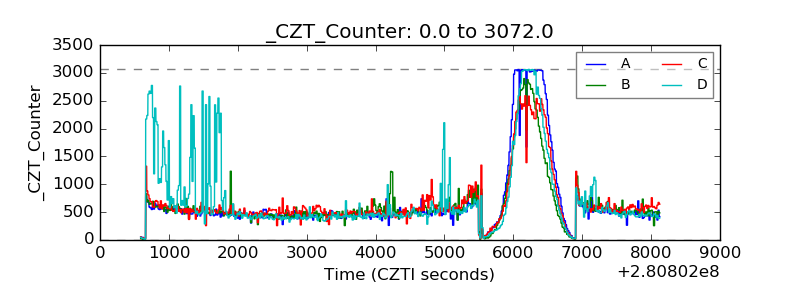 |
| +2.5 Volts monitor | 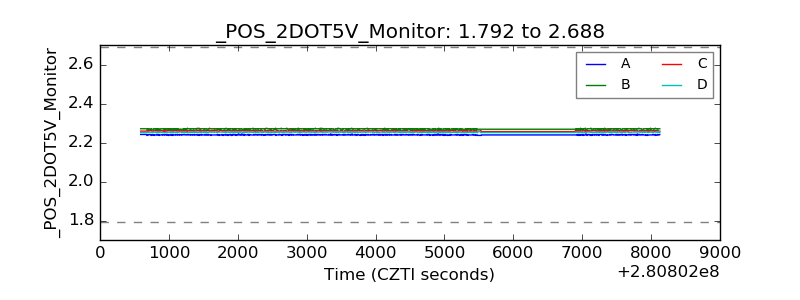 |
| +5 Volts monitor |  |
| _ROLL_ROT | 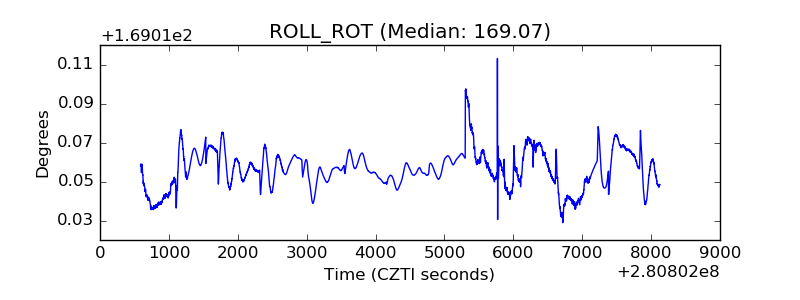 |
| _Roll_DEC | 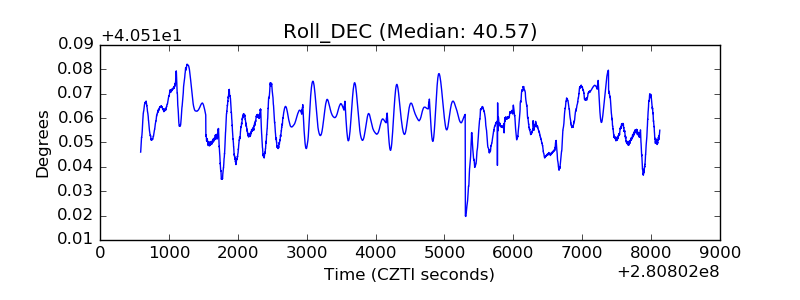 |
| _Roll_RA | 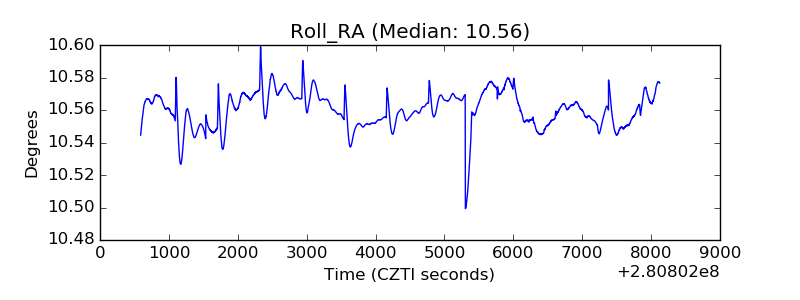 |
| Veto Counter | 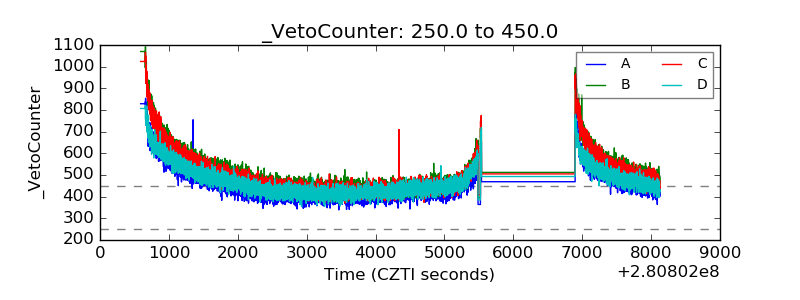 |