| Param | Original file | Final file |
|---|---|---|
| Filename | modeM0/AS1A05_004T04_9000002534_17082cztM0_level2.evt | modeM0/AS1A05_004T04_9000002534_17082cztM0_level2_quad_clean.evt |
| Size (bytes) | 499,677,120 | 68,685,120 |
| Size | 476.5 MB | 65.5 MB |
| Events in quadrant A | 3,143,456 | 414,145 |
| Events in quadrant B | 3,346,698 | 419,614 |
| Events in quadrant C | 5,062,476 | 392,287 |
| Events in quadrant D | 3,127,460 | 388,380 |
| Mode M0 | |||
|---|---|---|---|
| Quadrant | BADHDUFLAG | Total packets | Discarded packets |
| A | 0 | 13642 | 2 |
| B | 0 | 14133 | 2 |
| C | 0 | 19693 | 2 |
| D | 0 | 13967 | 2 |
| Mode SS | |||
|---|---|---|---|
| Quadrant | BADHDUFLAG | Total packets | Discarded packets |
| A | 0 | 136 | 0 |
| B | 0 | 136 | 0 |
| C | 0 | 136 | 0 |
| D | 0 | 136 | 0 |
| Mode M9 | |||
|---|---|---|---|
| Quadrant | BADHDUFLAG | Total packets | Discarded packets |
| A | 0 | 9 | 0 |
| B | 0 | 9 | 0 |
| C | 0 | 9 | 0 |
| D | 0 | 9 | 0 |
| Quadrant | Total seconds | Saturated seconds | Saturation percentage |
|---|---|---|---|
| A | 6669 | 71 | 1.064627% |
| B | 6670 | 83 | 1.244378% |
| C | 6670 | 143 | 2.143928% |
| D | 6670 | 81 | 1.214393% |
Noise dominated data is calculated using 1-second bins in cleaned event files. If a bin has >2000 counts, and if more than 50% of those come from <1% of pixels, then it is considered to be noise-dominated and hence unusable.
| Quadrant | # 1 sec bins | Bins with >0 counts | Bins with >2000 counts | High rate bins dominated by noise | Noise dominated (total time) | Noise dominated (detector-on time) | Marked lightcurve |
|---|---|---|---|---|---|---|---|
| A | 7634 | 6670 | 0 | 0 | 0.00% | 0.00% | 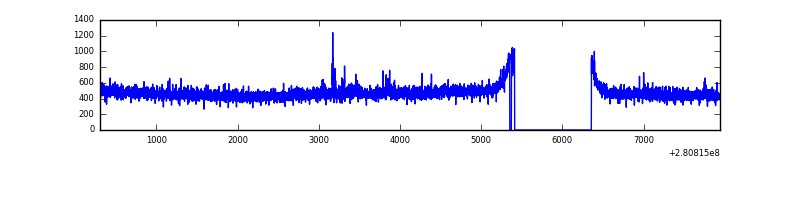 |
| B | 7635 | 6671 | 2 | 2 | 0.03% | 0.03% | 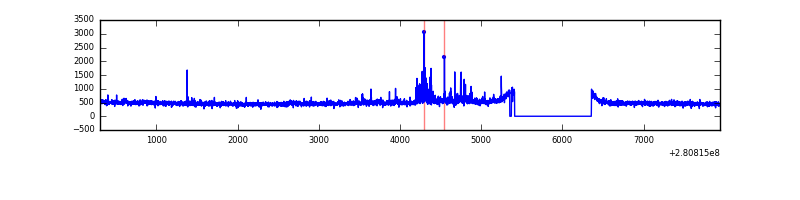 |
| C | 7635 | 6672 | 0 | 0 | 0.00% | 0.00% | 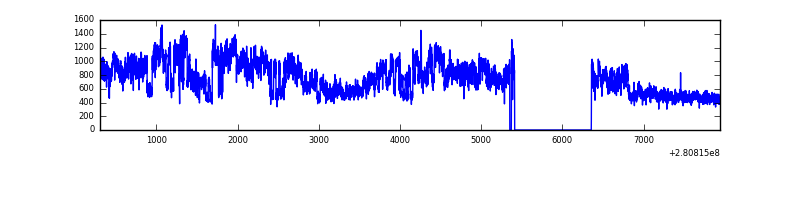 |
| D | 7635 | 6672 | 17 | 17 | 0.22% | 0.25% | 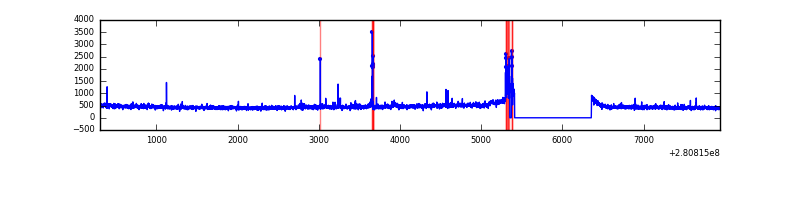 |
Top three noisy pixels from each quadrant. If the there are fewer than three noisy pixels in the level2.evt file, extra rows are filled as -1
| Pixel properties | Quadrant properties | ||||||
|---|---|---|---|---|---|---|---|
| Quadrant | DetID | PixID | Counts | Sigma | Mean | Median | Sigma |
| A | 12 | 189 | 22371 | 131.86 | 809 | 791 | 163.7 |
| A | 4 | 2 | 10964 | 62.16 | 809 | 791 | 163.7 |
| A | 0 | 226 | 7075 | 38.4 | 809 | 791 | 163.7 |
| B | 0 | 197 | 93368 | 596.56 | 814 | 792 | 155.2 |
| B | 3 | 209 | 18462 | 113.87 | 814 | 792 | 155.2 |
| B | 12 | 111 | 18213 | 112.26 | 814 | 792 | 155.2 |
| C | 3 | 233 | 1904715 | 10633.39 | 773 | 780 | 179.1 |
| C | 14 | 238 | 119553 | 663.34 | 773 | 780 | 179.1 |
| C | 7 | 247 | 23280 | 125.66 | 773 | 780 | 179.1 |
| D | 10 | 70 | 80215 | 417.9 | 779 | 754 | 190.1 |
| D | 1 | 52 | 80175 | 417.69 | 779 | 754 | 190.1 |
| D | 2 | 234 | 24989 | 127.46 | 779 | 754 | 190.1 |
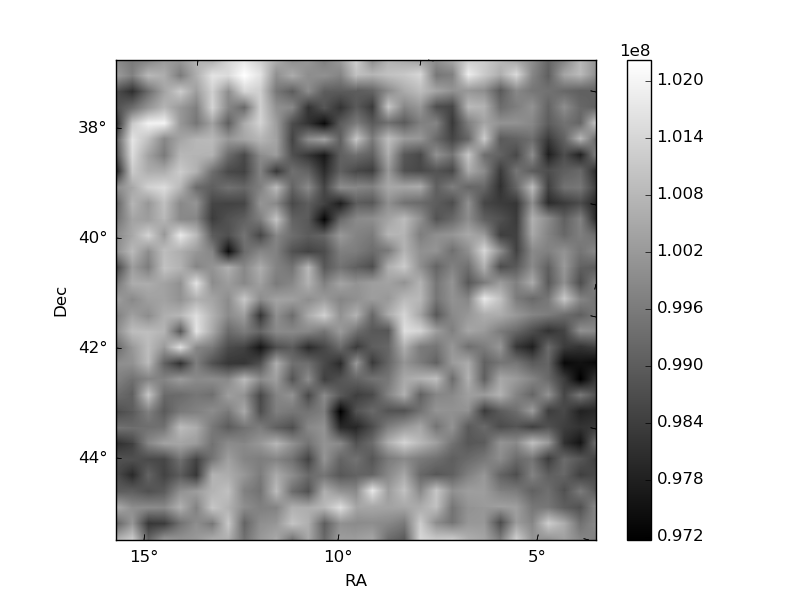
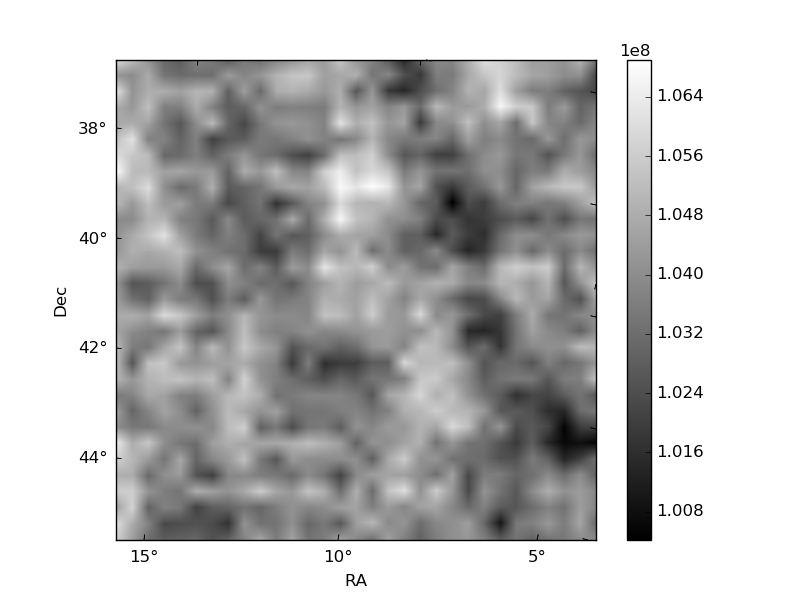
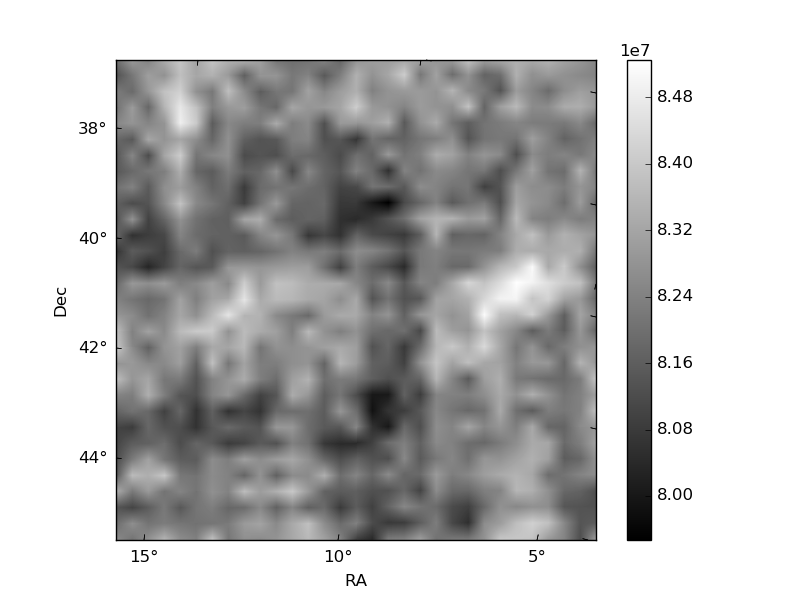
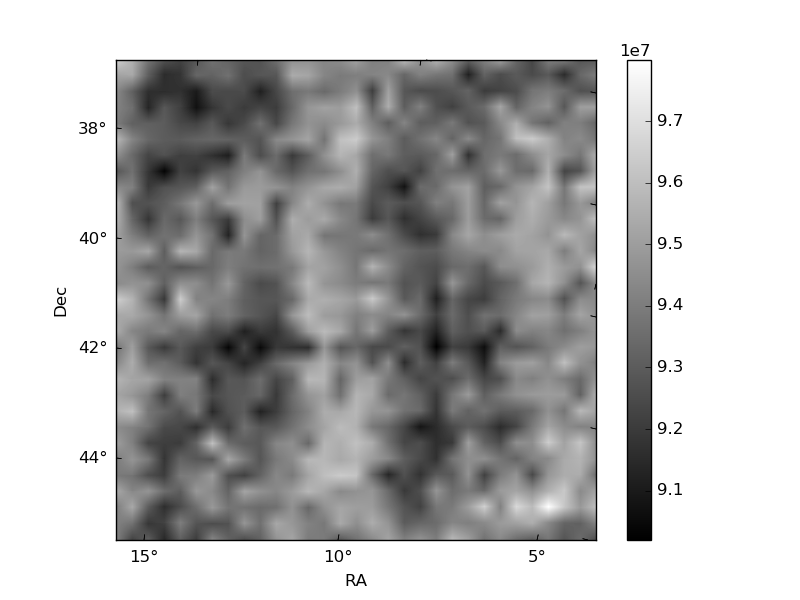
Histogram calculated using DETX and DETY for each event in the final _common_clean file
| Quadrant A |  |
 |
Quadrant B |
|---|---|---|---|
| Quadrant D |  |
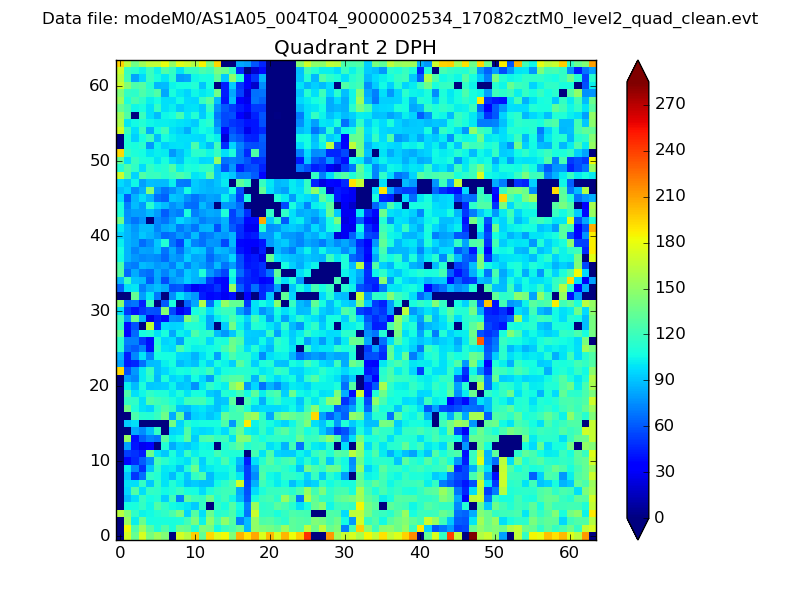 |
Quadrant C |
| Plot type | Count rate plots | Images |
|---|---|---|
| Comparison with Poisson distribution Blue bars denote a histogram of data divided into 1 sec bins. Red curve is a Poisson curve with rate = median count rate of data. |
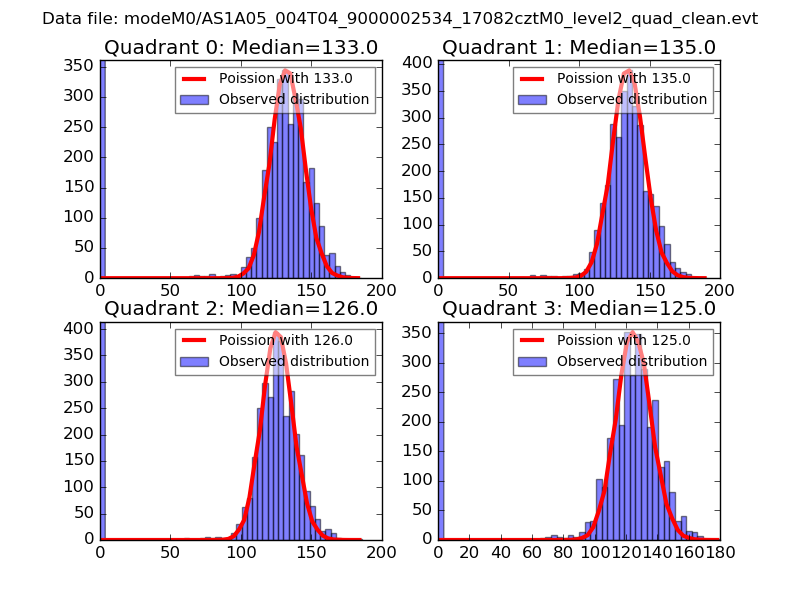 |
 |
| Quadrant-wise count rates Data is divided into 100 sec bins |
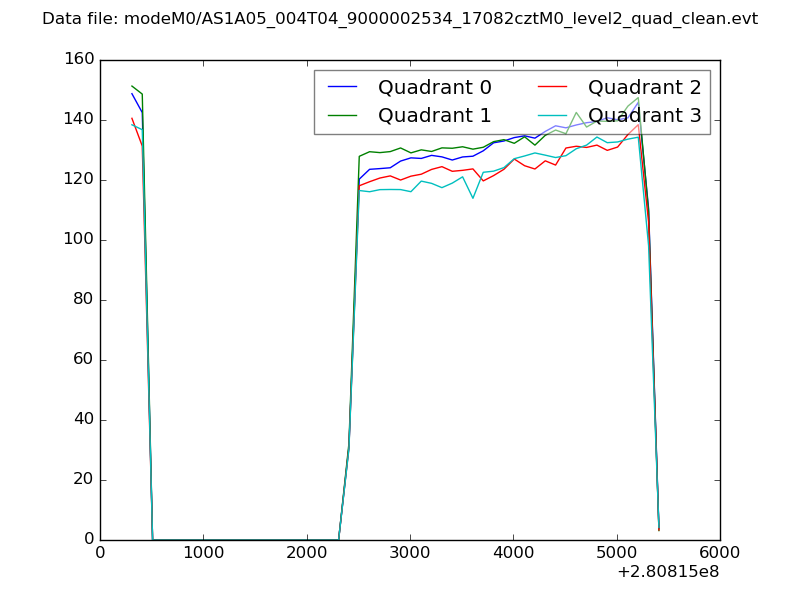 |
|
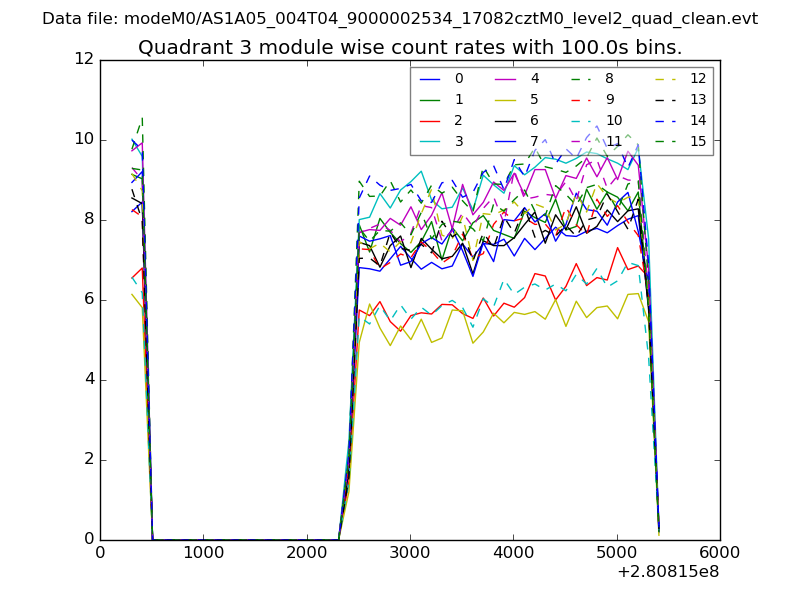
| Module-wise count rates for Quadrant A Data is divided into 100 sec bins |
 |
 |
| Module-wise count rates for Quadrant B Data is divided into 100 sec bins |
 |
 |
| Module-wise count rates for Quadrant C Data is divided into 100 sec bins |
 |
 |
| Module-wise count rates for Quadrant D Data is divided into 100 sec bins |
 |
 |
| Parameter | Plot |
|---|---|
| CZT HV Monitor | 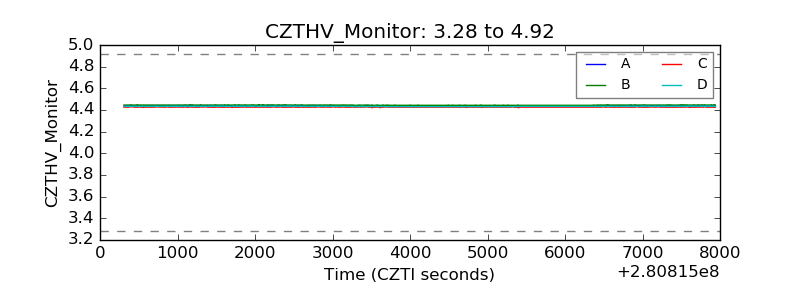 |
| D_VDD | 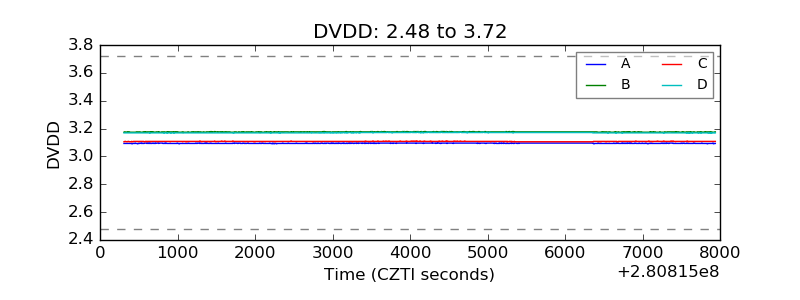 |
| Temperature 1 | 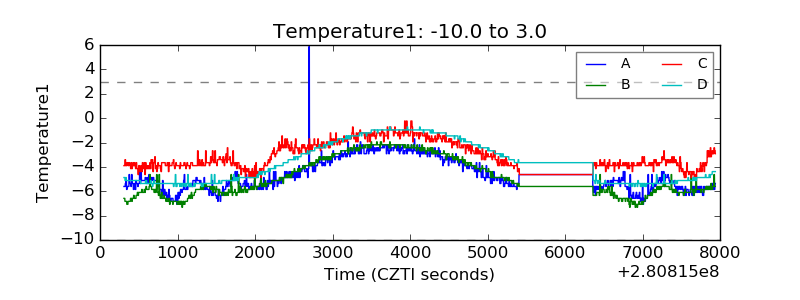 |
| Veto HV Monitor | 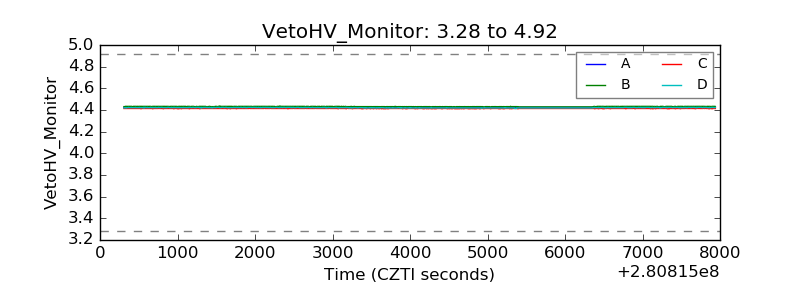 |
| Veto LLD | 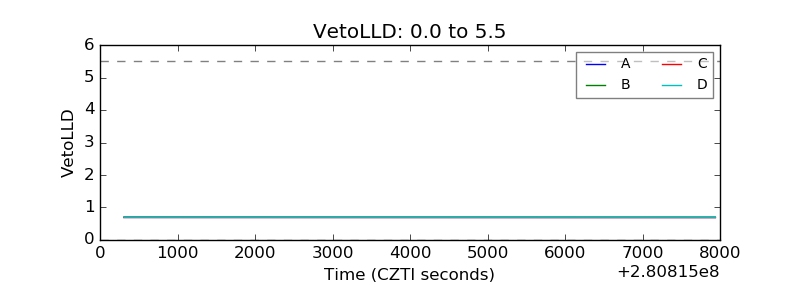 |
| Alpha Counter | 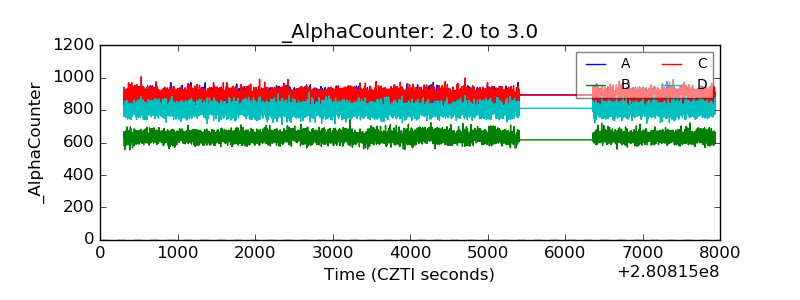 |
| _CPM_Rate | 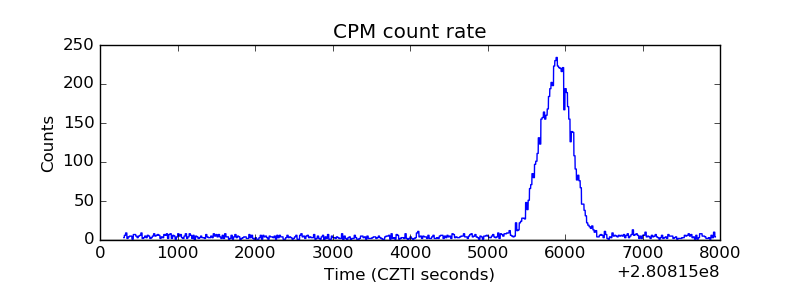 |
| CZT Counter | 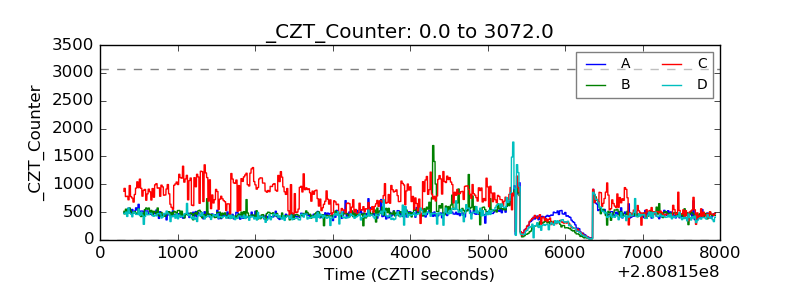 |
| +2.5 Volts monitor |  |
| +5 Volts monitor | 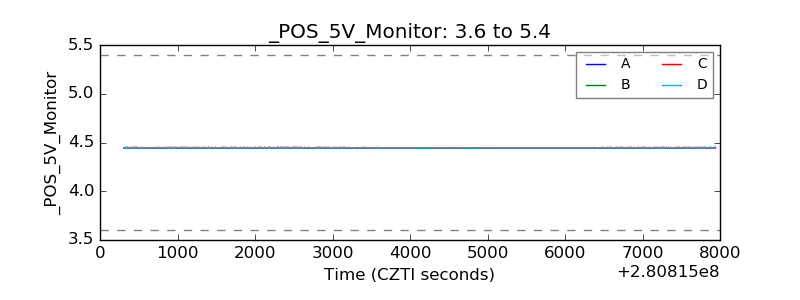 |
| _ROLL_ROT | 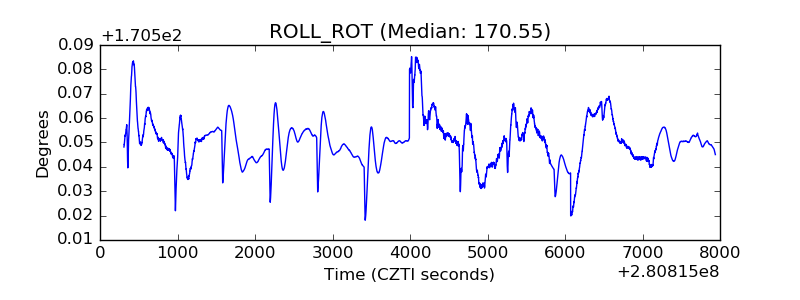 |
| _Roll_DEC | 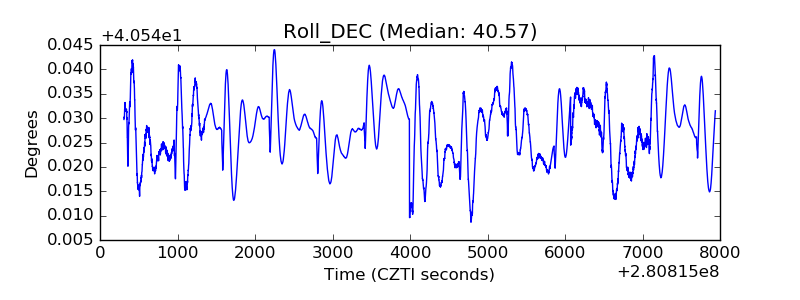 |
| _Roll_RA | 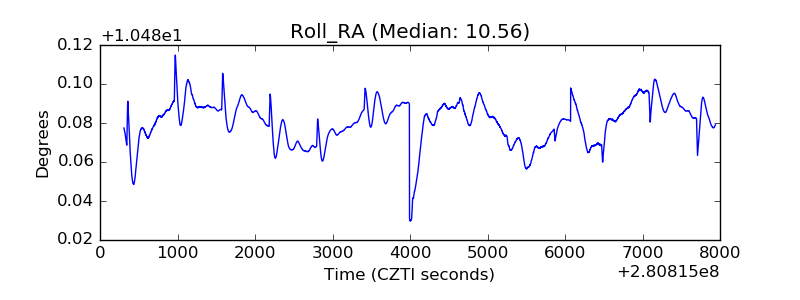 |
| Veto Counter | 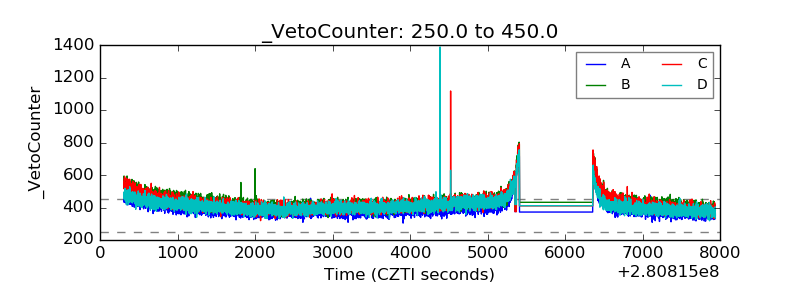 |