| Param | Original file | Final file |
|---|---|---|
| Filename | modeM0/AS1A05_004T04_9000002534_17083cztM0_level2.evt | modeM0/AS1A05_004T04_9000002534_17083cztM0_level2_quad_clean.evt |
| Size (bytes) | 540,630,720 | 89,421,120 |
| Size | 515.6 MB | 85.3 MB |
| Events in quadrant A | 3,646,861 | 553,567 |
| Events in quadrant B | 3,820,293 | 561,830 |
| Events in quadrant C | 4,577,563 | 531,291 |
| Events in quadrant D | 3,805,316 | 525,258 |
| Mode M0 | |||
|---|---|---|---|
| Quadrant | BADHDUFLAG | Total packets | Discarded packets |
| A | 0 | 15962 | 3 |
| B | 0 | 16237 | 3 |
| C | 0 | 18638 | 3 |
| D | 0 | 16800 | 3 |
| Mode SS | |||
|---|---|---|---|
| Quadrant | BADHDUFLAG | Total packets | Discarded packets |
| A | 0 | 158 | 0 |
| B | 0 | 158 | 0 |
| C | 0 | 158 | 0 |
| D | 0 | 158 | 0 |
| Mode M9 | |||
|---|---|---|---|
| Quadrant | BADHDUFLAG | Total packets | Discarded packets |
| A | 0 | 14 | 0 |
| B | 0 | 14 | 0 |
| C | 0 | 14 | 0 |
| D | 0 | 14 | 0 |
| Quadrant | Total seconds | Saturated seconds | Saturation percentage |
|---|---|---|---|
| A | 7703 | 192 | 2.492535% |
| B | 7704 | 219 | 2.842679% |
| C | 7704 | 255 | 3.309969% |
| D | 7703 | 207 | 2.687265% |
Noise dominated data is calculated using 1-second bins in cleaned event files. If a bin has >2000 counts, and if more than 50% of those come from <1% of pixels, then it is considered to be noise-dominated and hence unusable.
| Quadrant | # 1 sec bins | Bins with >0 counts | Bins with >2000 counts | High rate bins dominated by noise | Noise dominated (total time) | Noise dominated (detector-on time) | Marked lightcurve |
|---|---|---|---|---|---|---|---|
| A | 9133 | 7705 | 0 | 0 | 0.00% | 0.00% | 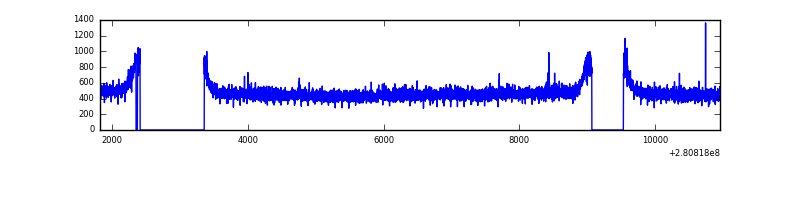 |
| B | 9134 | 7705 | 0 | 0 | 0.00% | 0.00% | 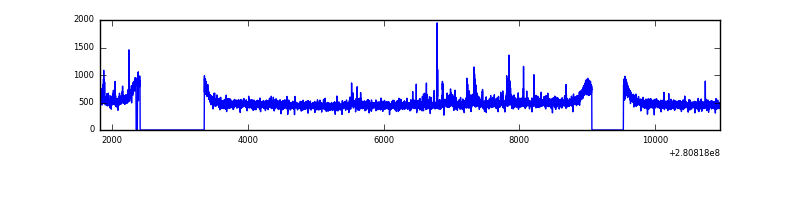 |
| C | 9134 | 7707 | 0 | 0 | 0.00% | 0.00% | 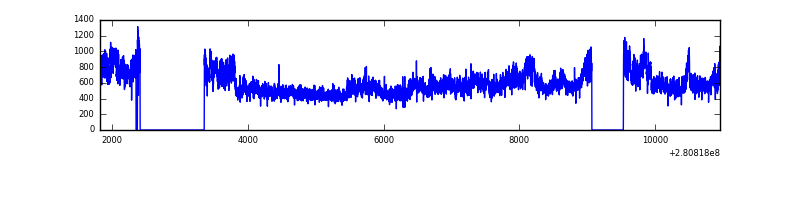 |
| D | 9133 | 7705 | 56 | 56 | 0.61% | 0.73% | 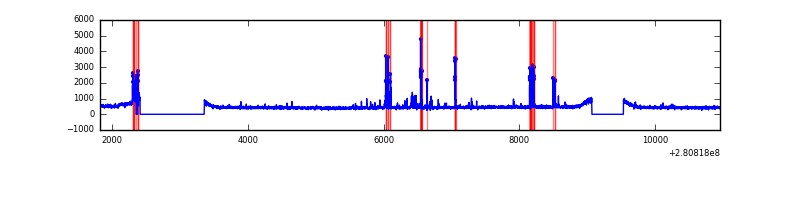 |
Top three noisy pixels from each quadrant. If the there are fewer than three noisy pixels in the level2.evt file, extra rows are filled as -1
| Pixel properties | Quadrant properties | ||||||
|---|---|---|---|---|---|---|---|
| Quadrant | DetID | PixID | Counts | Sigma | Mean | Median | Sigma |
| A | 4 | 2 | 9435 | 44.46 | 945 | 923 | 191.5 |
| A | 0 | 226 | 8160 | 37.8 | 945 | 923 | 191.5 |
| A | 3 | 137 | 7056 | 32.03 | 945 | 923 | 191.5 |
| B | 3 | 209 | 35702 | 190.62 | 948 | 920 | 182.5 |
| B | 0 | 197 | 24986 | 131.89 | 948 | 920 | 182.5 |
| B | 12 | 111 | 21833 | 114.61 | 948 | 920 | 182.5 |
| C | 3 | 233 | 875015 | 4108.55 | 908 | 912 | 212.8 |
| C | 14 | 238 | 137672 | 642.81 | 908 | 912 | 212.8 |
| C | 7 | 247 | 21197 | 95.34 | 908 | 912 | 212.8 |
| D | 10 | 70 | 218555 | 981.41 | 917 | 889 | 221.8 |
| D | 1 | 52 | 50013 | 221.49 | 917 | 889 | 221.8 |
| D | 15 | 0 | 34985 | 153.73 | 917 | 889 | 221.8 |
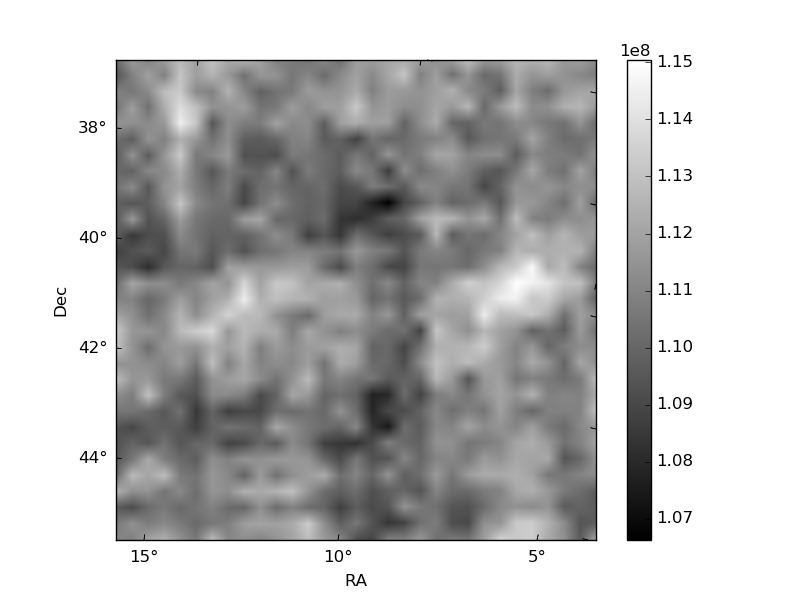
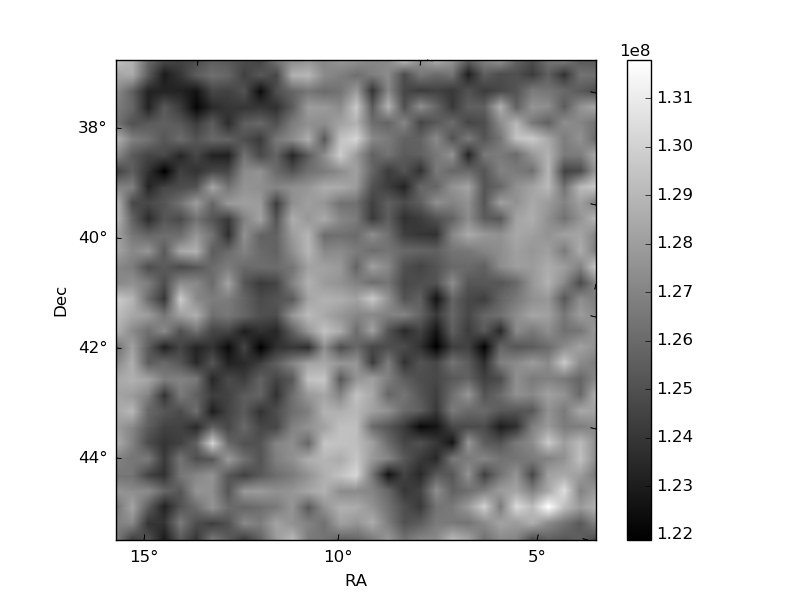
Histogram calculated using DETX and DETY for each event in the final _common_clean file
| Quadrant A |  |
 |
Quadrant B |
|---|---|---|---|
| Quadrant D |  |
 |
Quadrant C |
| Plot type | Count rate plots | Images |
|---|---|---|
| Comparison with Poisson distribution Blue bars denote a histogram of data divided into 1 sec bins. Red curve is a Poisson curve with rate = median count rate of data. |
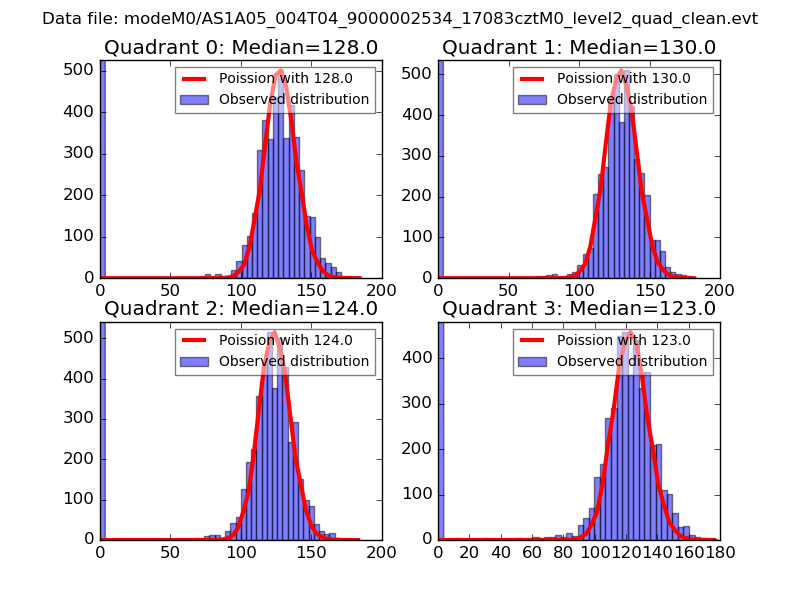 |
 |
| Quadrant-wise count rates Data is divided into 100 sec bins |
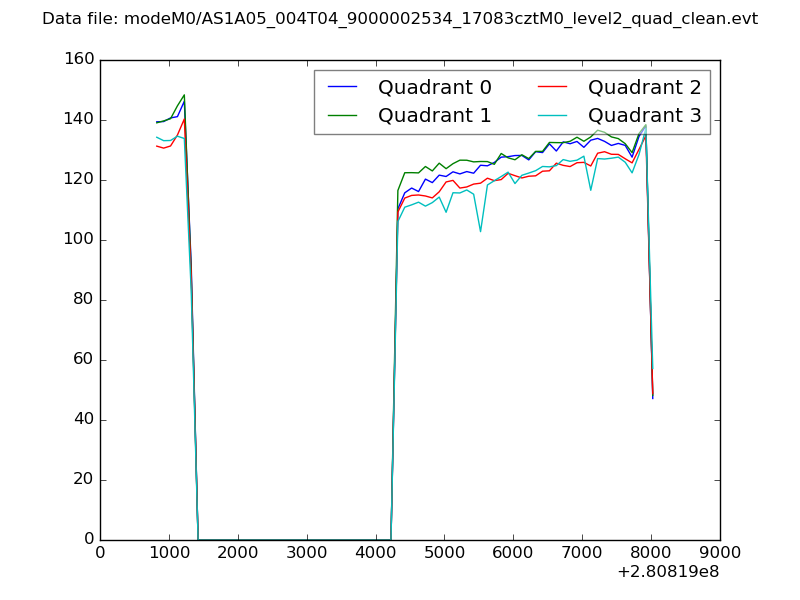 |
|
| Module-wise count rates for Quadrant A Data is divided into 100 sec bins |
 |
 |
| Module-wise count rates for Quadrant B Data is divided into 100 sec bins |
 |
 |
| Module-wise count rates for Quadrant C Data is divided into 100 sec bins |
 |
 |
| Module-wise count rates for Quadrant D Data is divided into 100 sec bins |
 |
 |
| Parameter | Plot |
|---|---|
| CZT HV Monitor |  |
| D_VDD | 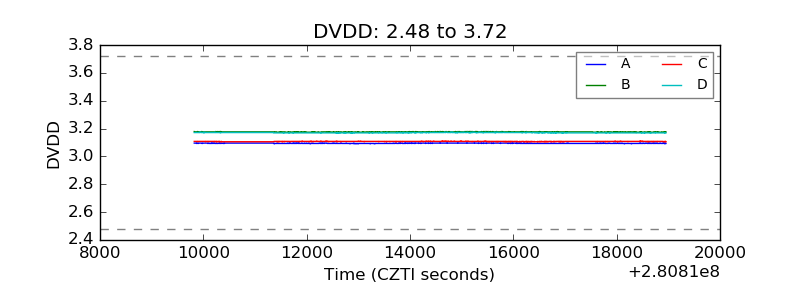 |
| Temperature 1 |  |
| Veto HV Monitor |  |
| Veto LLD |  |
| Alpha Counter | 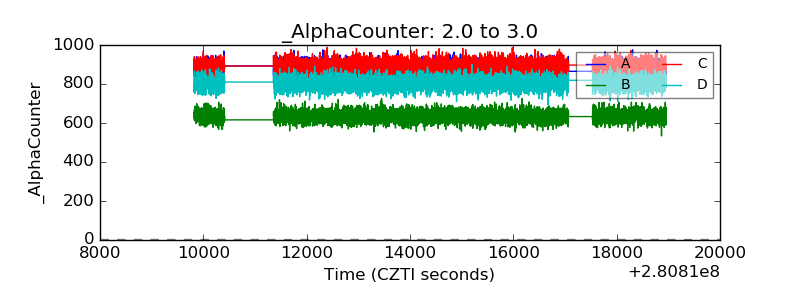 |
| _CPM_Rate | 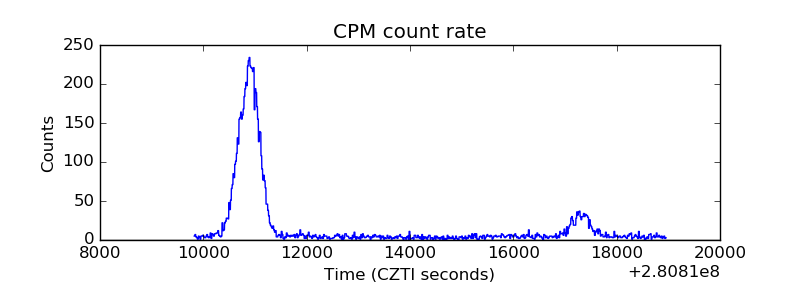 |
| CZT Counter |  |
| +2.5 Volts monitor |  |
| +5 Volts monitor |  |
| _ROLL_ROT |  |
| _Roll_DEC |  |
| _Roll_RA |  |
| Veto Counter |  |