| Param | Original file | Final file |
|---|---|---|
| Filename | modeM0/AS1A05_004T04_9000002534_17084cztM0_level2.evt | modeM0/AS1A05_004T04_9000002534_17084cztM0_level2_quad_clean.evt |
| Size (bytes) | 585,423,360 | 95,454,720 |
| Size | 558.3 MB | 91.0 MB |
| Events in quadrant A | 3,942,120 | 587,022 |
| Events in quadrant B | 4,165,156 | 595,541 |
| Events in quadrant C | 4,881,503 | 568,351 |
| Events in quadrant D | 4,172,994 | 558,936 |
| Mode M0 | |||
|---|---|---|---|
| Quadrant | BADHDUFLAG | Total packets | Discarded packets |
| A | 0 | 17440 | 2 |
| B | 0 | 17802 | 2 |
| C | 0 | 19945 | 2 |
| D | 0 | 18303 | 2 |
| Mode SS | |||
|---|---|---|---|
| Quadrant | BADHDUFLAG | Total packets | Discarded packets |
| A | 0 | 170 | 0 |
| B | 0 | 170 | 0 |
| C | 0 | 170 | 0 |
| D | 0 | 170 | 0 |
| Mode M9 | |||
|---|---|---|---|
| Quadrant | BADHDUFLAG | Total packets | Discarded packets |
| A | 0 | 5 | 0 |
| B | 0 | 5 | 0 |
| C | 0 | 5 | 0 |
| D | 0 | 5 | 0 |
| Quadrant | Total seconds | Saturated seconds | Saturation percentage |
|---|---|---|---|
| A | 8357 | 397 | 4.750509% |
| B | 8357 | 413 | 4.941965% |
| C | 8358 | 473 | 5.659249% |
| D | 8358 | 305 | 3.649198% |
Noise dominated data is calculated using 1-second bins in cleaned event files. If a bin has >2000 counts, and if more than 50% of those come from <1% of pixels, then it is considered to be noise-dominated and hence unusable.
| Quadrant | # 1 sec bins | Bins with >0 counts | Bins with >2000 counts | High rate bins dominated by noise | Noise dominated (total time) | Noise dominated (detector-on time) | Marked lightcurve |
|---|---|---|---|---|---|---|---|
| A | 8837 | 8359 | 0 | 0 | 0.00% | 0.00% |  |
| B | 8837 | 8358 | 1 | 1 | 0.01% | 0.01% |  |
| C | 8838 | 8360 | 6 | 6 | 0.07% | 0.07% |  |
| D | 8838 | 8359 | 28 | 28 | 0.32% | 0.33% |  |
Top three noisy pixels from each quadrant. If the there are fewer than three noisy pixels in the level2.evt file, extra rows are filled as -1
| Pixel properties | Quadrant properties | ||||||
|---|---|---|---|---|---|---|---|
| Quadrant | DetID | PixID | Counts | Sigma | Mean | Median | Sigma |
| A | 4 | 2 | 9211 | 39.61 | 1021 | 995 | 207.4 |
| A | 0 | 226 | 8855 | 37.9 | 1021 | 995 | 207.4 |
| A | 12 | 194 | 7649 | 32.08 | 1021 | 995 | 207.4 |
| B | 0 | 189 | 56447 | 280.59 | 1022 | 990 | 197.6 |
| B | 4 | 216 | 25444 | 123.73 | 1022 | 990 | 197.6 |
| B | 0 | 197 | 25044 | 121.71 | 1022 | 990 | 197.6 |
| C | 3 | 233 | 724962 | 3164.27 | 980 | 985 | 228.8 |
| C | 9 | 54 | 151420 | 657.5 | 980 | 985 | 228.8 |
| C | 14 | 238 | 150616 | 653.99 | 980 | 985 | 228.8 |
| D | 1 | 52 | 157678 | 641.2 | 1000 | 968 | 244.4 |
| D | 10 | 70 | 124732 | 506.4 | 1000 | 968 | 244.4 |
| D | 15 | 0 | 78398 | 316.82 | 1000 | 968 | 244.4 |
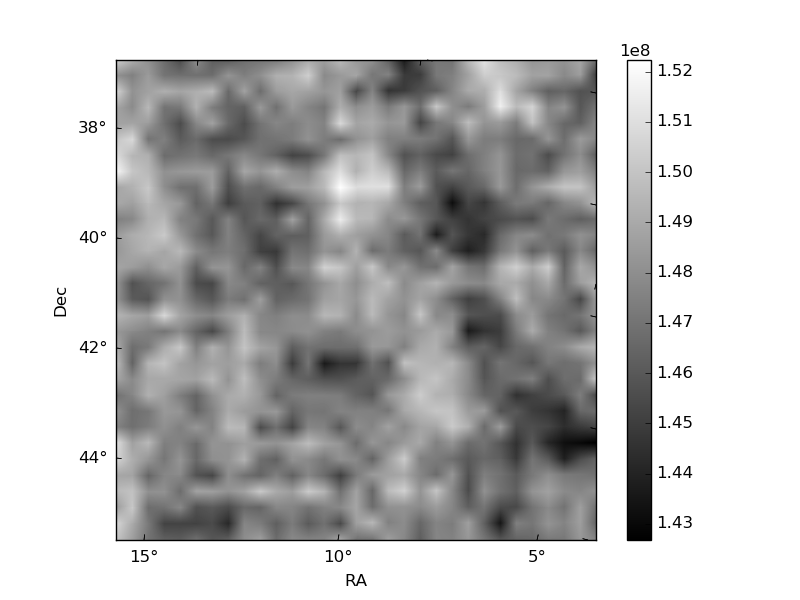
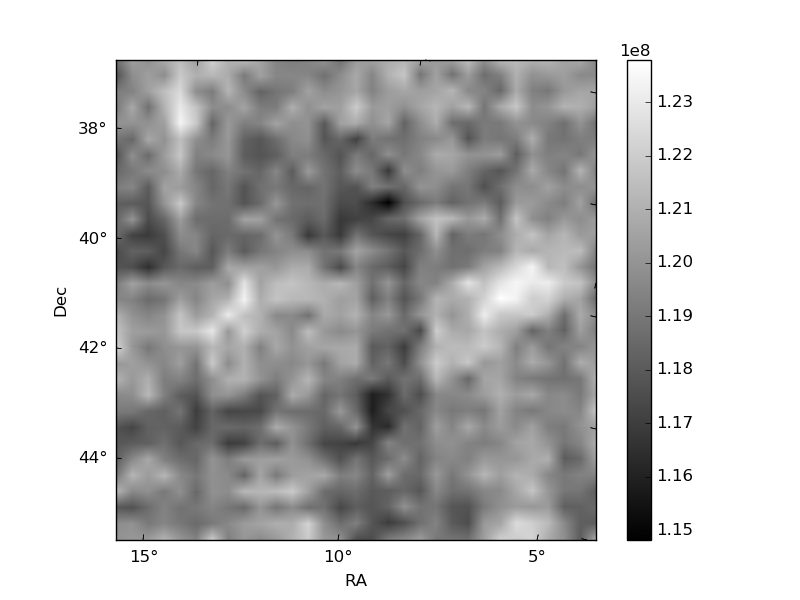
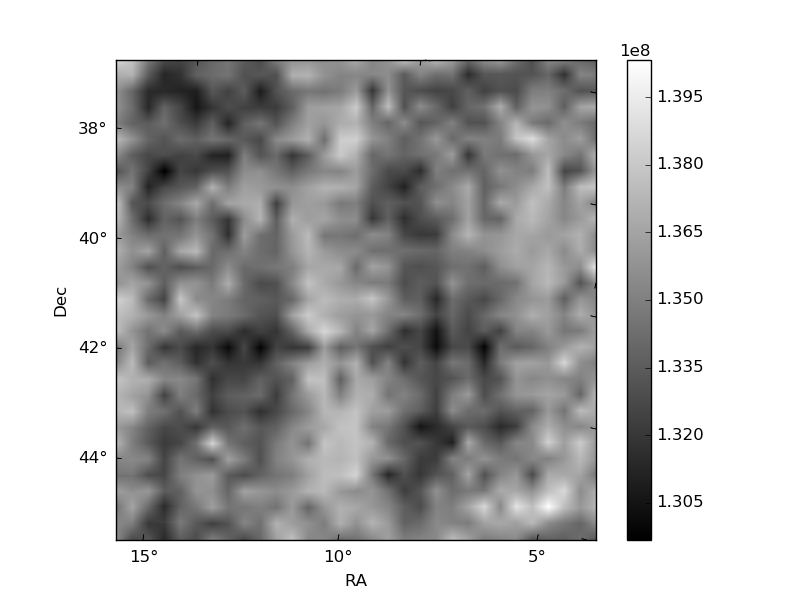
Histogram calculated using DETX and DETY for each event in the final _common_clean file
| Quadrant A | 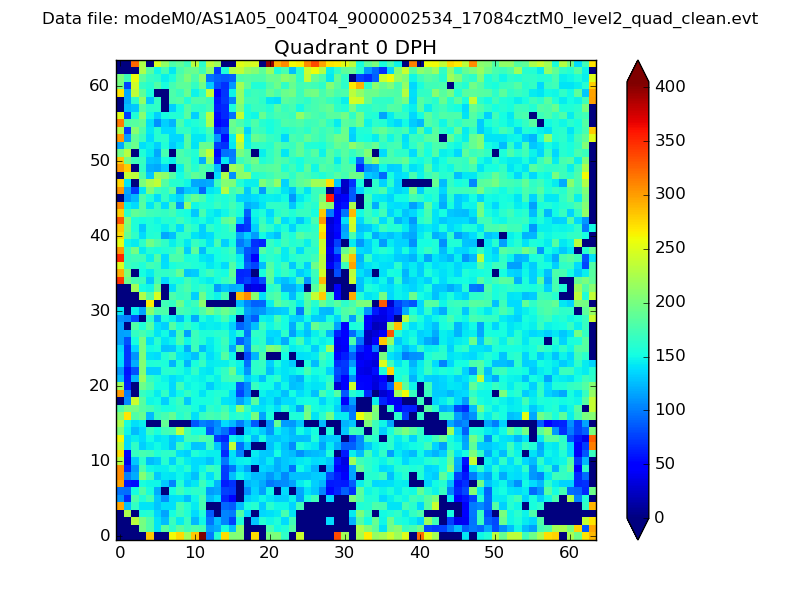 |
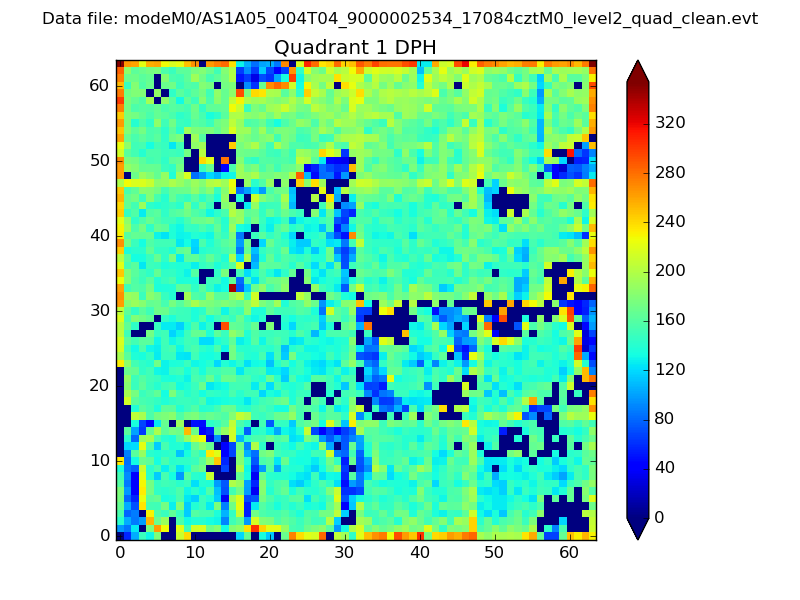 |
Quadrant B |
|---|---|---|---|
| Quadrant D |  |
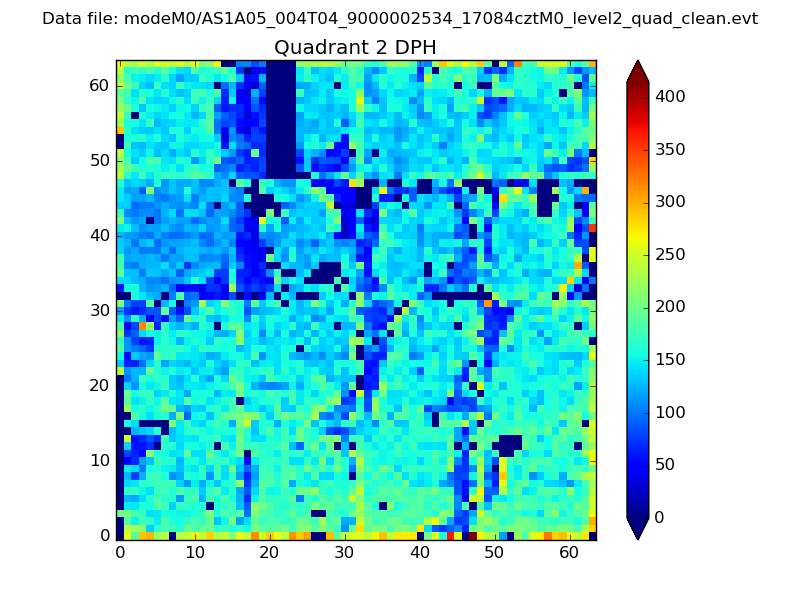 |
Quadrant C |
| Plot type | Count rate plots | Images |
|---|---|---|
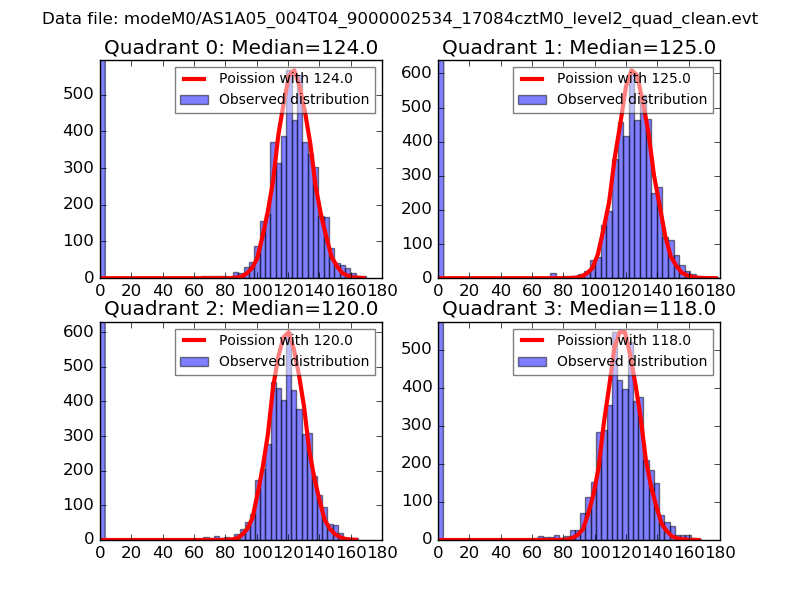
| Comparison with Poisson distribution Blue bars denote a histogram of data divided into 1 sec bins. Red curve is a Poisson curve with rate = median count rate of data. |
 |
 |
| Quadrant-wise count rates Data is divided into 100 sec bins |
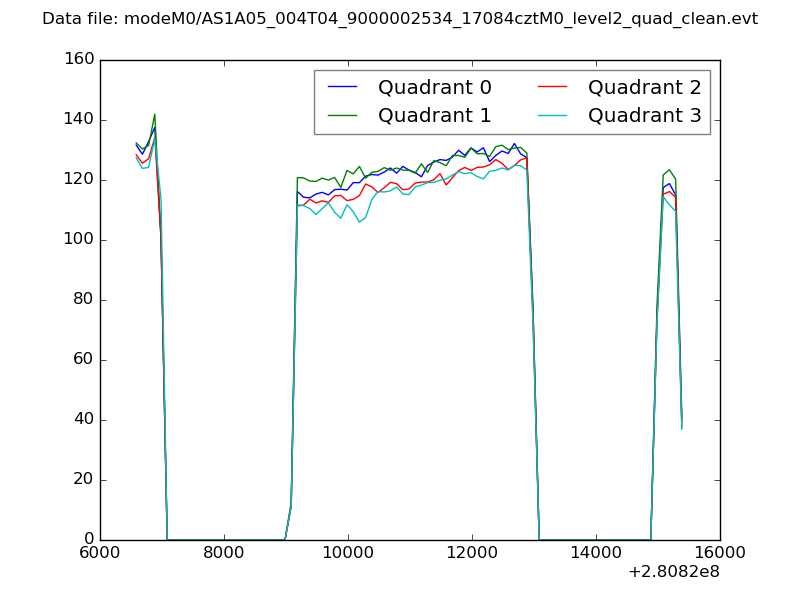 |
|
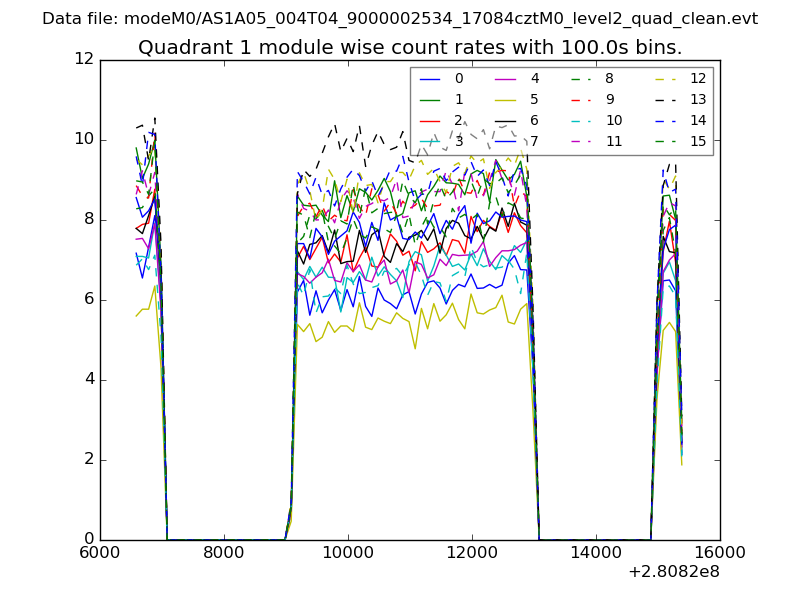
| Module-wise count rates for Quadrant A Data is divided into 100 sec bins |
 |
 |
| Module-wise count rates for Quadrant B Data is divided into 100 sec bins |
 |
 |
| Module-wise count rates for Quadrant C Data is divided into 100 sec bins |
 |
 |
| Module-wise count rates for Quadrant D Data is divided into 100 sec bins |
 |
 |
| Parameter | Plot |
|---|---|
| CZT HV Monitor | 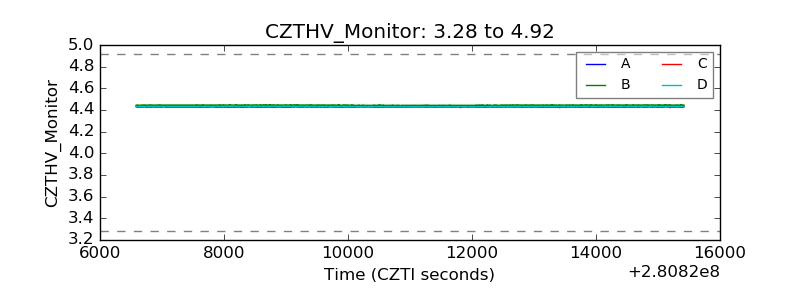 |
| D_VDD | 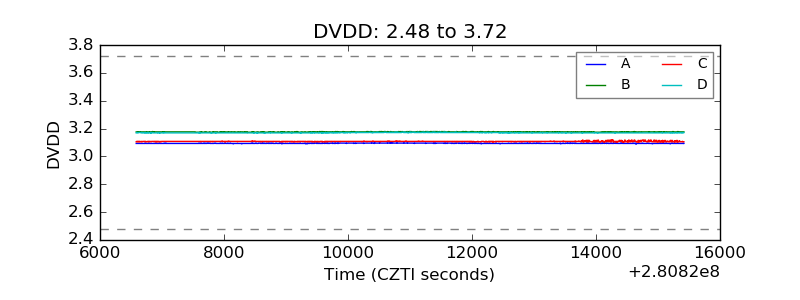 |
| Temperature 1 | 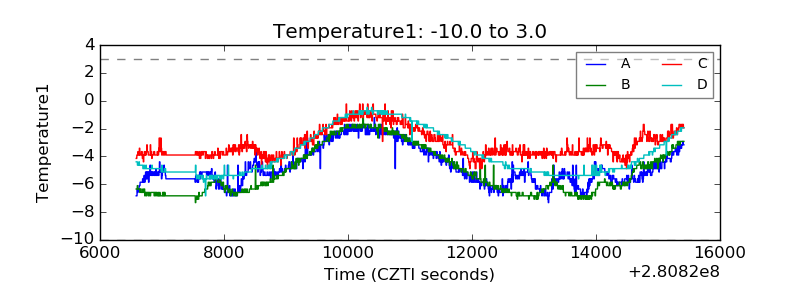 |
| Veto HV Monitor | 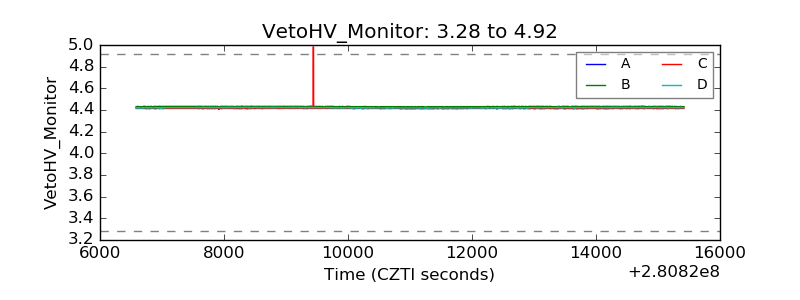 |
| Veto LLD |  |
| Alpha Counter | 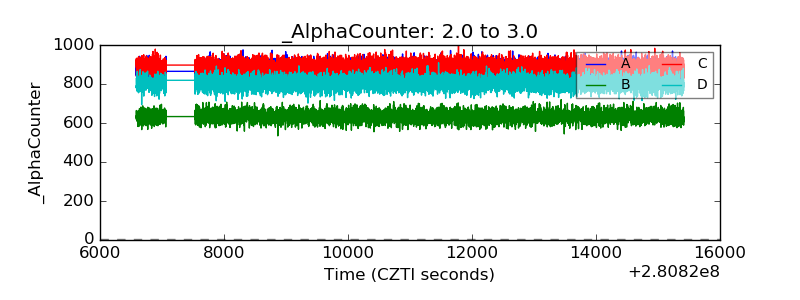 |
| _CPM_Rate | 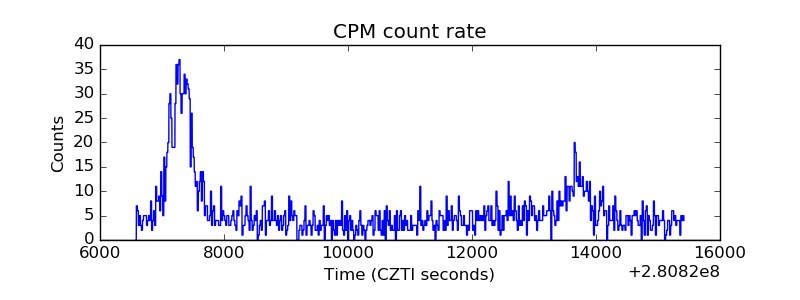 |
| CZT Counter | 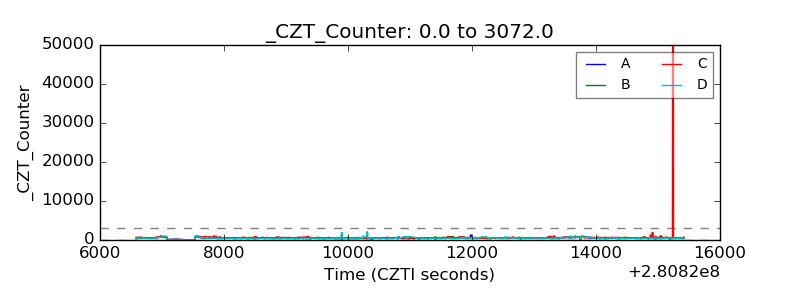 |
| +2.5 Volts monitor |  |
| +5 Volts monitor |  |
| _ROLL_ROT |  |
| _Roll_DEC | 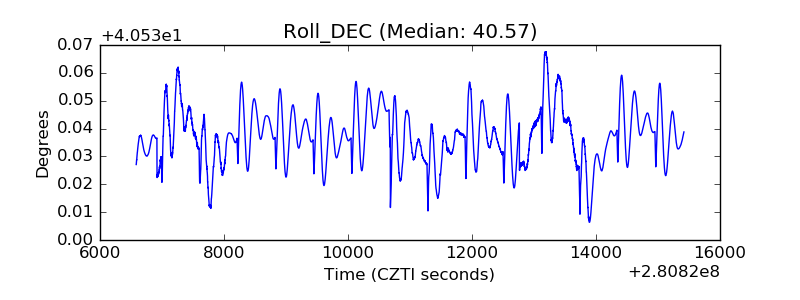 |
| _Roll_RA | 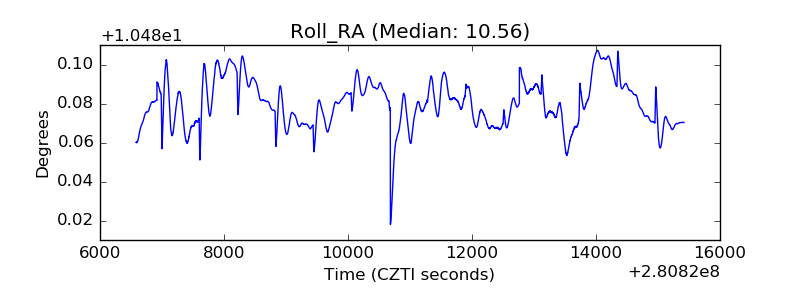 |
| Veto Counter | 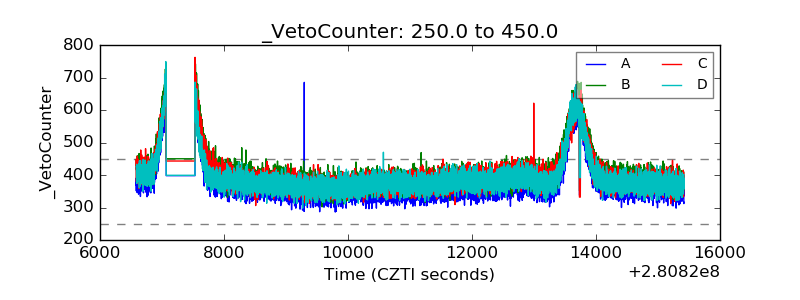 |