| Param | Original file | Final file |
|---|---|---|
| Filename | modeM0/AS1A05_004T04_9000002534_17085cztM0_level2.evt | modeM0/AS1A05_004T04_9000002534_17085cztM0_level2_quad_clean.evt |
| Size (bytes) | 588,533,760 | 93,314,880 |
| Size | 561.3 MB | 89.0 MB |
| Events in quadrant A | 3,937,394 | 572,243 |
| Events in quadrant B | 4,202,132 | 578,448 |
| Events in quadrant C | 5,056,115 | 550,324 |
| Events in quadrant D | 4,061,979 | 545,573 |
| Mode M0 | |||
|---|---|---|---|
| Quadrant | BADHDUFLAG | Total packets | Discarded packets |
| A | 0 | 17422 | 2 |
| B | 0 | 17879 | 2 |
| C | 0 | 20379 | 2 |
| D | 0 | 17907 | 2 |
| Mode SS | |||
|---|---|---|---|
| Quadrant | BADHDUFLAG | Total packets | Discarded packets |
| A | 0 | 170 | 0 |
| B | 0 | 170 | 0 |
| C | 0 | 170 | 0 |
| D | 0 | 170 | 0 |
| Mode M9 | |||
|---|---|---|---|
| Quadrant | BADHDUFLAG | Total packets | Discarded packets |
| A | 0 | 2 | 0 |
| B | 0 | 2 | 0 |
| C | 0 | 2 | 0 |
| D | 0 | 2 | 0 |
| Quadrant | Total seconds | Saturated seconds | Saturation percentage |
|---|---|---|---|
| A | 8333 | 367 | 4.404176% |
| B | 8333 | 393 | 4.716189% |
| C | 8333 | 444 | 5.328213% |
| D | 8334 | 295 | 3.539717% |
Noise dominated data is calculated using 1-second bins in cleaned event files. If a bin has >2000 counts, and if more than 50% of those come from <1% of pixels, then it is considered to be noise-dominated and hence unusable.
| Quadrant | # 1 sec bins | Bins with >0 counts | Bins with >2000 counts | High rate bins dominated by noise | Noise dominated (total time) | Noise dominated (detector-on time) | Marked lightcurve |
|---|---|---|---|---|---|---|---|
| A | 8568 | 8336 | 0 | 0 | 0.00% | 0.00% | 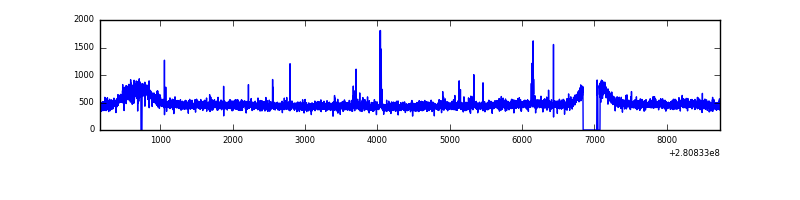 |
| B | 8568 | 8336 | 8 | 8 | 0.09% | 0.10% | 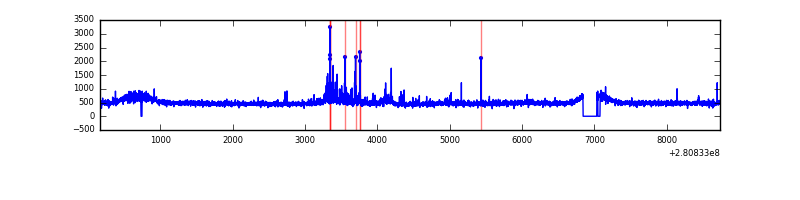 |
| C | 8568 | 8336 | 15 | 15 | 0.18% | 0.18% | 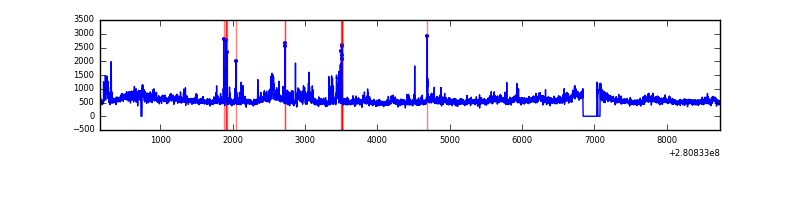 |
| D | 8569 | 8337 | 38 | 38 | 0.44% | 0.46% | 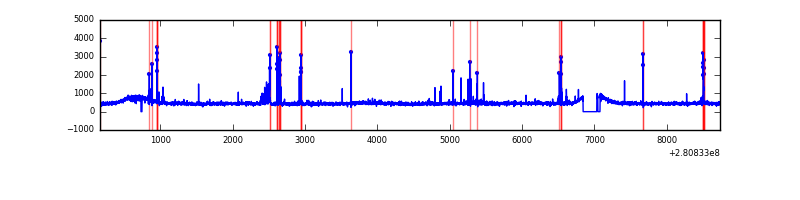 |
Top three noisy pixels from each quadrant. If the there are fewer than three noisy pixels in the level2.evt file, extra rows are filled as -1
| Pixel properties | Quadrant properties | ||||||
|---|---|---|---|---|---|---|---|
| Quadrant | DetID | PixID | Counts | Sigma | Mean | Median | Sigma |
| A | 4 | 2 | 21810 | 100.22 | 1014 | 988 | 207.8 |
| A | 0 | 254 | 12202 | 53.97 | 1014 | 988 | 207.8 |
| A | 0 | 226 | 8937 | 38.26 | 1014 | 988 | 207.8 |
| B | 7 | 220 | 105731 | 540.46 | 1014 | 986 | 193.8 |
| B | 0 | 219 | 37727 | 189.57 | 1014 | 986 | 193.8 |
| B | 15 | 35 | 29001 | 144.55 | 1014 | 986 | 193.8 |
| C | 3 | 233 | 701445 | 3068.35 | 970 | 971 | 228.3 |
| C | 9 | 54 | 388459 | 1697.35 | 970 | 971 | 228.3 |
| C | 14 | 238 | 148092 | 644.45 | 970 | 971 | 228.3 |
| D | 10 | 70 | 122995 | 504.75 | 989 | 958 | 241.8 |
| D | 1 | 52 | 115691 | 474.54 | 989 | 958 | 241.8 |
| D | 2 | 234 | 36448 | 146.79 | 989 | 958 | 241.8 |
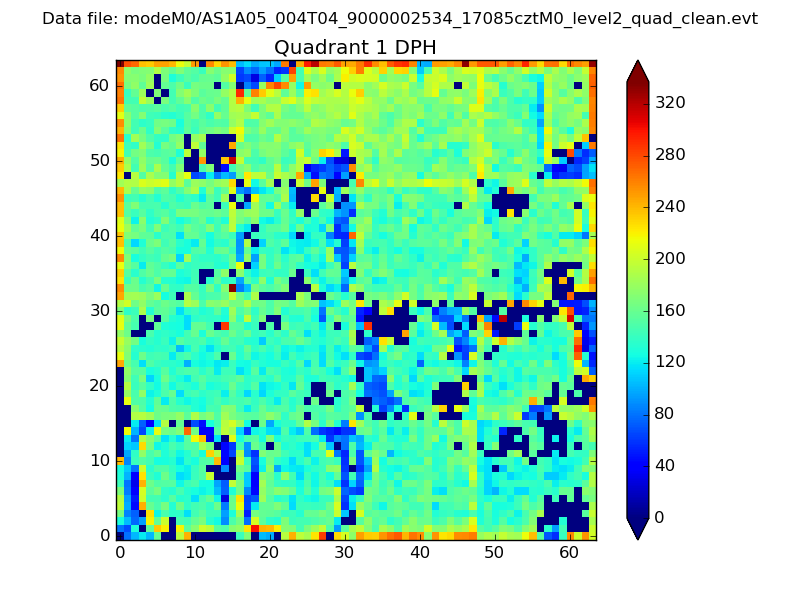
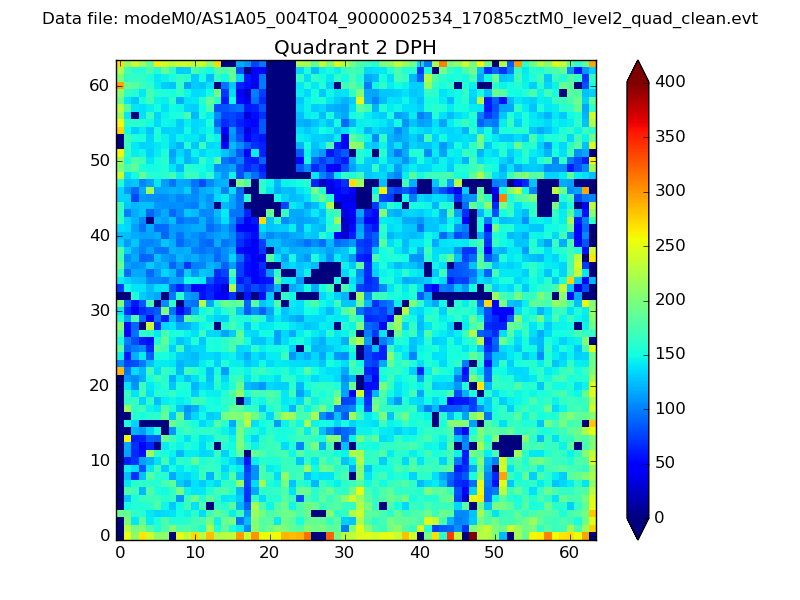
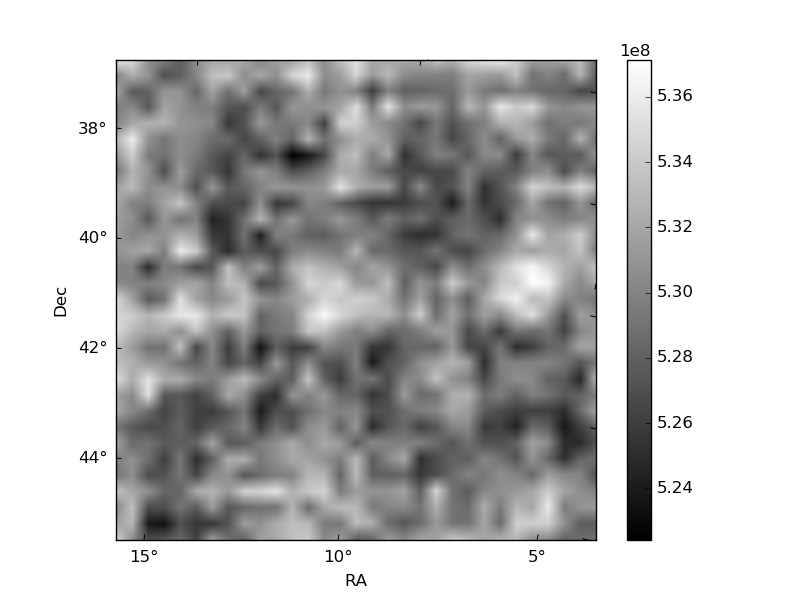
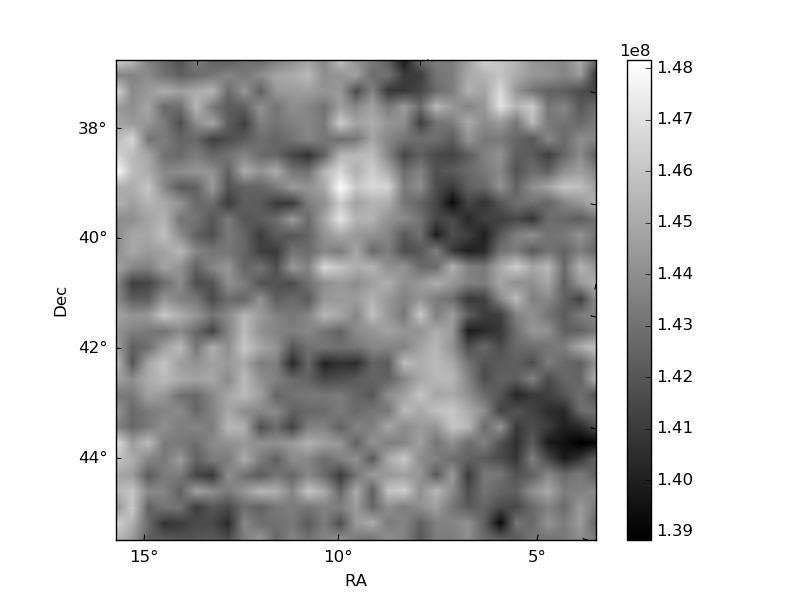
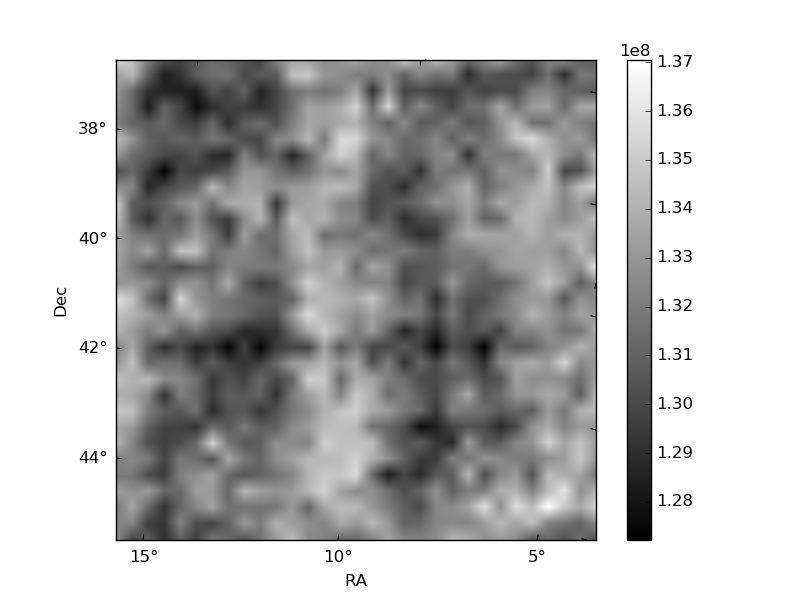
Histogram calculated using DETX and DETY for each event in the final _common_clean file
| Quadrant A |  |
 |
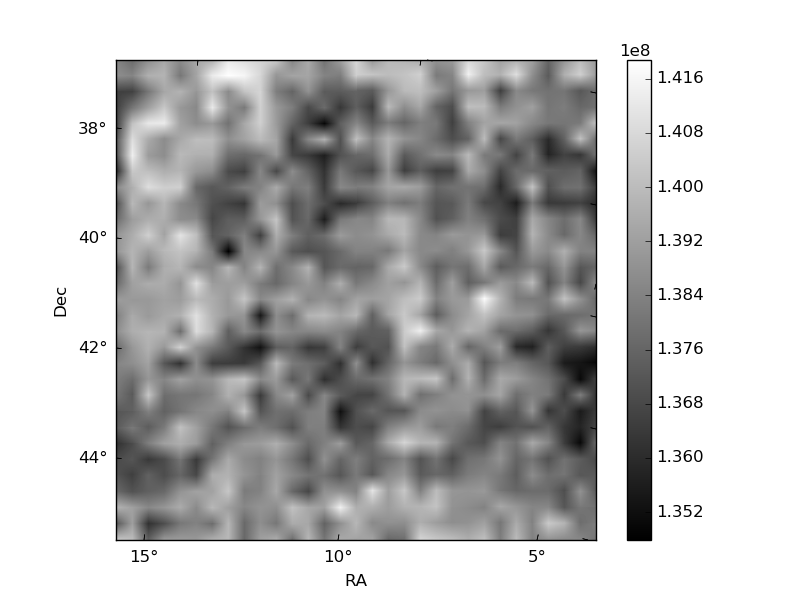
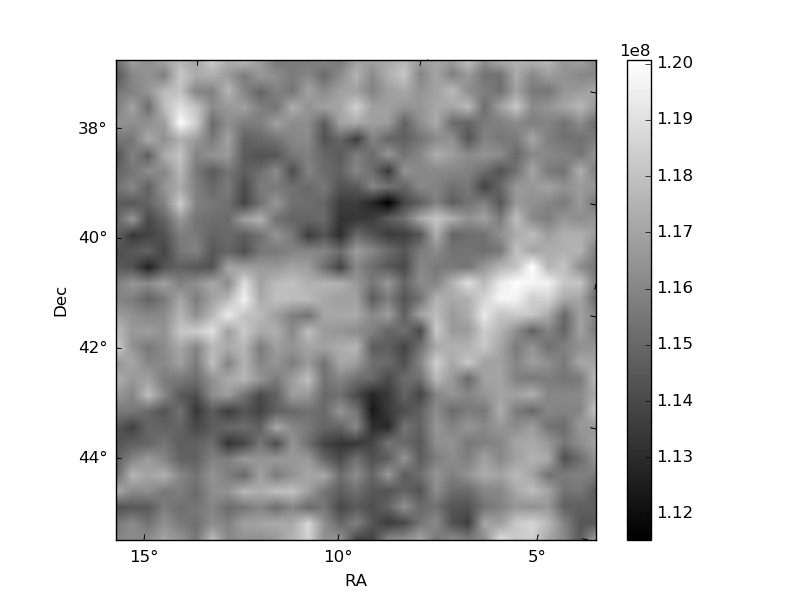
Quadrant B |
|---|---|---|---|
| Quadrant D | 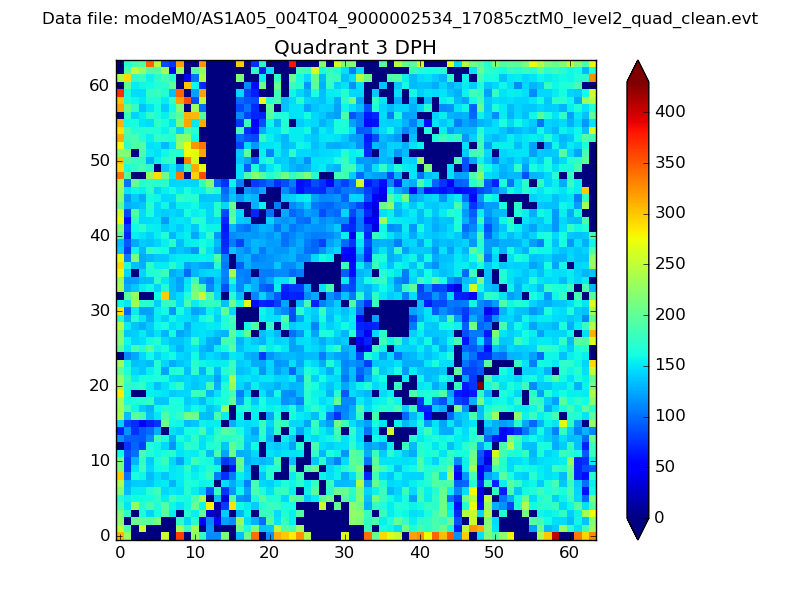 |
 |
Quadrant C |
| Plot type | Count rate plots | Images |
|---|---|---|
| Comparison with Poisson distribution Blue bars denote a histogram of data divided into 1 sec bins. Red curve is a Poisson curve with rate = median count rate of data. |
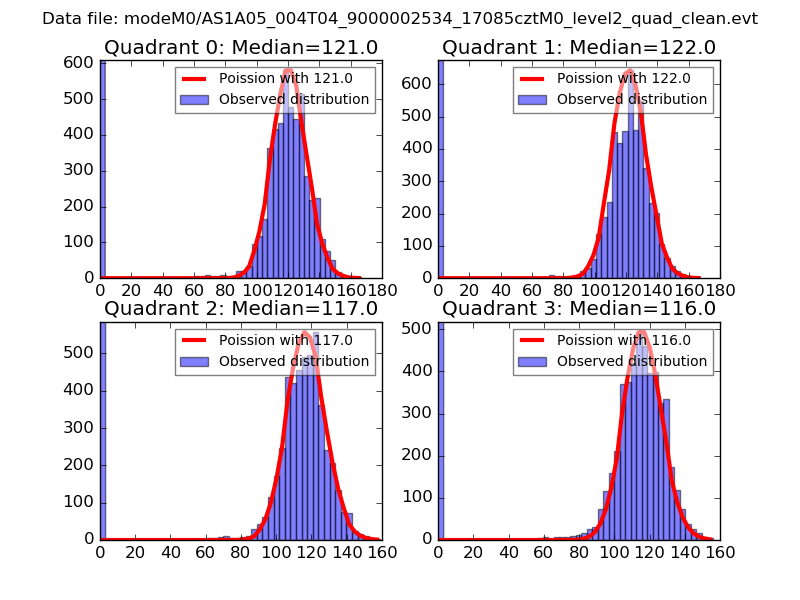 |
 |
| Quadrant-wise count rates Data is divided into 100 sec bins |
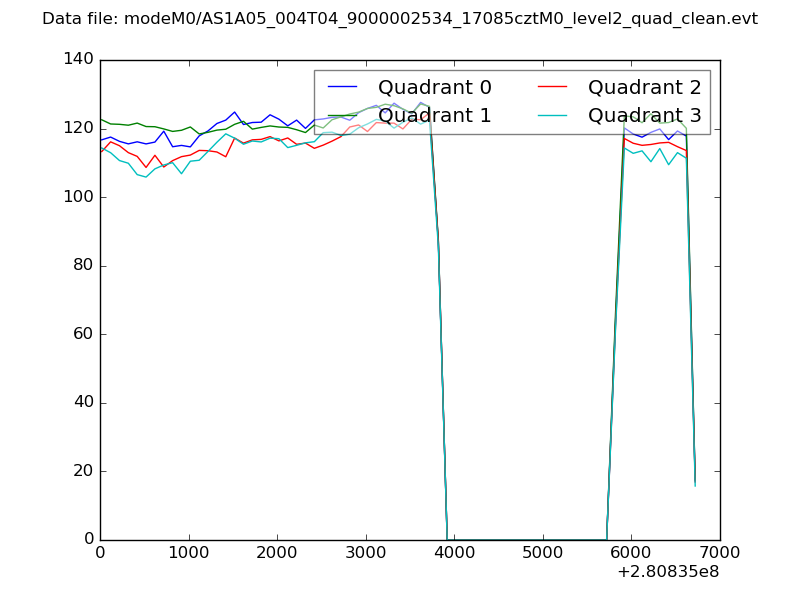 |
|
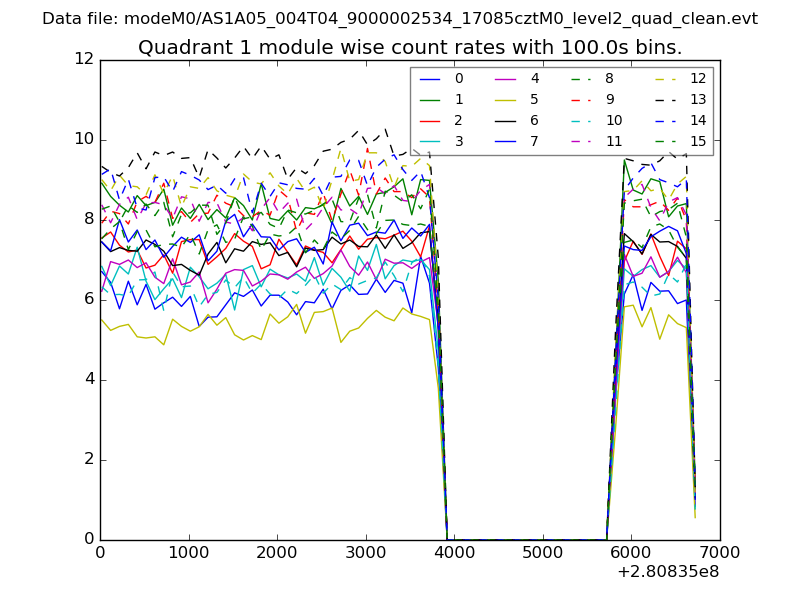
| Module-wise count rates for Quadrant A Data is divided into 100 sec bins |
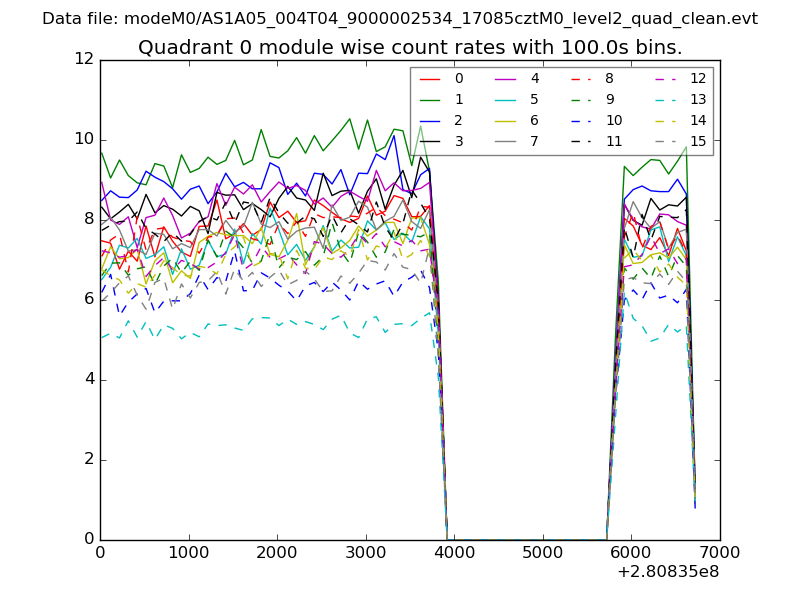 |
 |
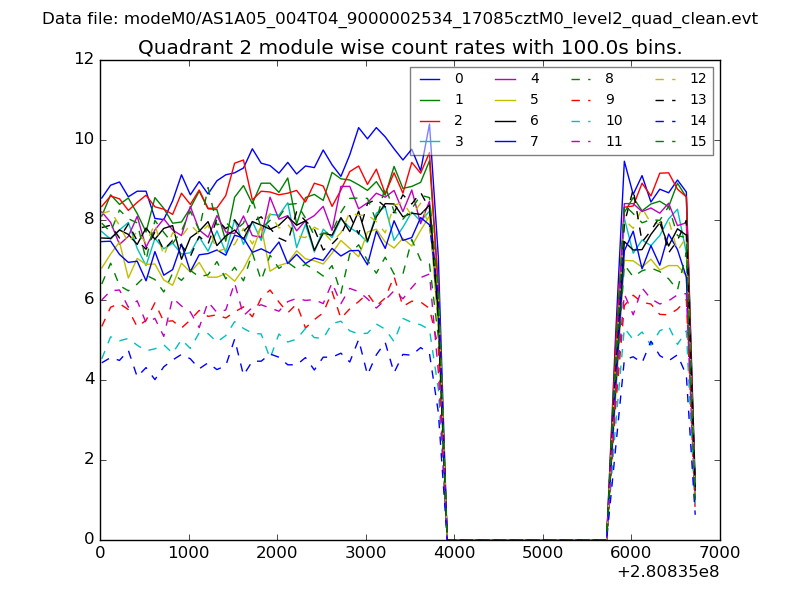
| Module-wise count rates for Quadrant B Data is divided into 100 sec bins |
 |
 |
| Module-wise count rates for Quadrant C Data is divided into 100 sec bins |
 |
 |
| Module-wise count rates for Quadrant D Data is divided into 100 sec bins |
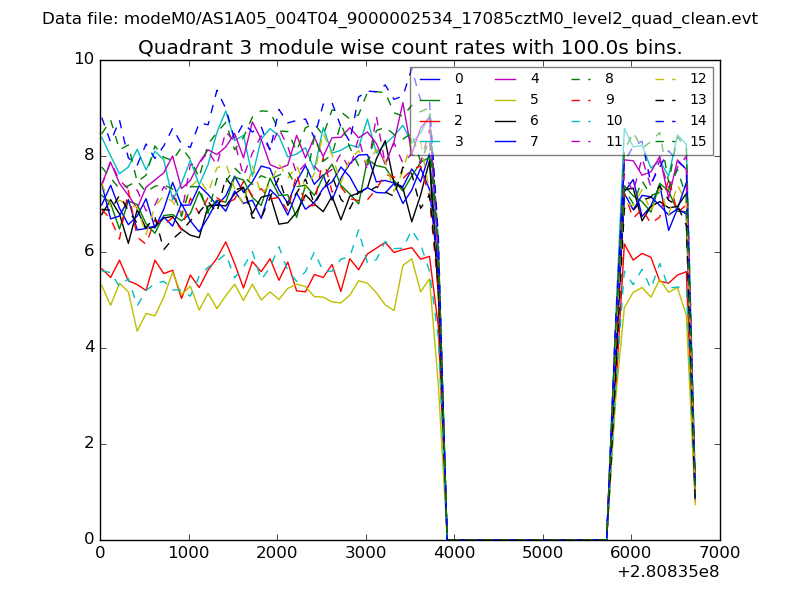 |
 |
| Parameter | Plot |
|---|---|
| CZT HV Monitor | 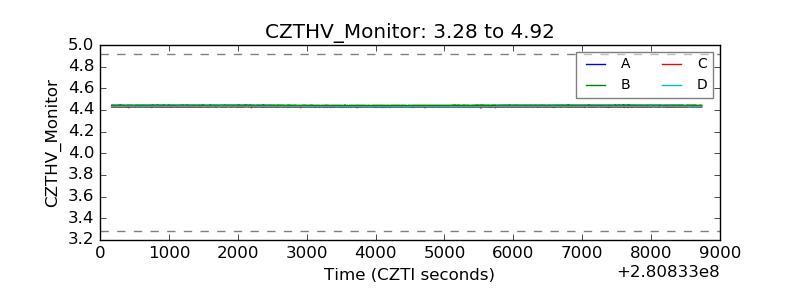 |
| D_VDD | 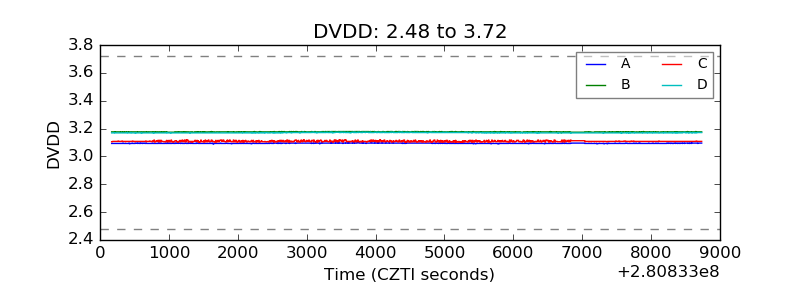 |
| Temperature 1 | 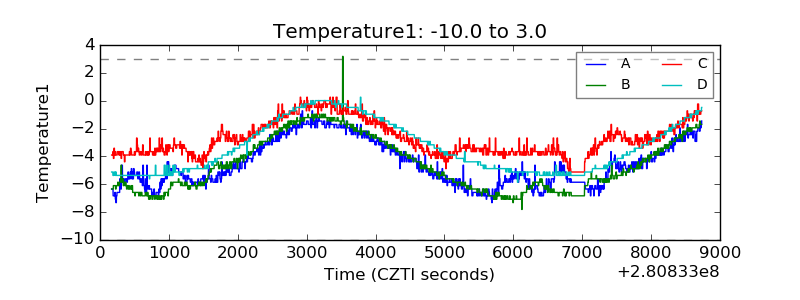 |
| Veto HV Monitor | 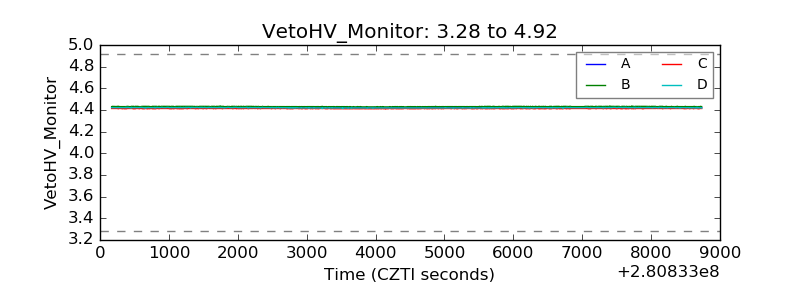 |
| Veto LLD | 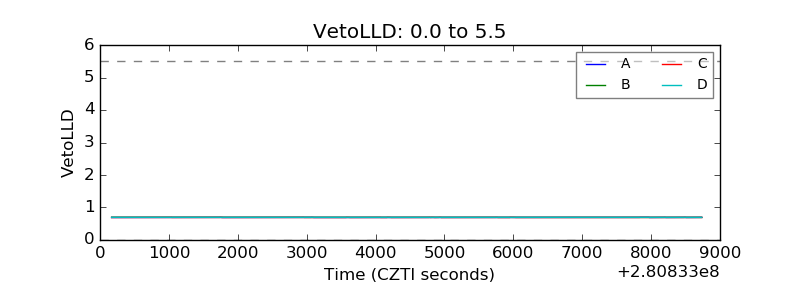 |
| Alpha Counter | 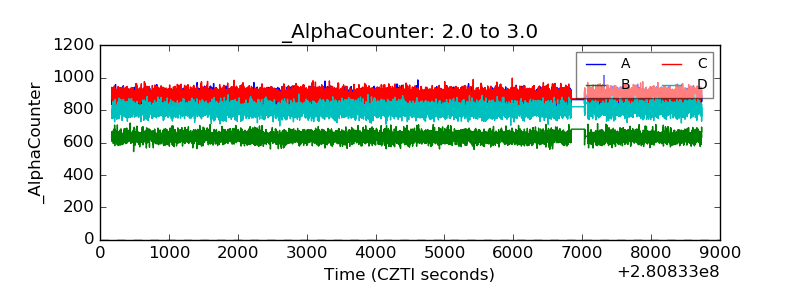 |
| _CPM_Rate | 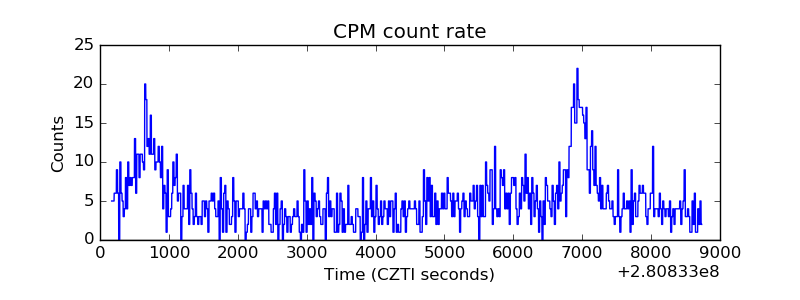 |
| CZT Counter | 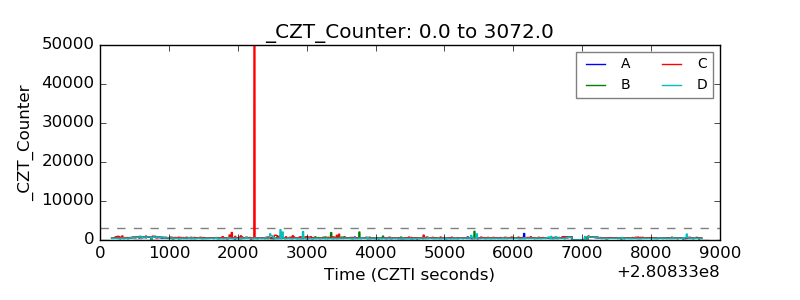 |
| +2.5 Volts monitor |  |
| +5 Volts monitor |  |
| _ROLL_ROT | 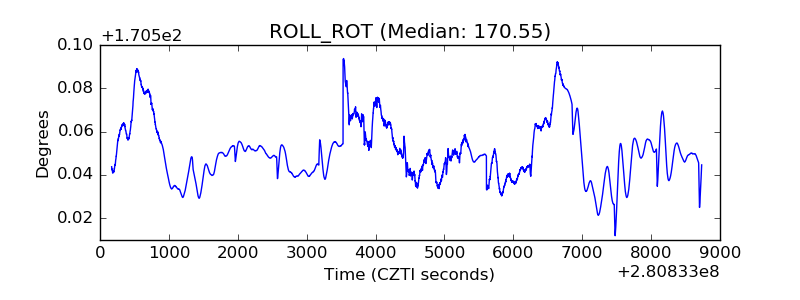 |
| _Roll_DEC | 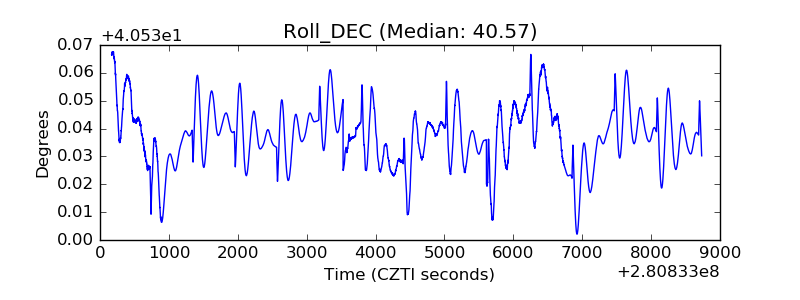 |
| _Roll_RA | 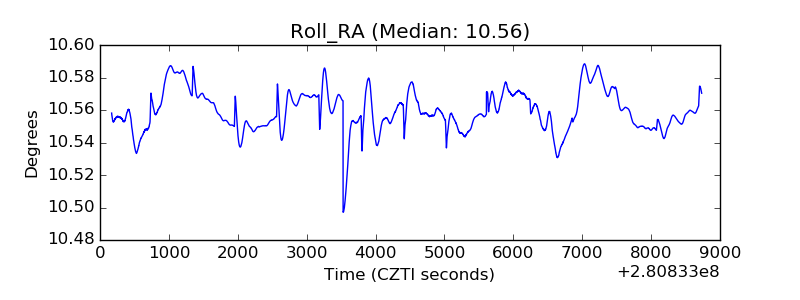 |
| Veto Counter | 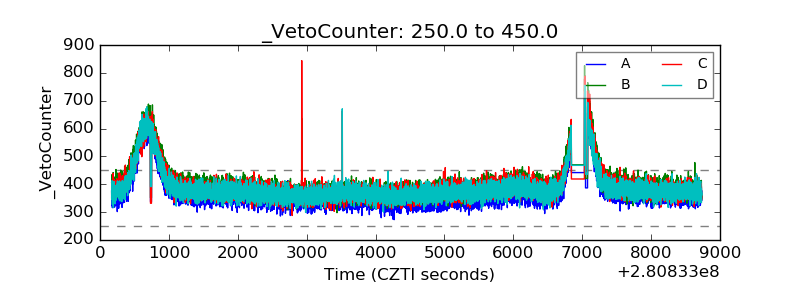 |