| Param | Original file | Final file |
|---|---|---|
| Filename | modeM0/AS1A05_004T04_9000002534_17089cztM0_level2.evt | modeM0/AS1A05_004T04_9000002534_17089cztM0_level2_quad_clean.evt |
| Size (bytes) | 170,377,920 | 46,707,840 |
| Size | 162.5 MB | 44.5 MB |
| Events in quadrant A | 1,145,000 | 314,992 |
| Events in quadrant B | 1,270,180 | 316,435 |
| Events in quadrant C | 1,318,019 | 303,099 |
| Events in quadrant D | 1,253,725 | 299,399 |
| Mode M0 | |||
|---|---|---|---|
| Quadrant | BADHDUFLAG | Total packets | Discarded packets |
| A | 0 | 5135 | 1 |
| B | 0 | 5482 | 1 |
| C | 0 | 5417 | 1 |
| D | 0 | 5420 | 1 |
| Mode SS | |||
|---|---|---|---|
| Quadrant | BADHDUFLAG | Total packets | Discarded packets |
| A | 0 | 50 | 0 |
| B | 0 | 50 | 0 |
| C | 0 | 50 | 0 |
| D | 0 | 50 | 0 |
| Mode M9 | |||
|---|---|---|---|
| Quadrant | BADHDUFLAG | Total packets | Discarded packets |
| A | 0 | 4 | 0 |
| B | 0 | 5 | 0 |
| C | 0 | 5 | 0 |
| D | 0 | 5 | 0 |
| Quadrant | Total seconds | Saturated seconds | Saturation percentage |
|---|---|---|---|
| A | 2511 | 2 | 0.079650% |
| B | 2511 | 6 | 0.238949% |
| C | 2511 | 9 | 0.358423% |
| D | 2511 | 20 | 0.796495% |
Noise dominated data is calculated using 1-second bins in cleaned event files. If a bin has >2000 counts, and if more than 50% of those come from <1% of pixels, then it is considered to be noise-dominated and hence unusable.
| Quadrant | # 1 sec bins | Bins with >0 counts | Bins with >2000 counts | High rate bins dominated by noise | Noise dominated (total time) | Noise dominated (detector-on time) | Marked lightcurve |
|---|---|---|---|---|---|---|---|
| A | 2511 | 2511 | 0 | 0 | 0.00% | 0.00% | 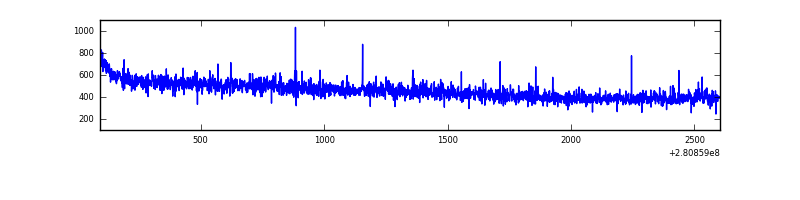 |
| B | 2511 | 2511 | 4 | 4 | 0.16% | 0.16% | 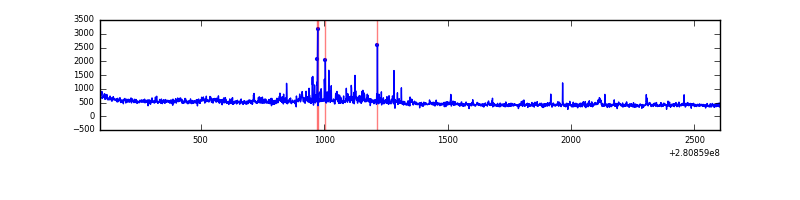 |
| C | 2511 | 2511 | 0 | 0 | 0.00% | 0.00% | 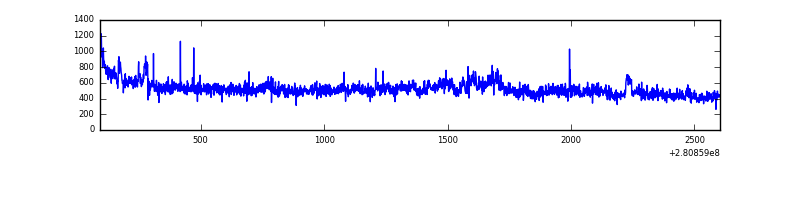 |
| D | 2511 | 2511 | 15 | 15 | 0.60% | 0.60% | 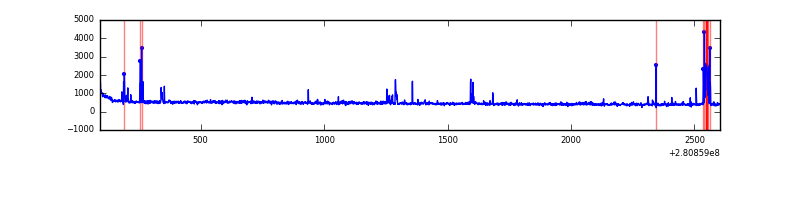 |
Top three noisy pixels from each quadrant. If the there are fewer than three noisy pixels in the level2.evt file, extra rows are filled as -1
| Pixel properties | Quadrant properties | ||||||
|---|---|---|---|---|---|---|---|
| Quadrant | DetID | PixID | Counts | Sigma | Mean | Median | Sigma |
| A | 4 | 2 | 2965 | 43.73 | 296 | 289 | 61.2 |
| A | 0 | 226 | 2693 | 39.29 | 296 | 289 | 61.2 |
| A | 12 | 194 | 2336 | 33.45 | 296 | 289 | 61.2 |
| B | 7 | 220 | 63471 | 1094.81 | 293 | 286 | 57.7 |
| B | 0 | 219 | 25217 | 431.98 | 293 | 286 | 57.7 |
| B | 0 | 197 | 12475 | 211.2 | 293 | 286 | 57.7 |
| C | 3 | 233 | 162540 | 2407.52 | 284 | 285 | 67.4 |
| C | 14 | 238 | 43237 | 637.32 | 284 | 285 | 67.4 |
| C | 9 | 54 | 2753 | 36.62 | 284 | 285 | 67.4 |
| D | 10 | 70 | 50684 | 707.0 | 291 | 282 | 71.3 |
| D | 1 | 52 | 33397 | 464.51 | 291 | 282 | 71.3 |
| D | 15 | 0 | 25523 | 354.06 | 291 | 282 | 71.3 |
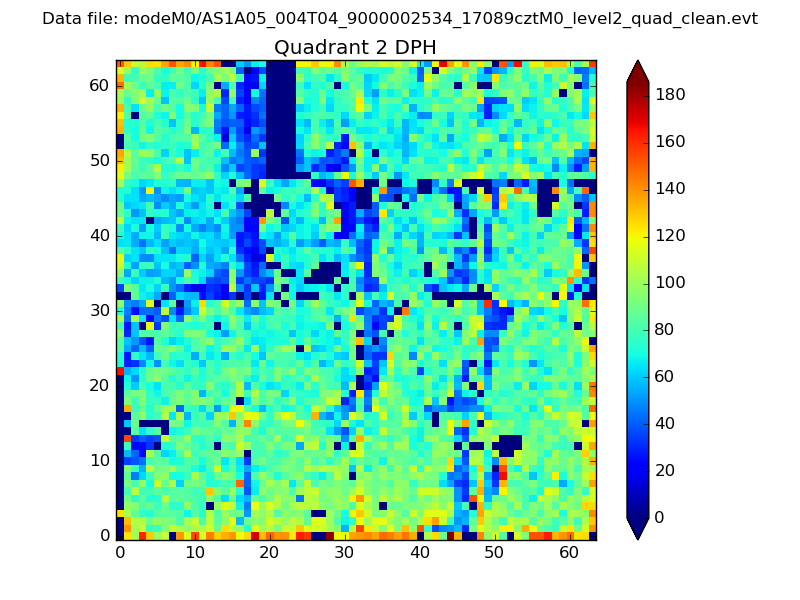
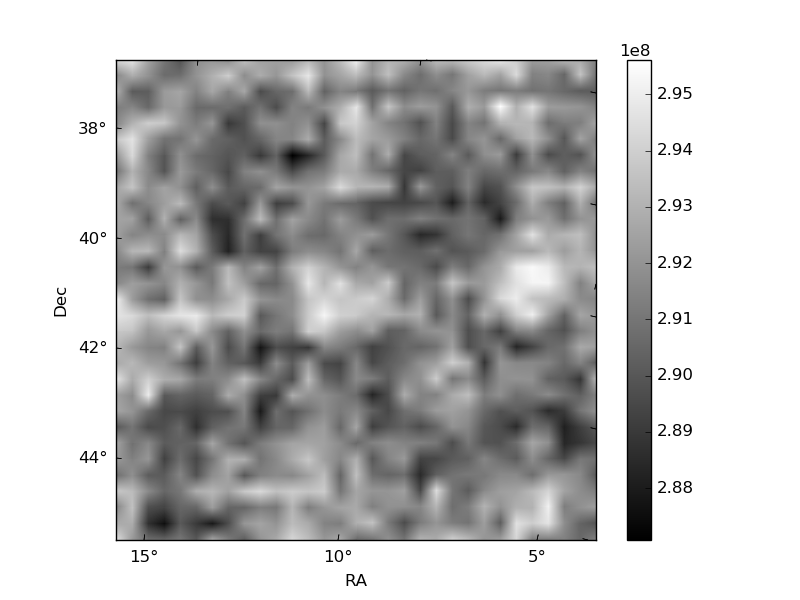
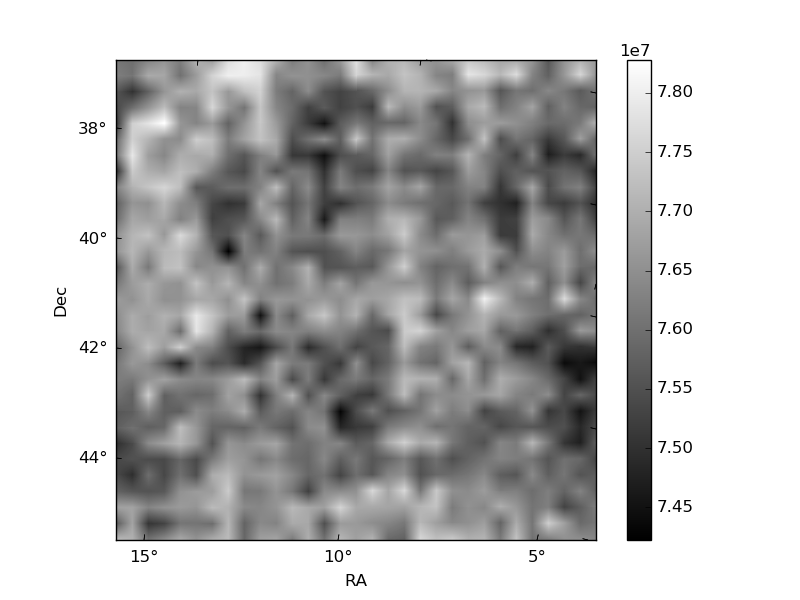
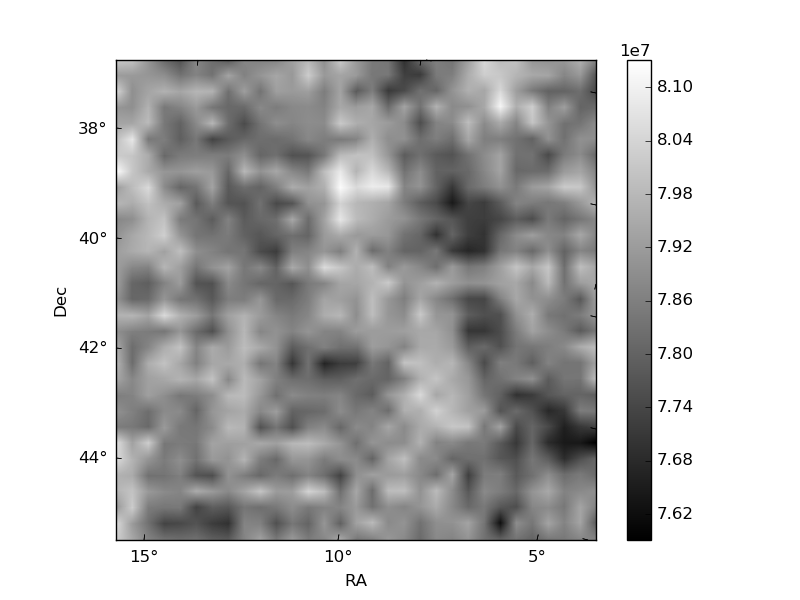
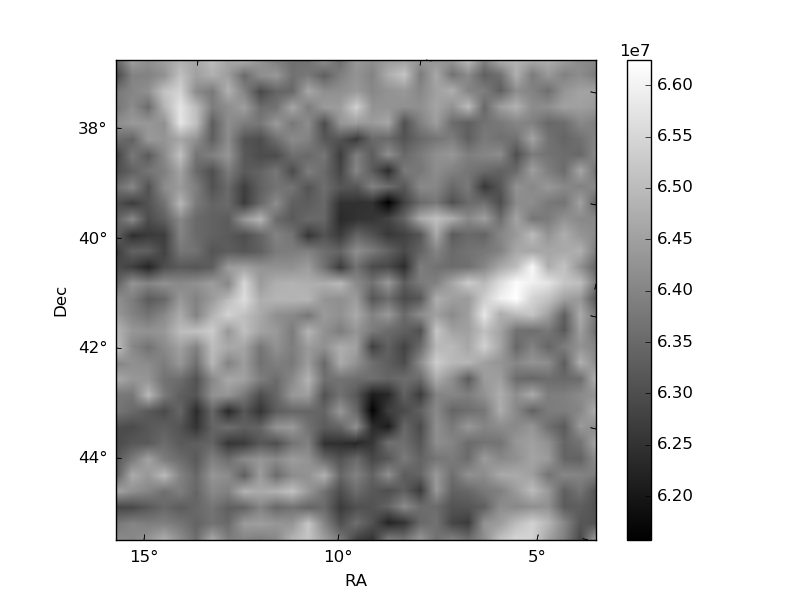
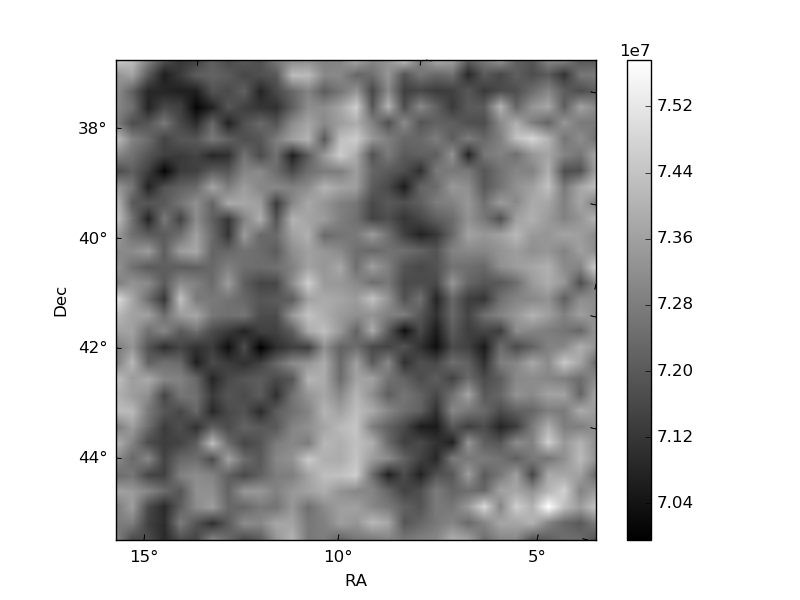
Histogram calculated using DETX and DETY for each event in the final _common_clean file
| Quadrant A | 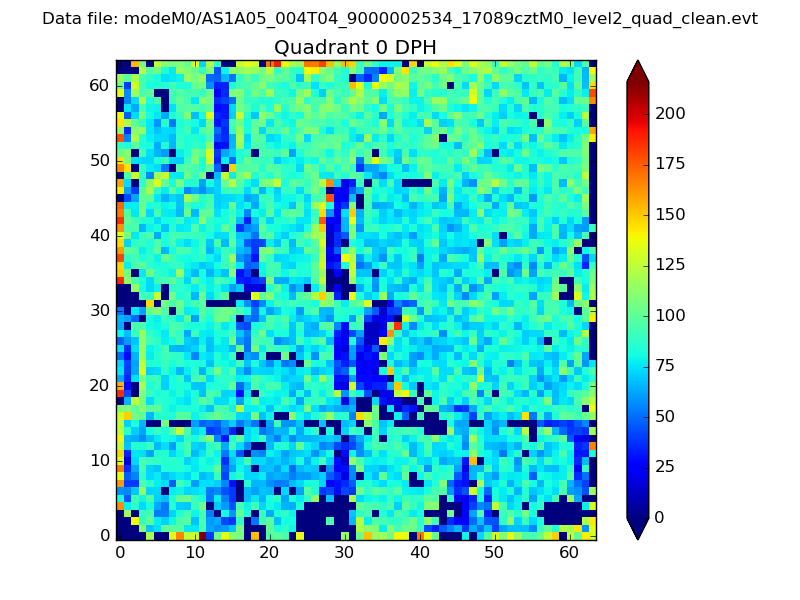 |
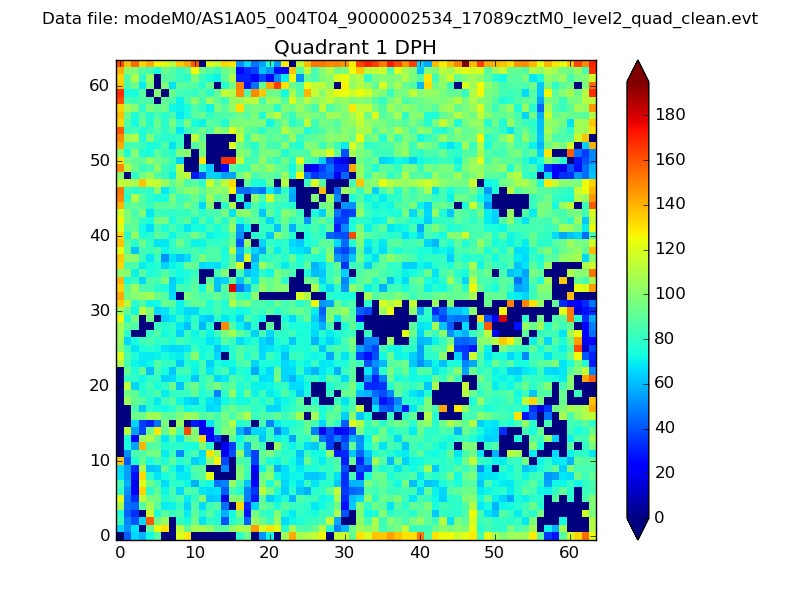 |
Quadrant B |
|---|---|---|---|
| Quadrant D | 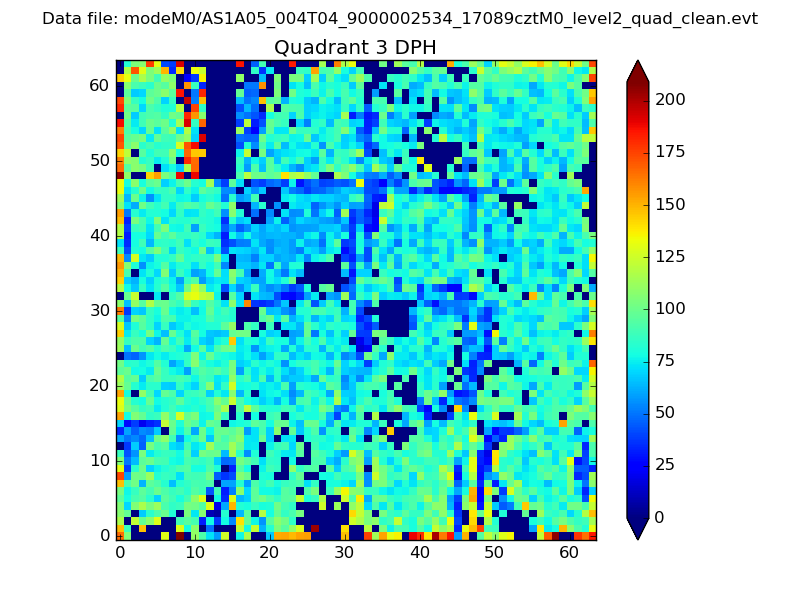 |
 |
Quadrant C |
| Plot type | Count rate plots | Images |
|---|---|---|
| Comparison with Poisson distribution Blue bars denote a histogram of data divided into 1 sec bins. Red curve is a Poisson curve with rate = median count rate of data. |
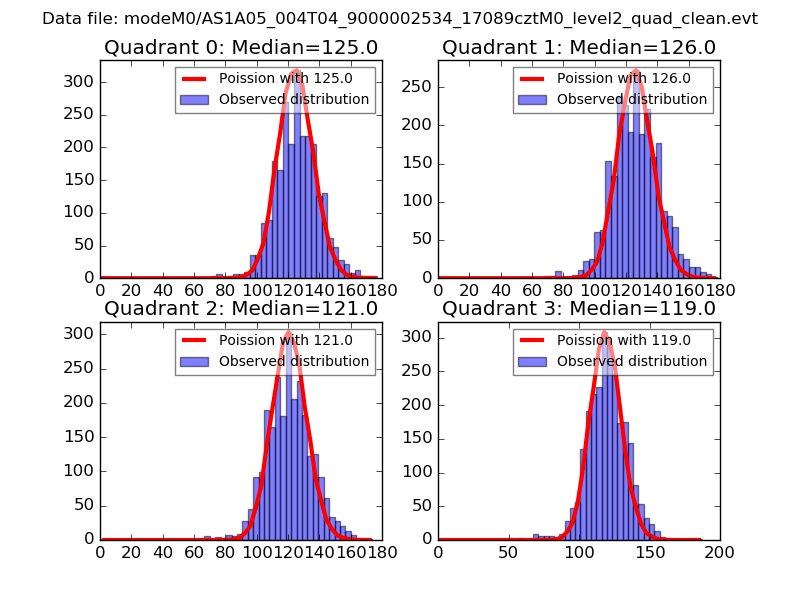 |
 |
| Quadrant-wise count rates Data is divided into 100 sec bins |
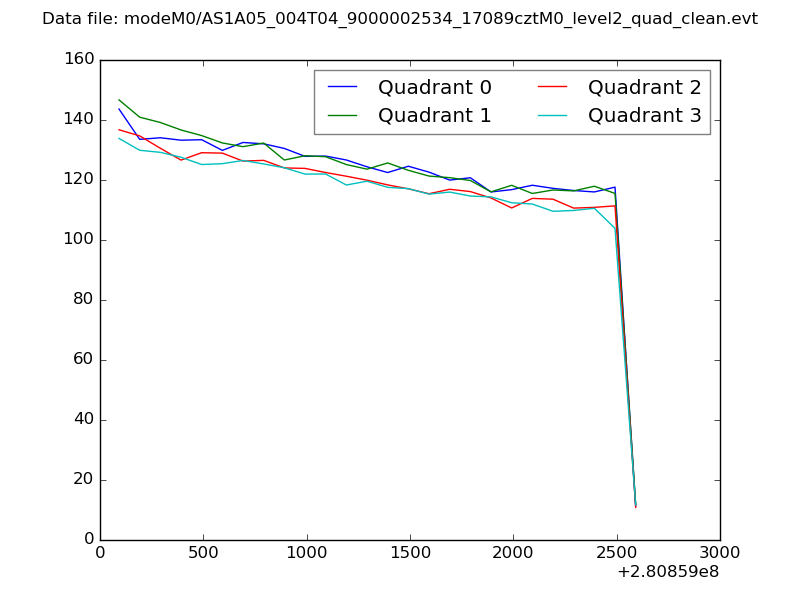 |
|
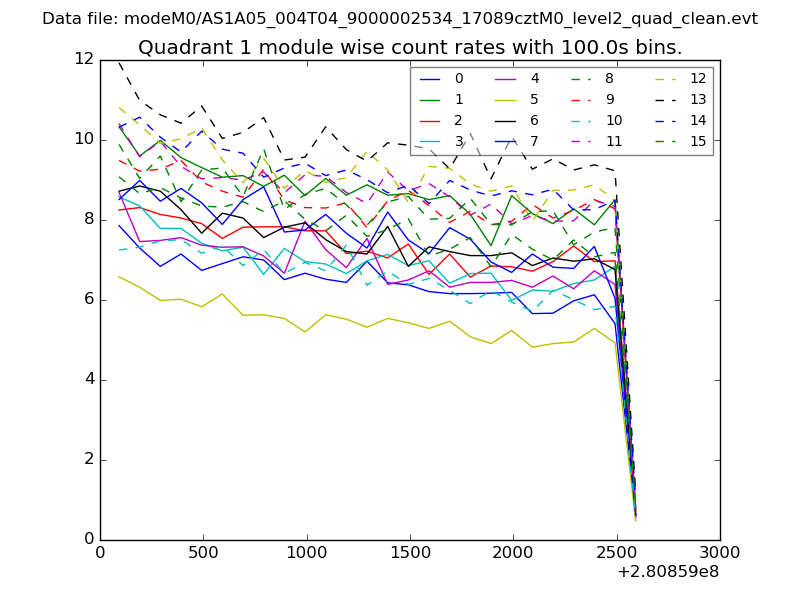
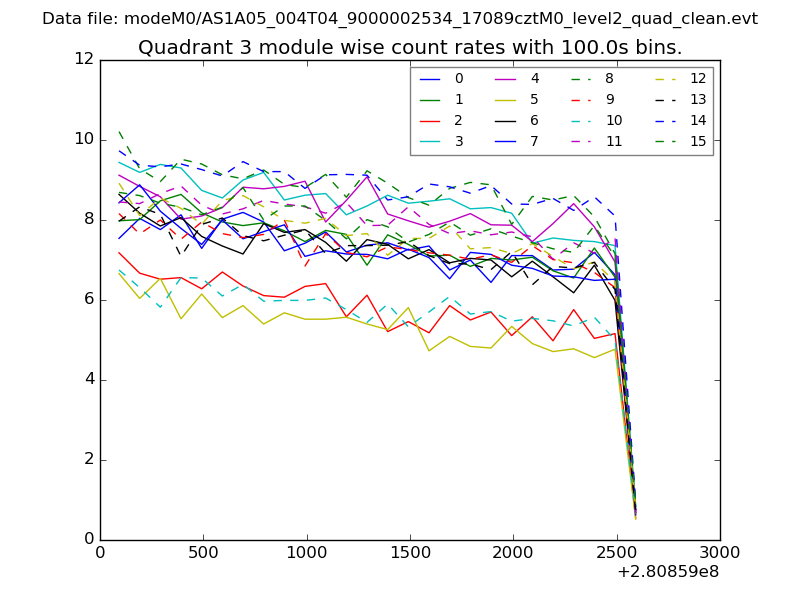
| Module-wise count rates for Quadrant A Data is divided into 100 sec bins |
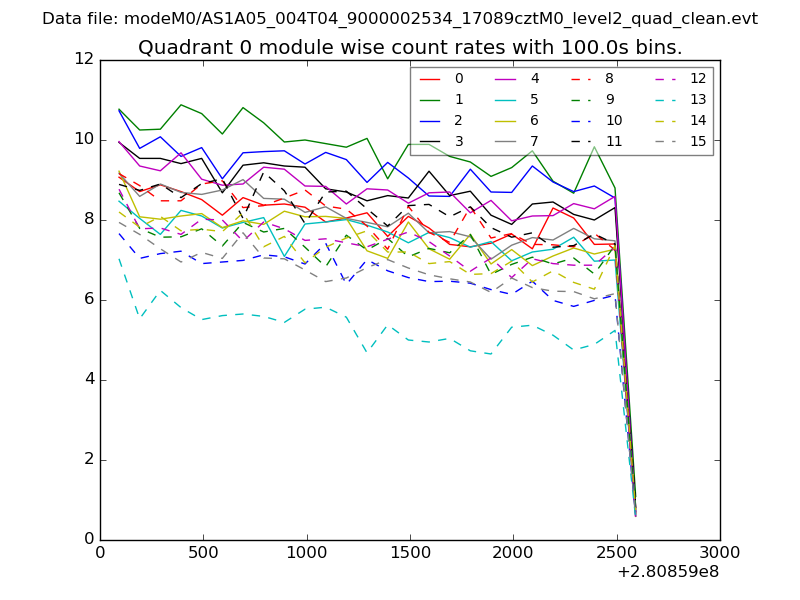 |
 |
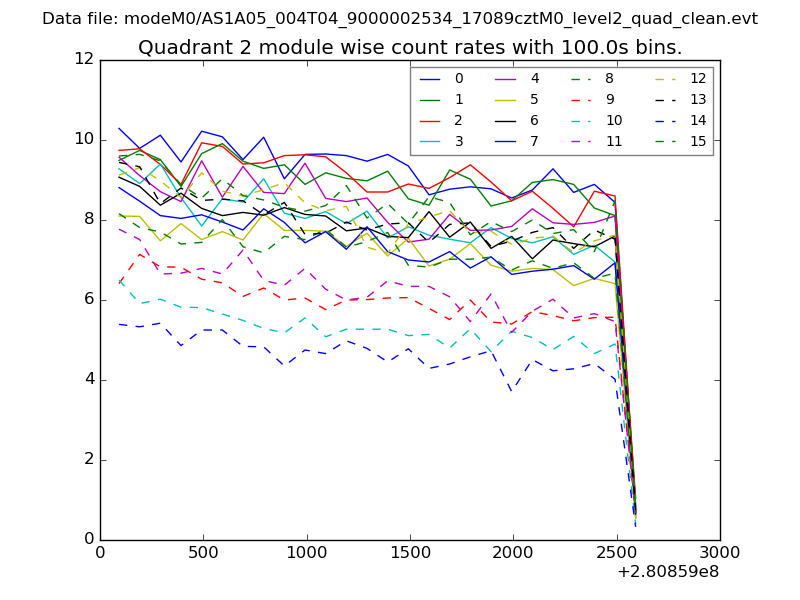
| Module-wise count rates for Quadrant B Data is divided into 100 sec bins |
 |
 |
| Module-wise count rates for Quadrant C Data is divided into 100 sec bins |
 |
 |
| Module-wise count rates for Quadrant D Data is divided into 100 sec bins |
 |
 |
| Parameter | Plot |
|---|---|
| CZT HV Monitor | 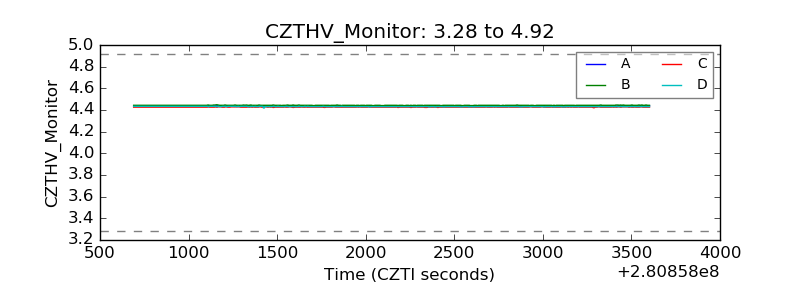 |
| D_VDD | 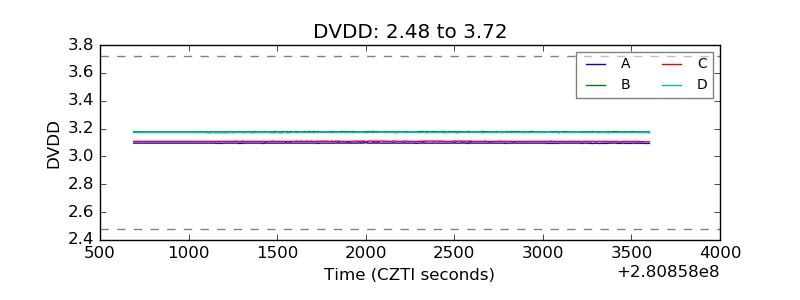 |
| Temperature 1 | 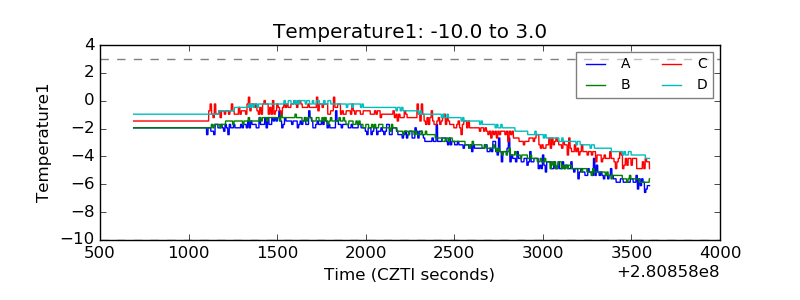 |
| Veto HV Monitor | 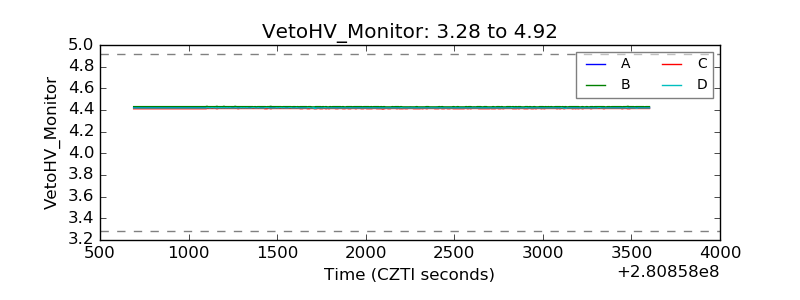 |
| Veto LLD | 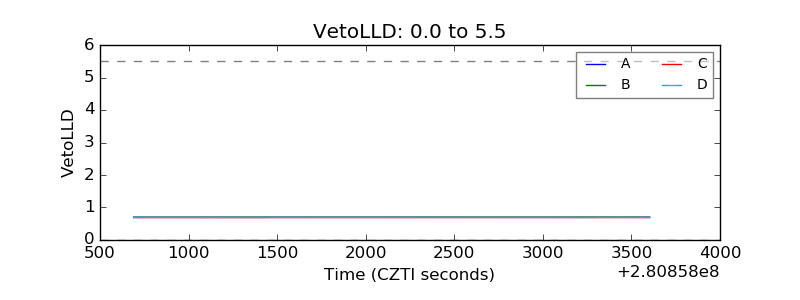 |
| Alpha Counter | 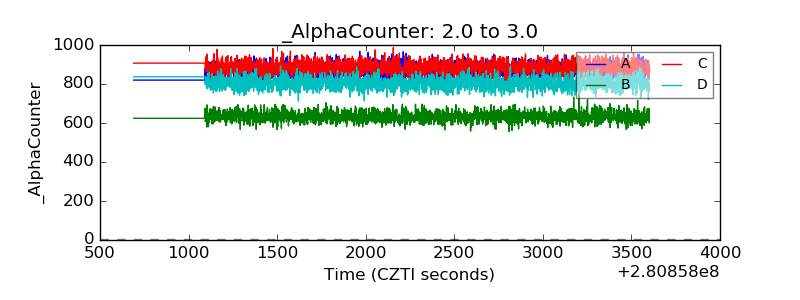 |
| _CPM_Rate | 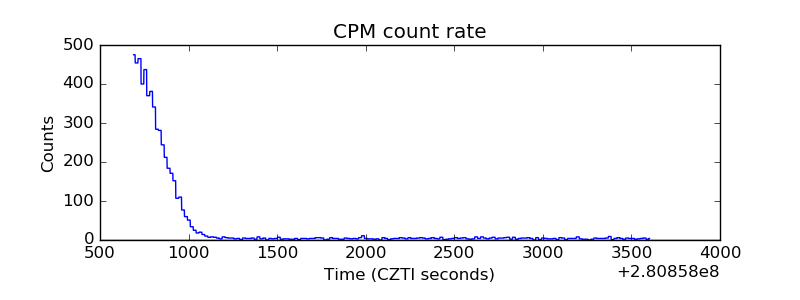 |
| CZT Counter |  |
| +2.5 Volts monitor |  |
| +5 Volts monitor | 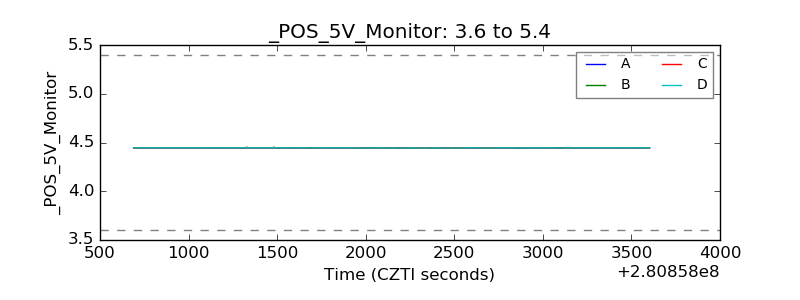 |
| _ROLL_ROT | 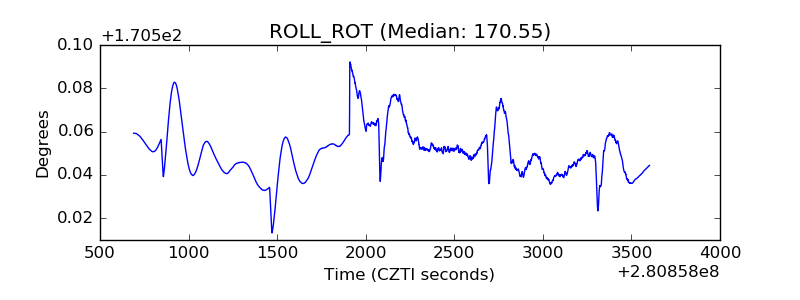 |
| _Roll_DEC | 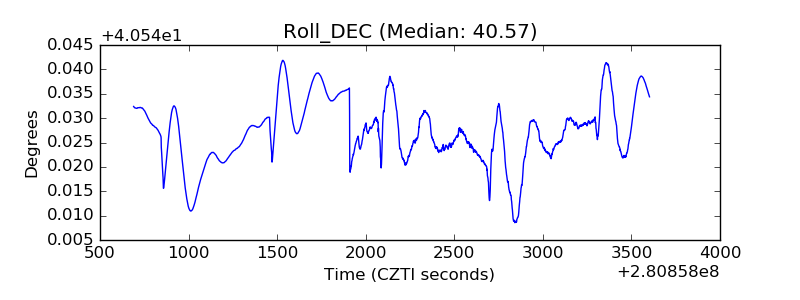 |
| _Roll_RA | 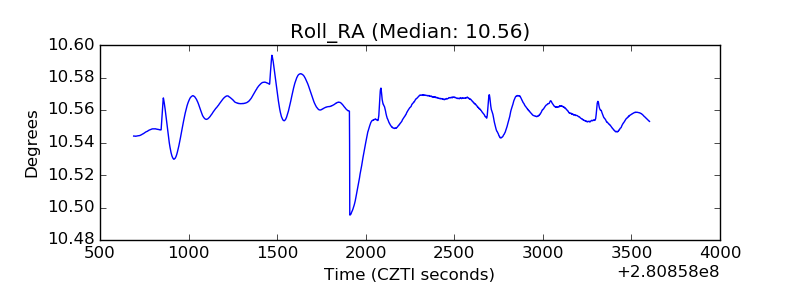 |
| Veto Counter | 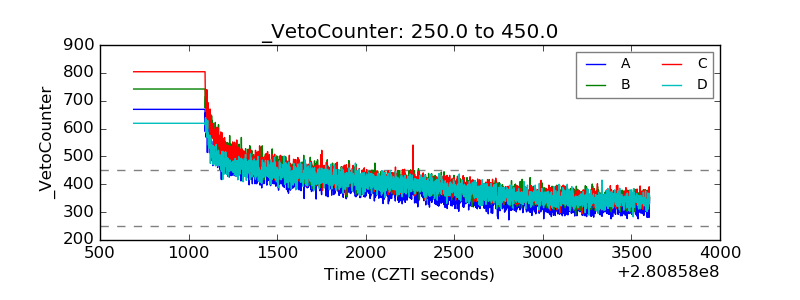 |