| Param | Original file | Final file |
|---|---|---|
| Filename | modeM0/AS1A05_004T06_9000002536cztM0_level2.fits | modeM0/AS1A05_004T06_9000002536cztM0_level2_quad_clean.evt |
| Size (bytes) | 675,190,080 | 609,433,920 |
| Size | 643.9 MB | 581.2 MB |
| Events in quadrant A | 4,126,062 | 3,569,923 |
| Events in quadrant B | 3,975,812 | 3,567,776 |
| Events in quadrant C | 4,010,118 | 3,378,749 |
| Events in quadrant D | 3,508,642 | 3,112,545 |
| Mode SS | |||
|---|---|---|---|
| Quadrant | BADHDUFLAG | Total packets | Discarded packets |
| A | 0 | 1432 | 0 |
| B | 0 | 1432 | 0 |
| C | 0 | 1432 | 0 |
| D | 0 | 1432 | 0 |
| Mode M0 | |||
|---|---|---|---|
| Quadrant | BADHDUFLAG | Total packets | Discarded packets |
| A | 0 | 145084 | 0 |
| B | 0 | 150329 | 0 |
| C | 0 | 146687 | 0 |
| D | 0 | 154300 | 0 |
| Mode M9 | |||
|---|---|---|---|
| Quadrant | BADHDUFLAG | Total packets | Discarded packets |
| A | 0 | 112 | 0 |
| B | 0 | 112 | 0 |
| C | 0 | 112 | 0 |
| D | 0 | 112 | 0 |
| Quadrant | Total seconds | Saturated seconds | Saturation percentage |
|---|---|---|---|
| A | 70394 | 912 | 1.295565% |
| B | 70394 | 1211 | 1.720317% |
| C | 70394 | 1116 | 1.585362% |
| D | 70394 | 1117 | 1.586783% |
Noise dominated data is calculated using 1-second bins in cleaned event files. If a bin has >2000 counts, and if more than 50% of those come from <1% of pixels, then it is considered to be noise-dominated and hence unusable.
| Quadrant | # 1 sec bins | Bins with >0 counts | Bins with >2000 counts | High rate bins dominated by noise | Noise dominated (total time) | Noise dominated (detector-on time) | Marked lightcurve |
|---|---|---|---|---|---|---|---|
| A | 81554 | 70389 | 0 | 0 | 0.00% | 0.00% |  |
| B | 81554 | 70391 | 0 | 0 | 0.00% | 0.00% |  |
| C | 81554 | 70392 | 0 | 0 | 0.00% | 0.00% |  |
| D | 81554 | 70383 | 0 | 0 | 0.00% | 0.00% |  |
Top three noisy pixels from each quadrant. If the there are fewer than three noisy pixels in the level2.evt file, extra rows are filled as -1
| Pixel properties | Quadrant properties | ||||||
|---|---|---|---|---|---|---|---|
| Quadrant | DetID | PixID | Counts | Sigma | Mean | Median | Sigma |
| A | 0 | 29 | 3956 | 11.11 | 1071 | 1006 | 265.6 |
| A | 7 | 110 | 3485 | 9.33 | 1071 | 1006 | 265.6 |
| A | 0 | 30 | 3238 | 8.4 | 1071 | 1006 | 265.6 |
| B | 2 | 9 | 3211 | 10.73 | 1051 | 1002 | 205.8 |
| B | 2 | 8 | 2746 | 8.47 | 1051 | 1002 | 205.8 |
| B | 5 | 128 | 2663 | 8.07 | 1051 | 1002 | 205.8 |
| C | 12 | 241 | 2853 | 6.81 | 1061 | 989 | 273.8 |
| C | 2 | 191 | 2713 | 6.3 | 1061 | 989 | 273.8 |
| C | 3 | 126 | 2677 | 6.17 | 1061 | 989 | 273.8 |
| D | 3 | 14 | 2706 | 6.72 | 1000 | 909 | 267.6 |
| D | 6 | 231 | 2498 | 5.94 | 1000 | 909 | 267.6 |
| D | 6 | 67 | 2483 | 5.88 | 1000 | 909 | 267.6 |
Histogram calculated using DETX and DETY for each event in the final _common_clean file
| Quadrant A | 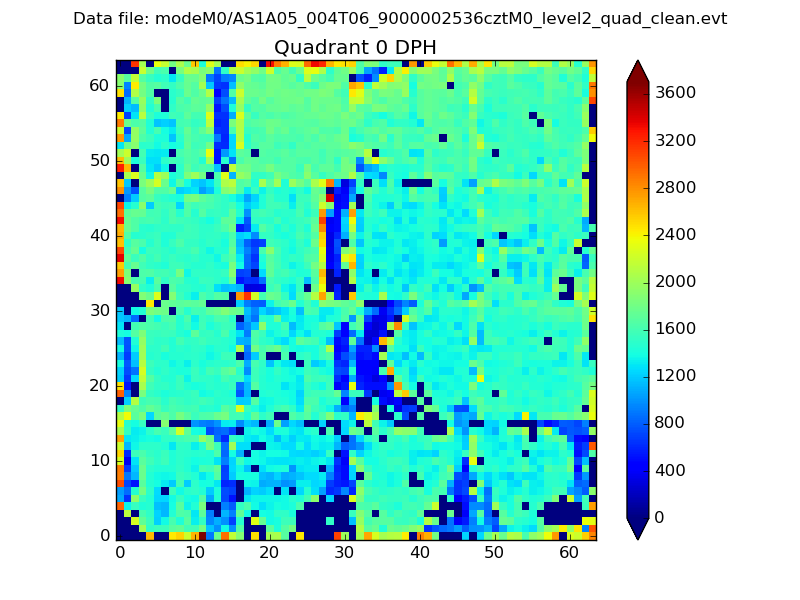 |
 |
Quadrant B |
|---|---|---|---|
| Quadrant D | 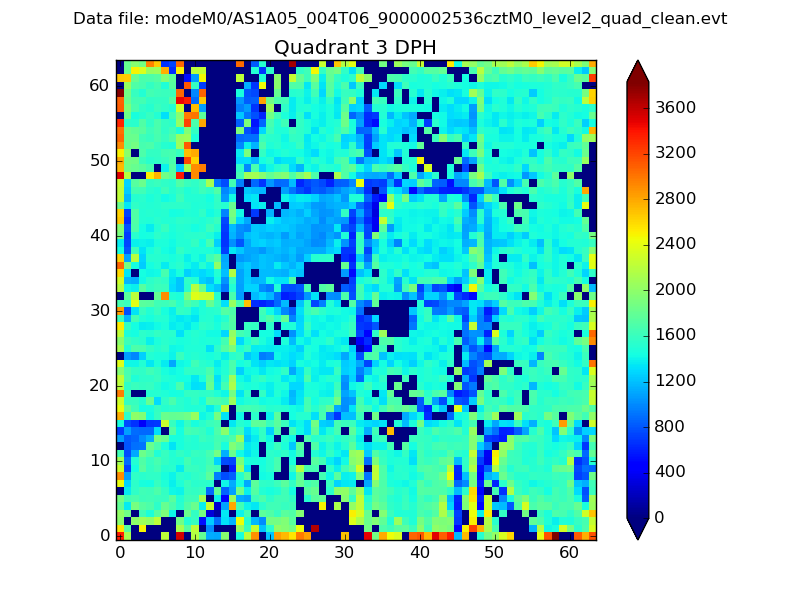 |
 |
Quadrant C |
| Plot type | Count rate plots | Images |
|---|---|---|
| Comparison with Poisson distribution Blue bars denote a histogram of data divided into 1 sec bins. Red curve is a Poisson curve with rate = median count rate of data. |
 |
 |
| Quadrant-wise count rates Data is divided into 100 sec bins |
 |
|
| Module-wise count rates for Quadrant A Data is divided into 100 sec bins |
 |
 |
| Module-wise count rates for Quadrant B Data is divided into 100 sec bins |
 |
 |
| Module-wise count rates for Quadrant C Data is divided into 100 sec bins |
 |
 |
| Module-wise count rates for Quadrant D Data is divided into 100 sec bins |
 |
 |
| Parameter | Plot |
|---|---|
| CZT HV Monitor |  |
| D_VDD |  |
| Temperature 1 |  |
| Veto HV Monitor |  |
| Veto LLD |  |
| Alpha Counter |  |
| _CPM_Rate |  |
| CZT Counter |  |
| +2.5 Volts monitor |  |
| +5 Volts monitor |  |
| _ROLL_ROT |  |
| _Roll_DEC |  |
| _Roll_RA |  |
| Veto Counter |  |