| Param | Original file | Final file |
|---|---|---|
| Filename | modeM0/AS1A05_004T06_9000002536_17089cztM0_level2.evt | modeM0/AS1A05_004T06_9000002536_17089cztM0_level2_quad_clean.evt |
| Size (bytes) | 257,713,920 | 40,677,120 |
| Size | 245.8 MB | 38.8 MB |
| Events in quadrant A | 1,786,581 | 245,502 |
| Events in quadrant B | 1,888,376 | 246,879 |
| Events in quadrant C | 1,918,305 | 236,421 |
| Events in quadrant D | 1,952,705 | 234,924 |
| Mode SS | |||
|---|---|---|---|
| Quadrant | BADHDUFLAG | Total packets | Discarded packets |
| A | 0 | 78 | 0 |
| B | 0 | 78 | 0 |
| C | 0 | 78 | 0 |
| D | 0 | 78 | 0 |
| Mode M0 | |||
|---|---|---|---|
| Quadrant | BADHDUFLAG | Total packets | Discarded packets |
| A | 0 | 7810 | 1 |
| B | 0 | 8131 | 1 |
| C | 0 | 8032 | 1 |
| D | 0 | 8335 | 1 |
| Mode M9 | |||
|---|---|---|---|
| Quadrant | BADHDUFLAG | Total packets | Discarded packets |
| A | 0 | 10 | 0 |
| B | 0 | 10 | 0 |
| C | 0 | 10 | 0 |
| D | 0 | 10 | 0 |
| Quadrant | Total seconds | Saturated seconds | Saturation percentage |
|---|---|---|---|
| A | 3785 | 29 | 0.766182% |
| B | 3784 | 39 | 1.030655% |
| C | 3784 | 49 | 1.294926% |
| D | 3784 | 37 | 0.977801% |
Noise dominated data is calculated using 1-second bins in cleaned event files. If a bin has >2000 counts, and if more than 50% of those come from <1% of pixels, then it is considered to be noise-dominated and hence unusable.
| Quadrant | # 1 sec bins | Bins with >0 counts | Bins with >2000 counts | High rate bins dominated by noise | Noise dominated (total time) | Noise dominated (detector-on time) | Marked lightcurve |
|---|---|---|---|---|---|---|---|
| A | 4770 | 3786 | 0 | 0 | 0.00% | 0.00% | 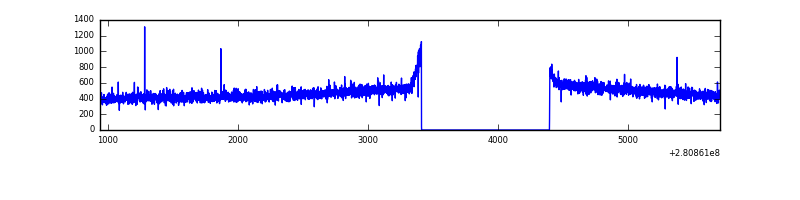 |
| B | 4769 | 3785 | 3 | 3 | 0.06% | 0.08% | 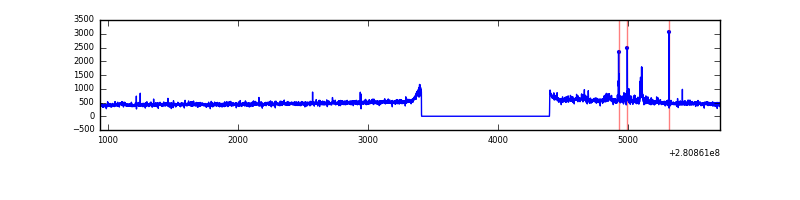 |
| C | 4769 | 3784 | 0 | 0 | 0.00% | 0.00% | 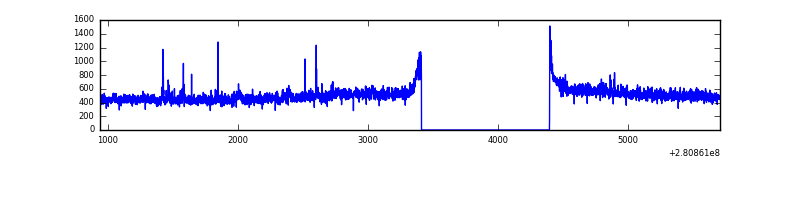 |
| D | 4769 | 3784 | 10 | 10 | 0.21% | 0.26% | 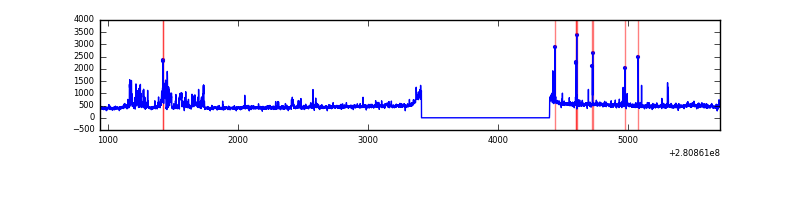 |
Top three noisy pixels from each quadrant. If the there are fewer than three noisy pixels in the level2.evt file, extra rows are filled as -1
| Pixel properties | Quadrant properties | ||||||
|---|---|---|---|---|---|---|---|
| Quadrant | DetID | PixID | Counts | Sigma | Mean | Median | Sigma |
| A | 0 | 226 | 4061 | 37.72 | 464 | 452 | 95.7 |
| A | 12 | 194 | 3394 | 30.75 | 464 | 452 | 95.7 |
| A | 3 | 137 | 3310 | 29.87 | 464 | 452 | 95.7 |
| B | 7 | 220 | 42496 | 473.34 | 463 | 452 | 88.8 |
| B | 0 | 219 | 12844 | 139.51 | 463 | 452 | 88.8 |
| B | 12 | 111 | 10553 | 113.72 | 463 | 452 | 88.8 |
| C | 3 | 233 | 95771 | 902.59 | 446 | 450 | 105.6 |
| C | 14 | 238 | 67500 | 634.9 | 446 | 450 | 105.6 |
| C | 9 | 54 | 16080 | 148.0 | 446 | 450 | 105.6 |
| D | 1 | 52 | 129152 | 1164.92 | 451 | 437 | 110.5 |
| D | 5 | 222 | 70215 | 631.52 | 451 | 437 | 110.5 |
| D | 15 | 0 | 24269 | 215.69 | 451 | 437 | 110.5 |
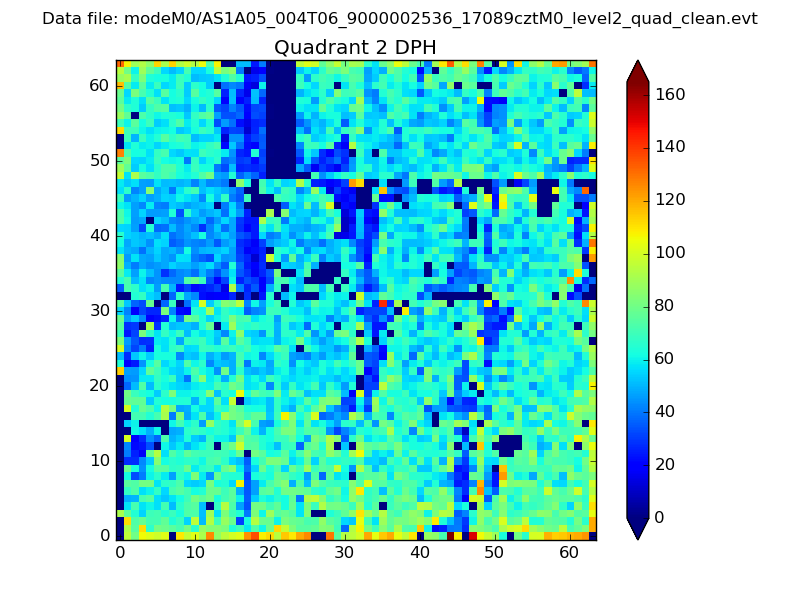
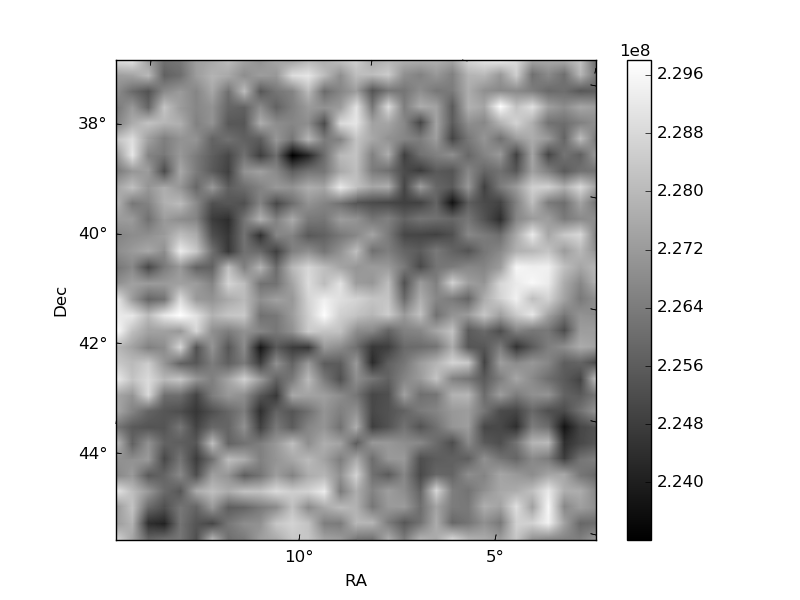
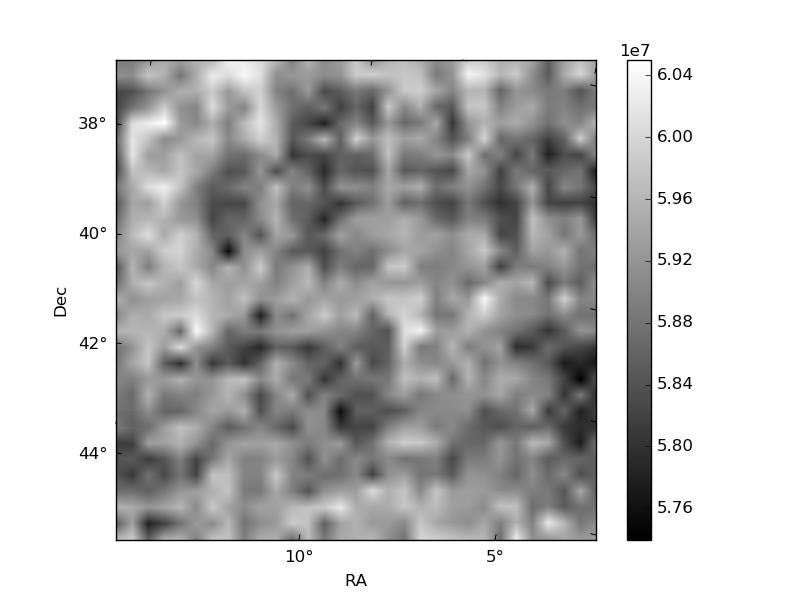
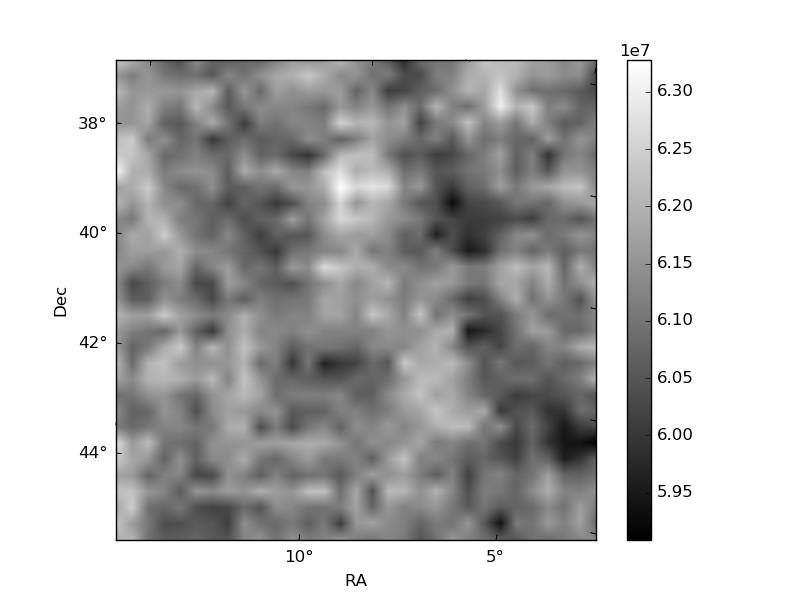
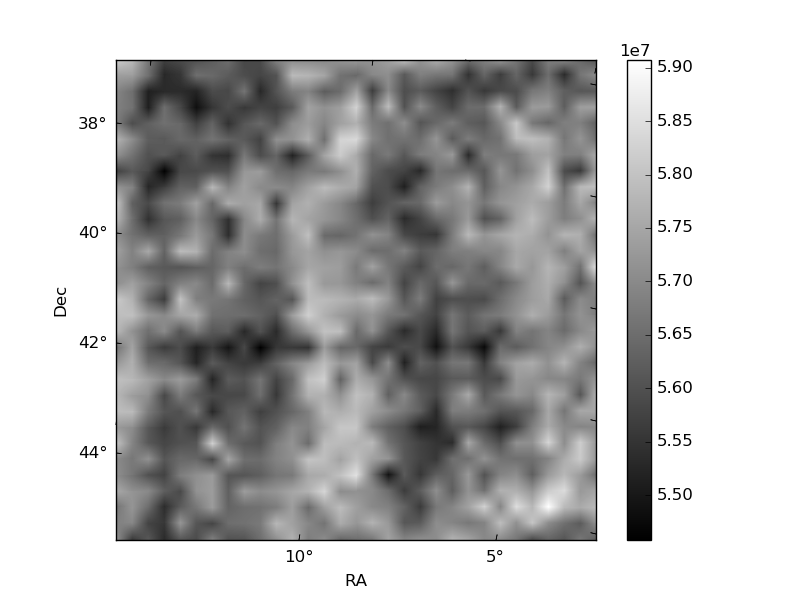
Histogram calculated using DETX and DETY for each event in the final _common_clean file
| Quadrant A | 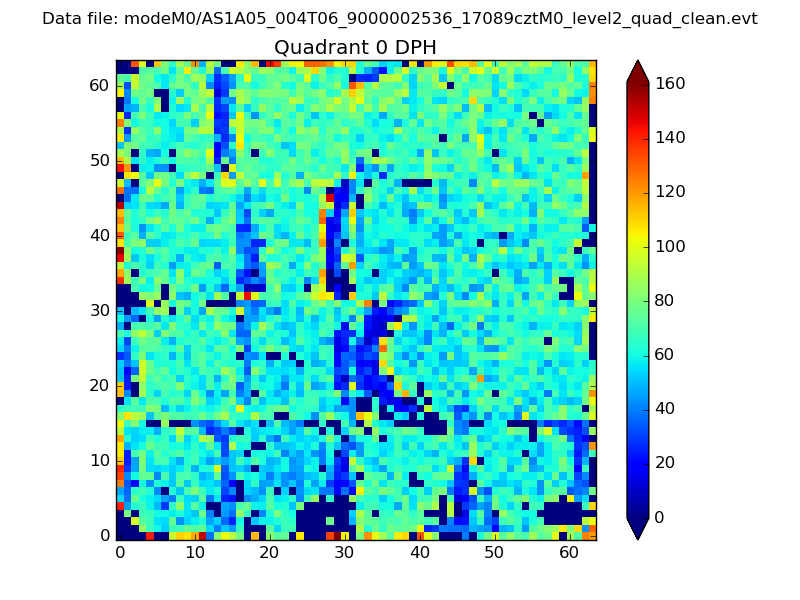 |
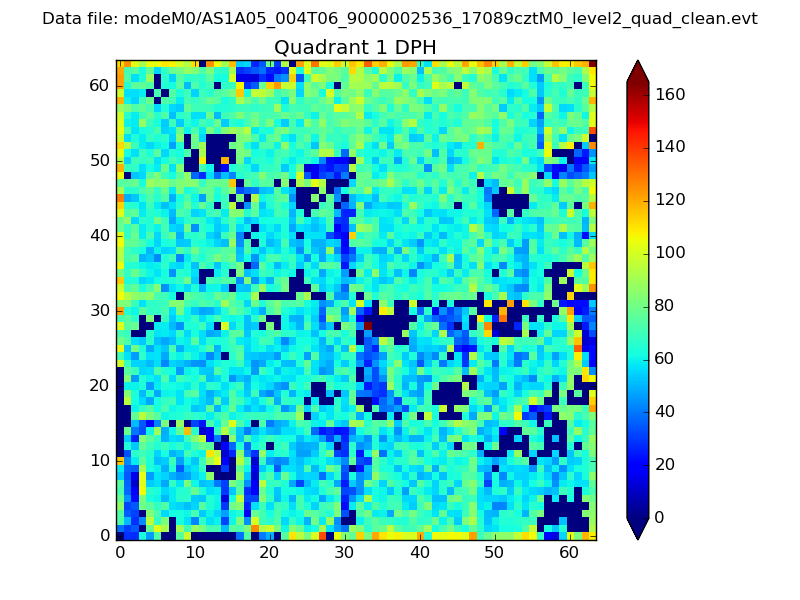 |
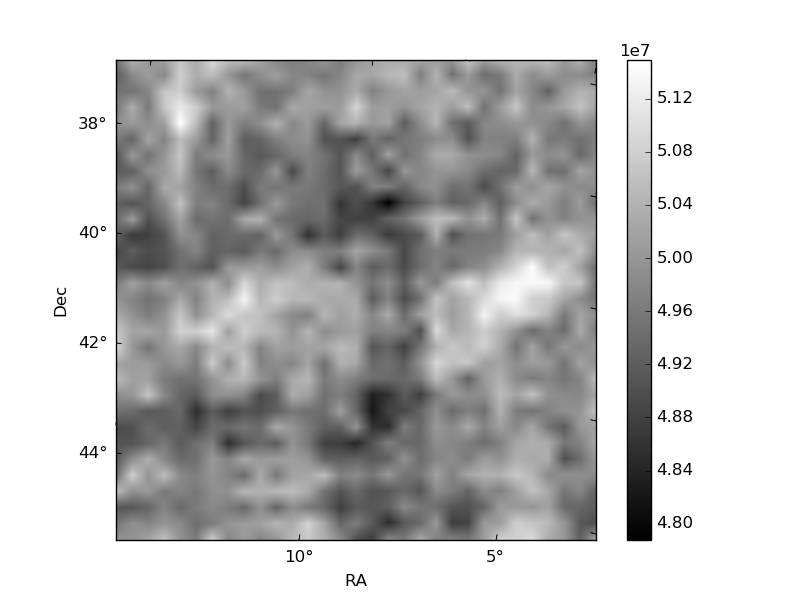
Quadrant B |
|---|---|---|---|
| Quadrant D | 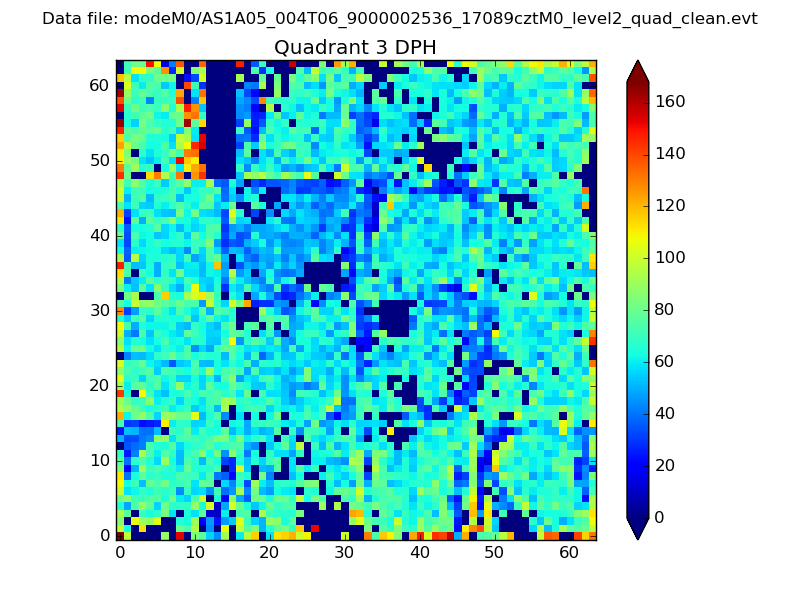 |
 |
Quadrant C |
| Plot type | Count rate plots | Images |
|---|---|---|
| Comparison with Poisson distribution Blue bars denote a histogram of data divided into 1 sec bins. Red curve is a Poisson curve with rate = median count rate of data. |
 |
 |
| Quadrant-wise count rates Data is divided into 100 sec bins |
 |
|
| Module-wise count rates for Quadrant A Data is divided into 100 sec bins |
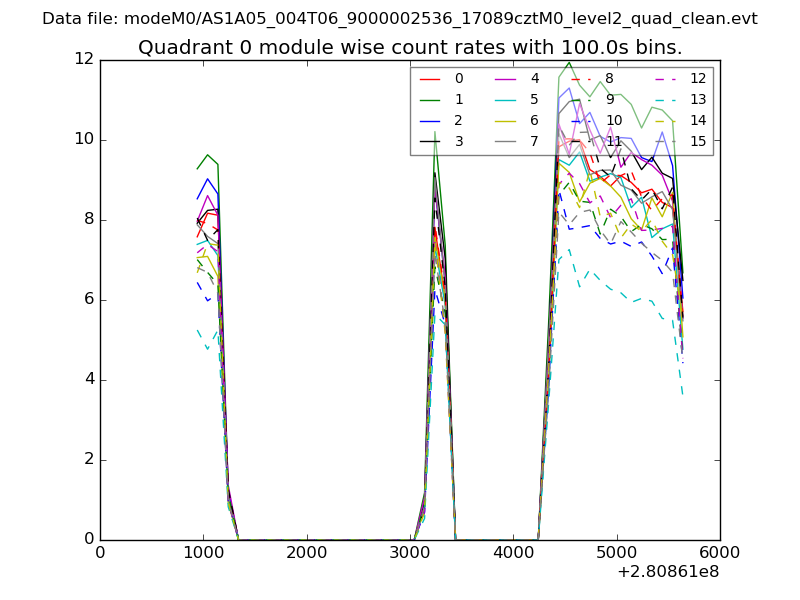 |
 |
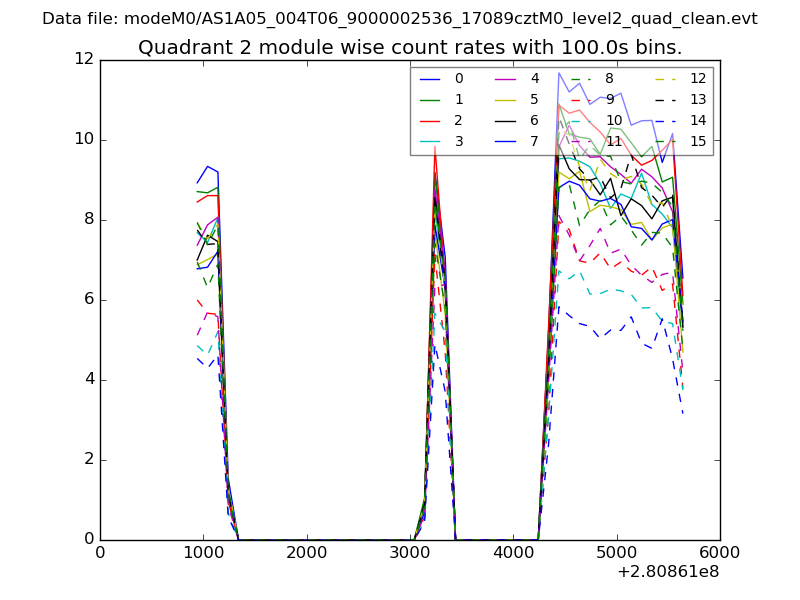
| Module-wise count rates for Quadrant B Data is divided into 100 sec bins |
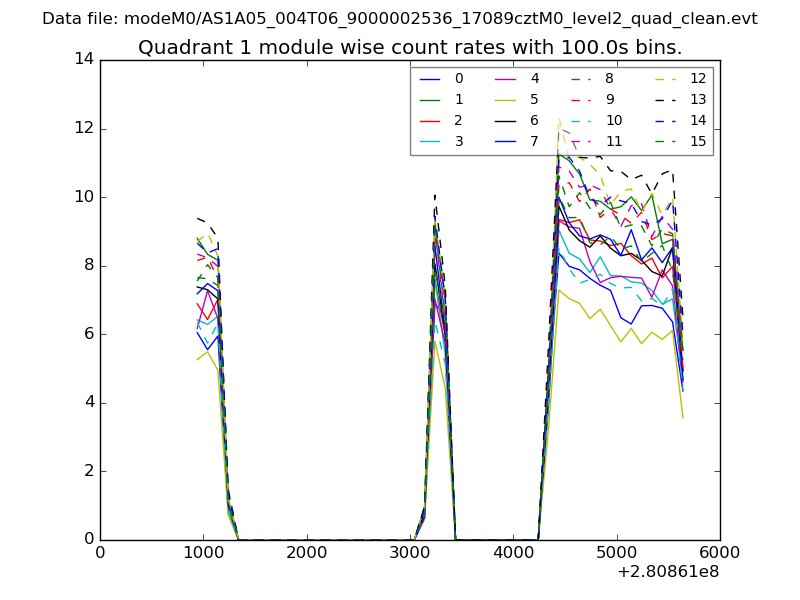 |
 |
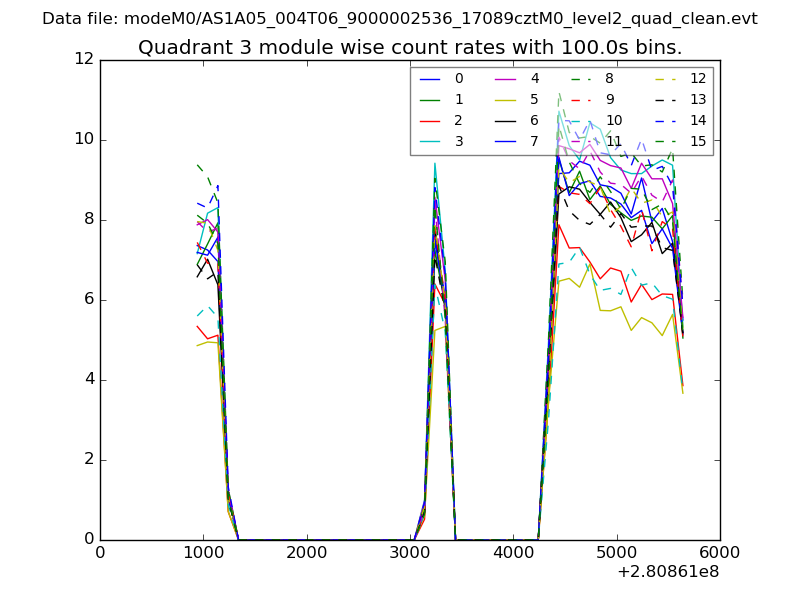
| Module-wise count rates for Quadrant C Data is divided into 100 sec bins |
 |
 |
| Module-wise count rates for Quadrant D Data is divided into 100 sec bins |
 |
 |
| Parameter | Plot |
|---|---|
| CZT HV Monitor | 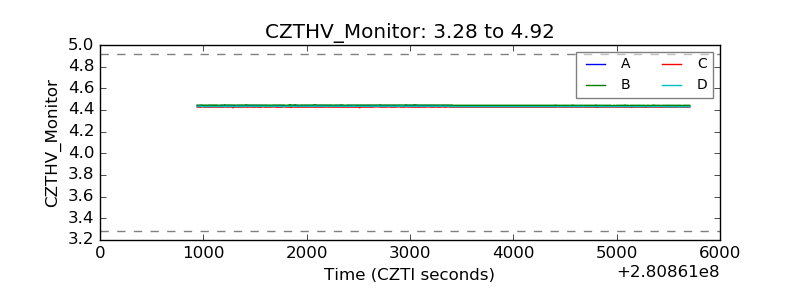 |
| D_VDD | 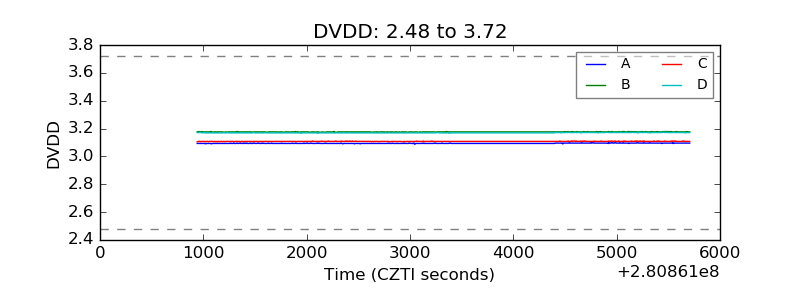 |
| Temperature 1 | 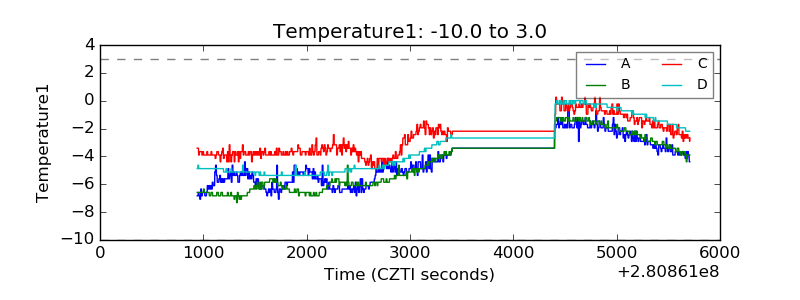 |
| Veto HV Monitor |  |
| Veto LLD | 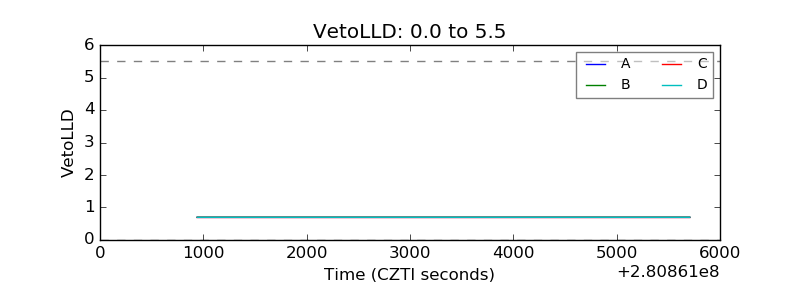 |
| Alpha Counter | 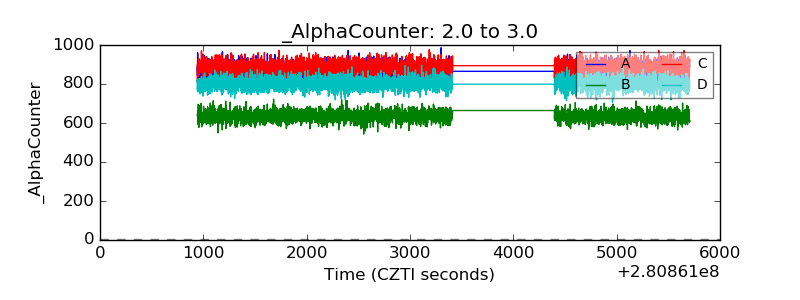 |
| _CPM_Rate |  |
| CZT Counter | 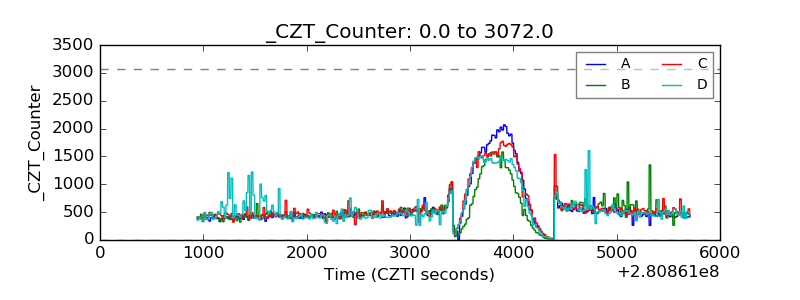 |
| +2.5 Volts monitor |  |
| +5 Volts monitor |  |
| _ROLL_ROT | 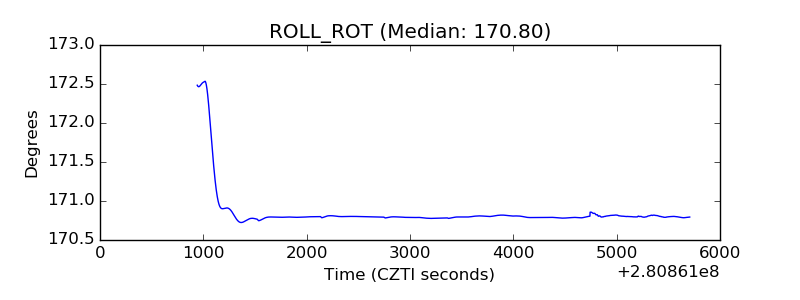 |
| _Roll_DEC | 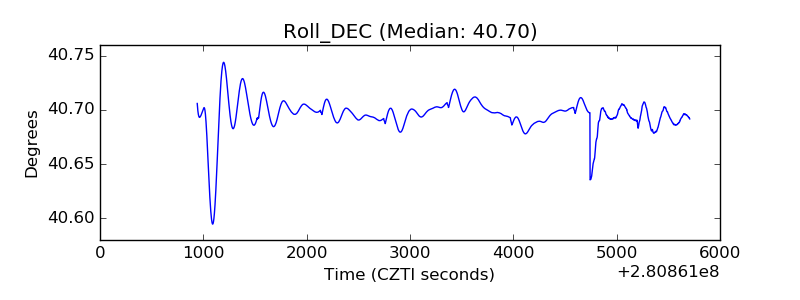 |
| _Roll_RA | 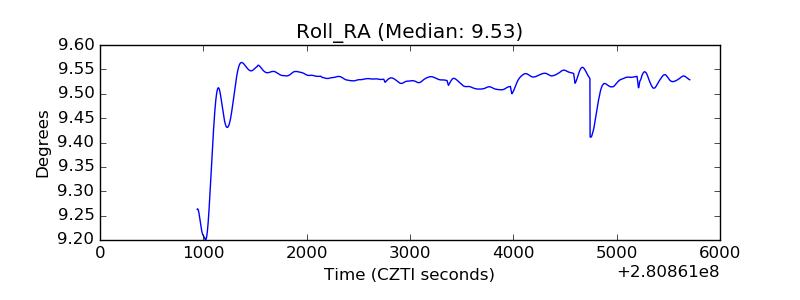 |
| Veto Counter | 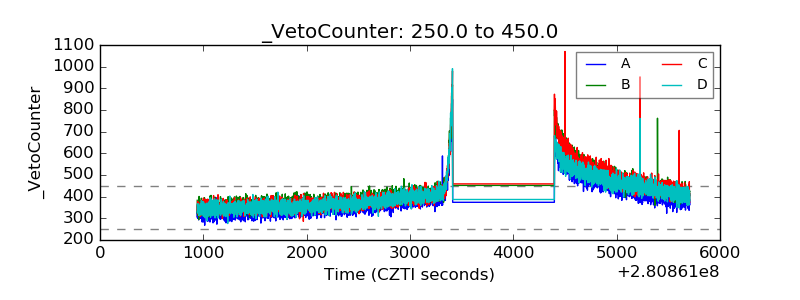 |