| Param | Original file | Final file |
|---|---|---|
| Filename | modeM0/AS1A05_004T06_9000002536_17091cztM0_level2.evt | modeM0/AS1A05_004T06_9000002536_17091cztM0_level2_quad_clean.evt |
| Size (bytes) | 441,077,760 | 94,645,440 |
| Size | 420.6 MB | 90.3 MB |
| Events in quadrant A | 3,028,183 | 614,893 |
| Events in quadrant B | 3,516,214 | 618,503 |
| Events in quadrant C | 3,224,688 | 595,374 |
| Events in quadrant D | 3,148,273 | 585,336 |
| Mode SS | |||
|---|---|---|---|
| Quadrant | BADHDUFLAG | Total packets | Discarded packets |
| A | 0 | 132 | 0 |
| B | 0 | 132 | 0 |
| C | 0 | 132 | 0 |
| D | 0 | 132 | 0 |
| Mode M0 | |||
|---|---|---|---|
| Quadrant | BADHDUFLAG | Total packets | Discarded packets |
| A | 0 | 13416 | 2 |
| B | 0 | 14814 | 2 |
| C | 0 | 13676 | 2 |
| D | 0 | 13822 | 2 |
| Mode M9 | |||
|---|---|---|---|
| Quadrant | BADHDUFLAG | Total packets | Discarded packets |
| A | 0 | 14 | 0 |
| B | 0 | 15 | 0 |
| C | 0 | 15 | 0 |
| D | 0 | 15 | 0 |
| Quadrant | Total seconds | Saturated seconds | Saturation percentage |
|---|---|---|---|
| A | 6482 | 33 | 0.509102% |
| B | 6482 | 133 | 2.051836% |
| C | 6482 | 71 | 1.095341% |
| D | 6482 | 50 | 0.771367% |
Noise dominated data is calculated using 1-second bins in cleaned event files. If a bin has >2000 counts, and if more than 50% of those come from <1% of pixels, then it is considered to be noise-dominated and hence unusable.
| Quadrant | # 1 sec bins | Bins with >0 counts | Bins with >2000 counts | High rate bins dominated by noise | Noise dominated (total time) | Noise dominated (detector-on time) | Marked lightcurve |
|---|---|---|---|---|---|---|---|
| A | 7607 | 6482 | 0 | 0 | 0.00% | 0.00% | 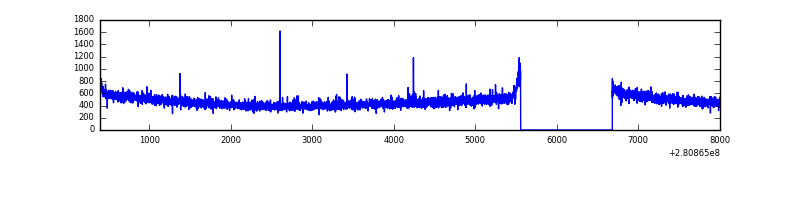 |
| B | 7607 | 6482 | 58 | 58 | 0.76% | 0.89% | 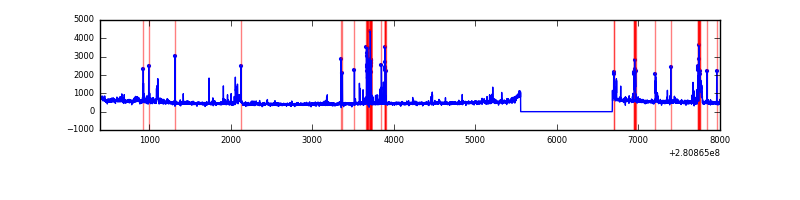 |
| C | 7607 | 6483 | 1 | 1 | 0.01% | 0.02% | 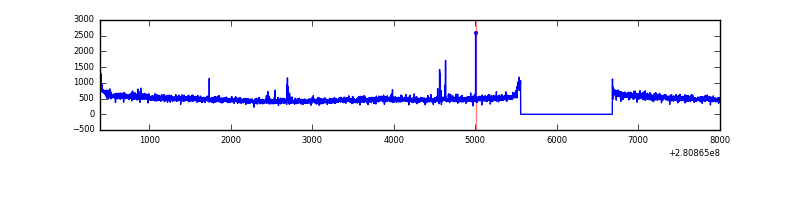 |
| D | 7607 | 6482 | 16 | 16 | 0.21% | 0.25% | 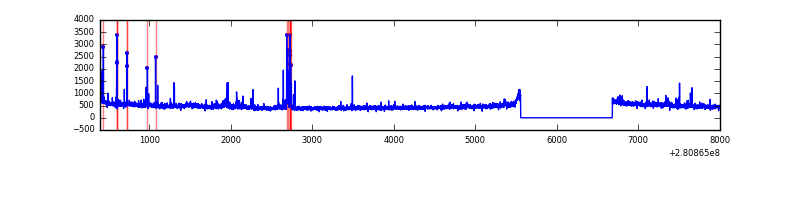 |
Top three noisy pixels from each quadrant. If the there are fewer than three noisy pixels in the level2.evt file, extra rows are filled as -1
| Pixel properties | Quadrant properties | ||||||
|---|---|---|---|---|---|---|---|
| Quadrant | DetID | PixID | Counts | Sigma | Mean | Median | Sigma |
| A | 4 | 2 | 7300 | 41.46 | 785 | 768 | 157.6 |
| A | 0 | 226 | 7023 | 39.7 | 785 | 768 | 157.6 |
| A | 12 | 194 | 5798 | 31.93 | 785 | 768 | 157.6 |
| B | 15 | 32 | 170070 | 1155.56 | 785 | 763 | 146.5 |
| B | 4 | 48 | 150690 | 1023.29 | 785 | 763 | 146.5 |
| B | 7 | 220 | 42860 | 287.32 | 785 | 763 | 146.5 |
| C | 14 | 238 | 116046 | 654.11 | 760 | 767 | 176.2 |
| C | 3 | 233 | 108320 | 610.27 | 760 | 767 | 176.2 |
| C | 9 | 54 | 18775 | 102.18 | 760 | 767 | 176.2 |
| D | 10 | 70 | 86080 | 457.36 | 769 | 748 | 186.6 |
| D | 5 | 222 | 79937 | 424.44 | 769 | 748 | 186.6 |
| D | 15 | 0 | 28148 | 146.86 | 769 | 748 | 186.6 |
Histogram calculated using DETX and DETY for each event in the final _common_clean file
| Quadrant A | 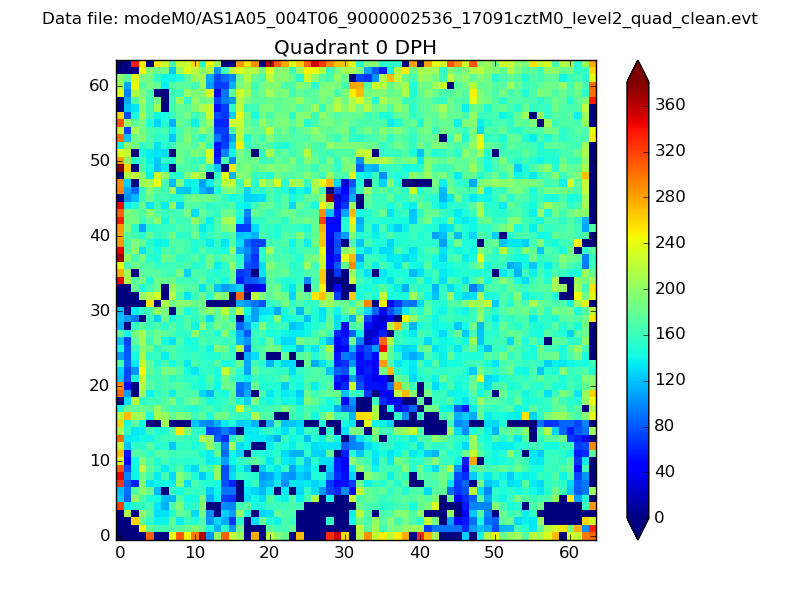 |
 |
Quadrant B |
|---|---|---|---|
| Quadrant D | 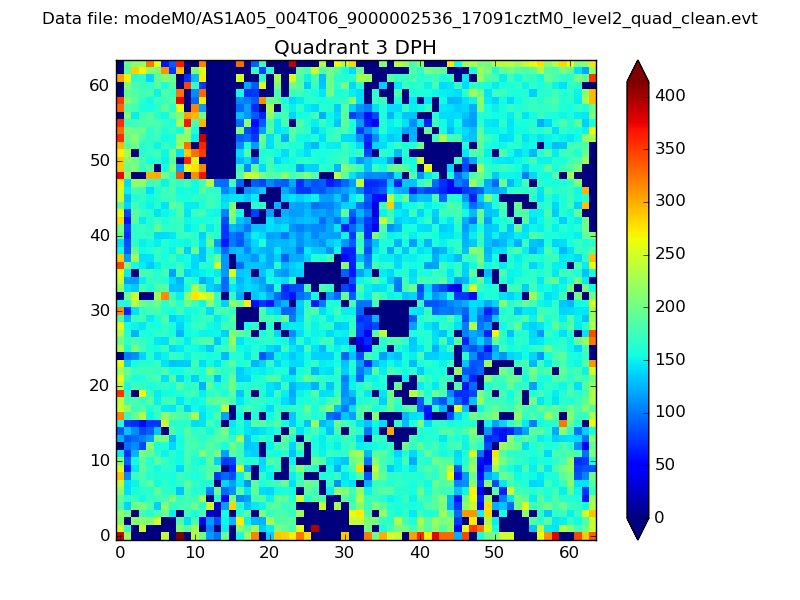 |
 |
Quadrant C |
| Plot type | Count rate plots | Images |
|---|---|---|
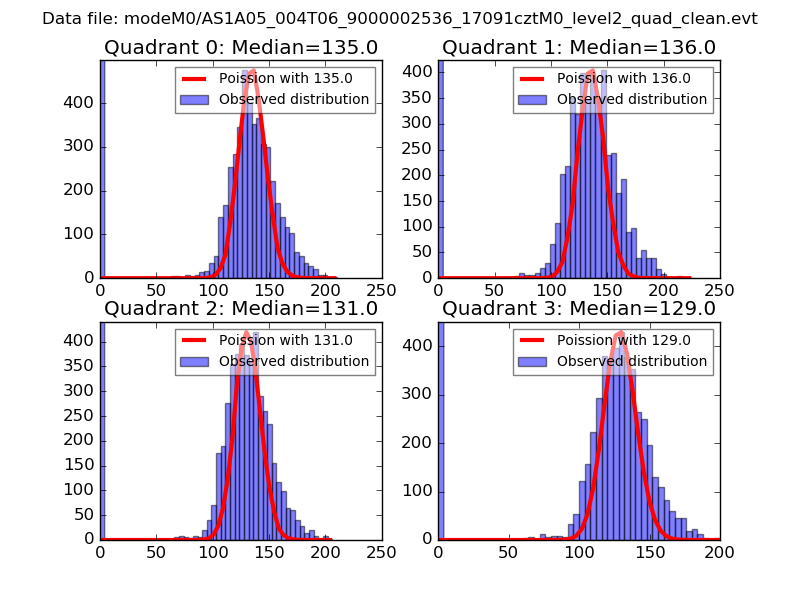
| Comparison with Poisson distribution Blue bars denote a histogram of data divided into 1 sec bins. Red curve is a Poisson curve with rate = median count rate of data. |
 |
 |
| Quadrant-wise count rates Data is divided into 100 sec bins |
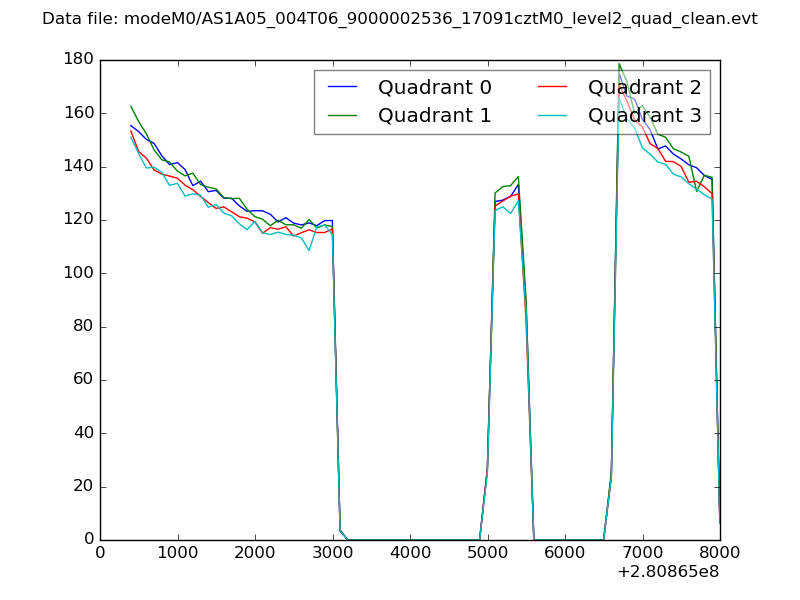 |
|
| Module-wise count rates for Quadrant A Data is divided into 100 sec bins |
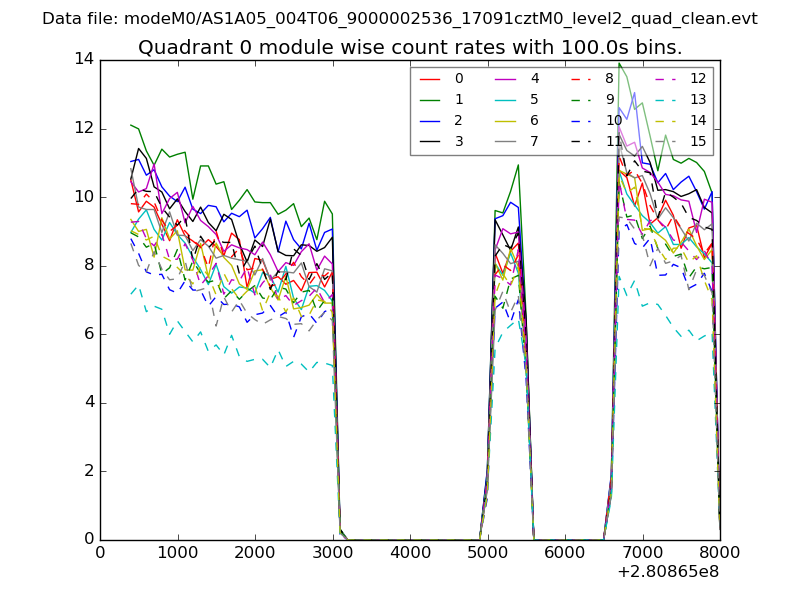 |
 |
| Module-wise count rates for Quadrant B Data is divided into 100 sec bins |
 |
 |
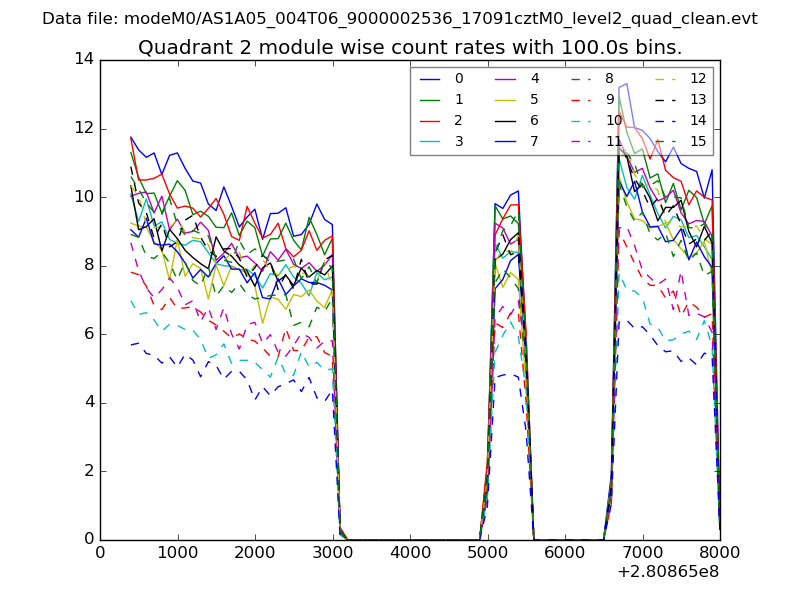
| Module-wise count rates for Quadrant C Data is divided into 100 sec bins |
 |
 |
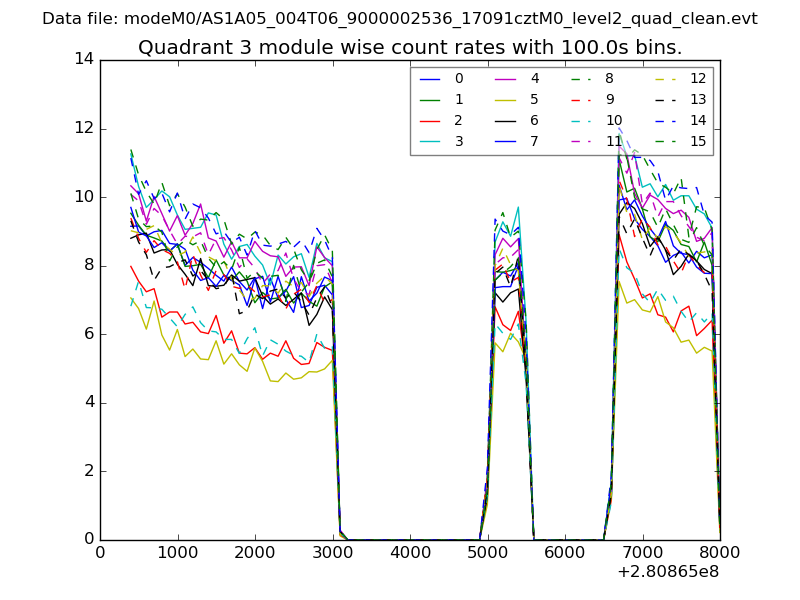
| Module-wise count rates for Quadrant D Data is divided into 100 sec bins |
 |
 |
| Parameter | Plot |
|---|---|
| CZT HV Monitor | 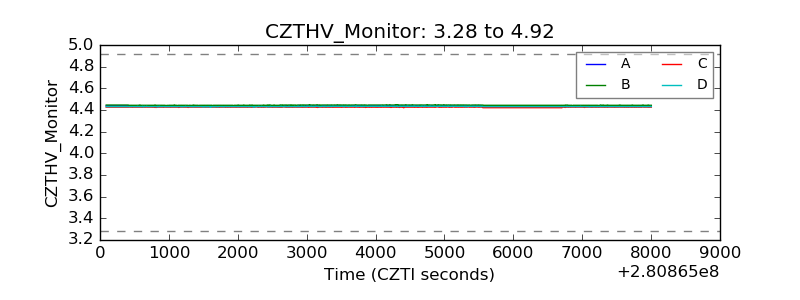 |
| D_VDD | 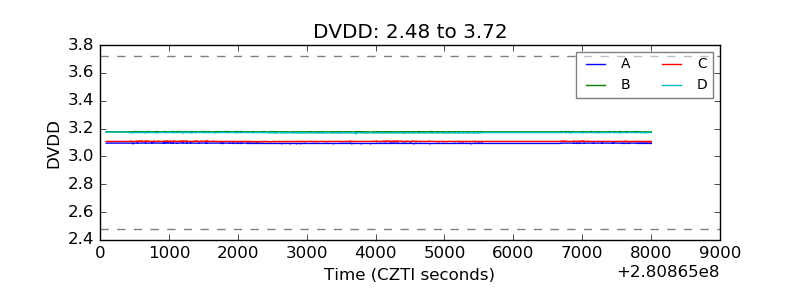 |
| Temperature 1 | 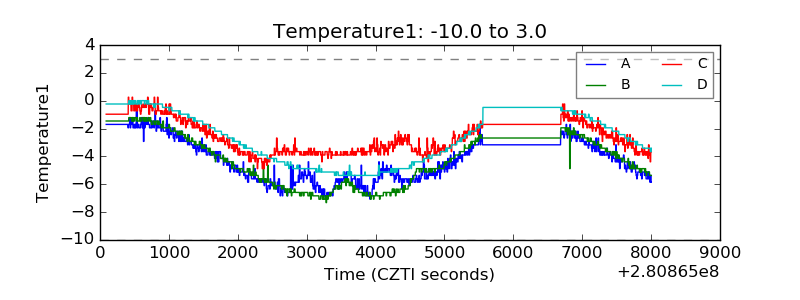 |
| Veto HV Monitor | 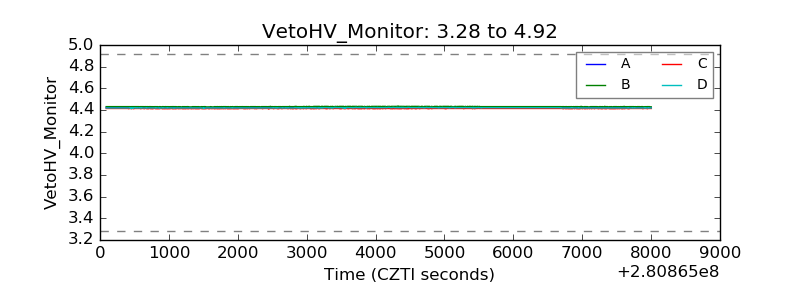 |
| Veto LLD | 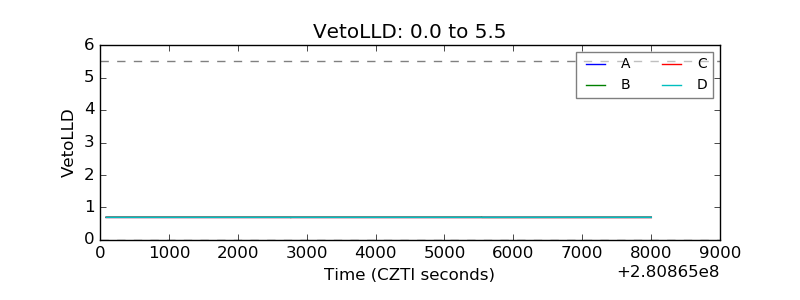 |
| Alpha Counter | 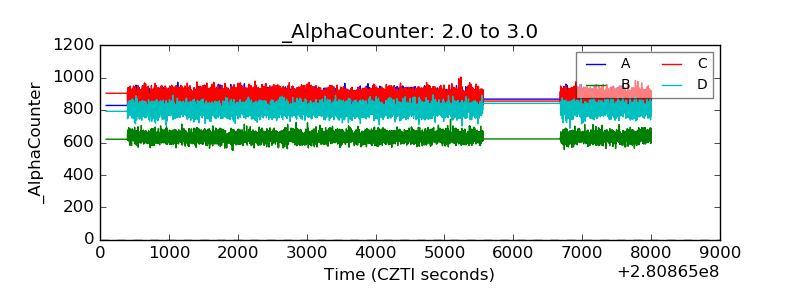 |
| _CPM_Rate | 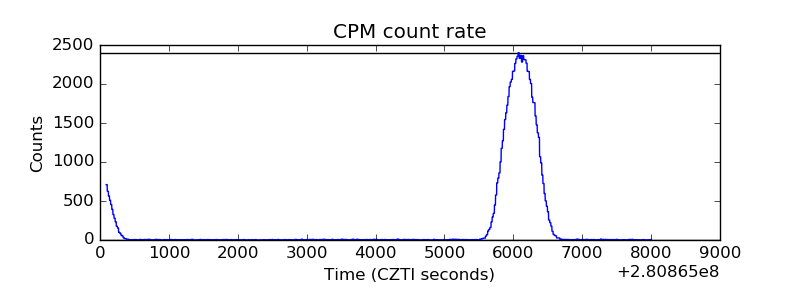 |
| CZT Counter | 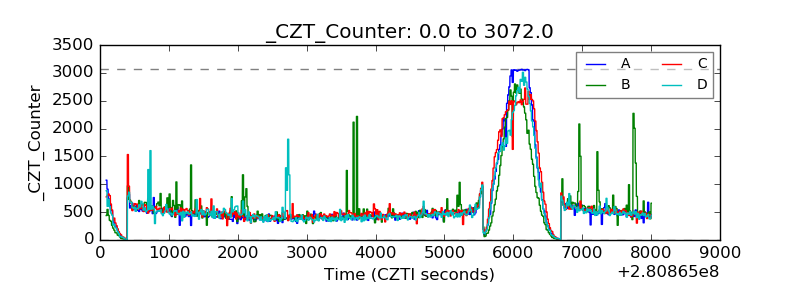 |
| +2.5 Volts monitor | 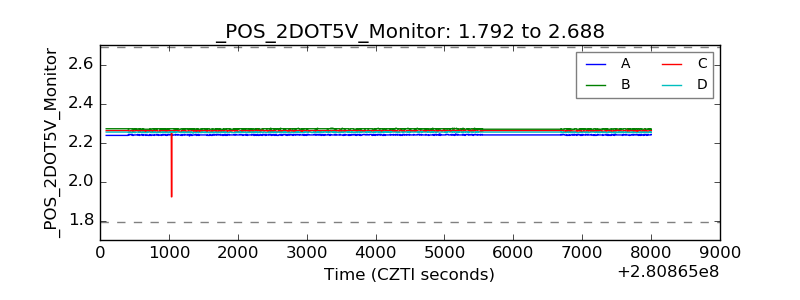 |
| +5 Volts monitor |  |
| _ROLL_ROT | 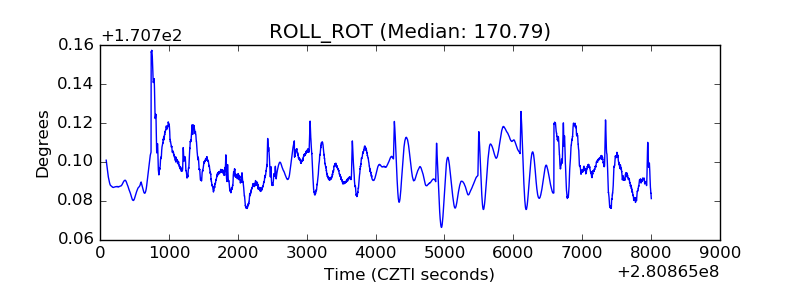 |
| _Roll_DEC | 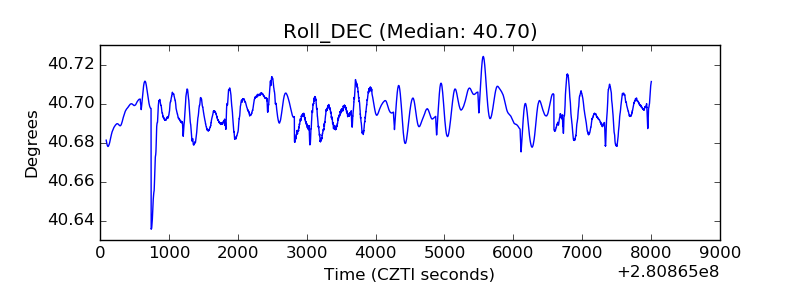 |
| _Roll_RA | 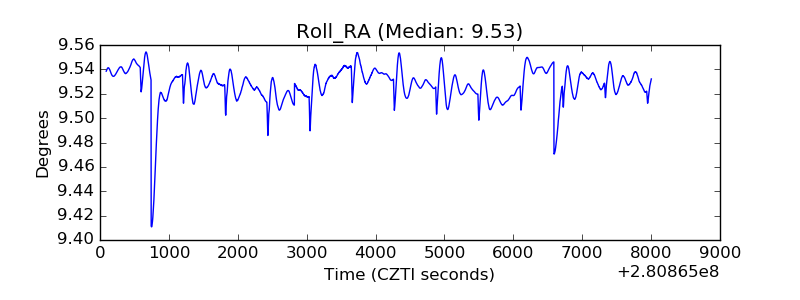 |
| Veto Counter | 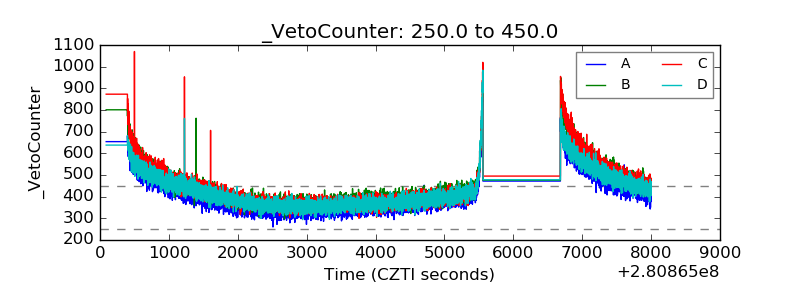 |