| Param | Original file | Final file |
|---|---|---|
| Filename | modeM0/AS1A05_004T06_9000002536_17092cztM0_level2.evt | modeM0/AS1A05_004T06_9000002536_17092cztM0_level2_quad_clean.evt |
| Size (bytes) | 437,639,040 | 98,858,880 |
| Size | 417.4 MB | 94.3 MB |
| Events in quadrant A | 3,111,788 | 645,777 |
| Events in quadrant B | 3,416,460 | 657,907 |
| Events in quadrant C | 3,198,505 | 630,136 |
| Events in quadrant D | 3,089,673 | 611,099 |
| Mode SS | |||
|---|---|---|---|
| Quadrant | BADHDUFLAG | Total packets | Discarded packets |
| A | 0 | 134 | 0 |
| B | 0 | 134 | 0 |
| C | 0 | 134 | 0 |
| D | 0 | 134 | 0 |
| Mode M0 | |||
|---|---|---|---|
| Quadrant | BADHDUFLAG | Total packets | Discarded packets |
| A | 0 | 13544 | 2 |
| B | 0 | 14362 | 2 |
| C | 0 | 13630 | 2 |
| D | 0 | 13637 | 2 |
| Mode M9 | |||
|---|---|---|---|
| Quadrant | BADHDUFLAG | Total packets | Discarded packets |
| A | 0 | 23 | 0 |
| B | 0 | 23 | 0 |
| C | 0 | 23 | 0 |
| D | 0 | 23 | 0 |
| Quadrant | Total seconds | Saturated seconds | Saturation percentage |
|---|---|---|---|
| A | 6431 | 46 | 0.715285% |
| B | 6432 | 107 | 1.663557% |
| C | 6432 | 87 | 1.352612% |
| D | 6432 | 42 | 0.652985% |
Noise dominated data is calculated using 1-second bins in cleaned event files. If a bin has >2000 counts, and if more than 50% of those come from <1% of pixels, then it is considered to be noise-dominated and hence unusable.
| Quadrant | # 1 sec bins | Bins with >0 counts | Bins with >2000 counts | High rate bins dominated by noise | Noise dominated (total time) | Noise dominated (detector-on time) | Marked lightcurve |
|---|---|---|---|---|---|---|---|
| A | 8796 | 6432 | 3 | 3 | 0.03% | 0.05% | 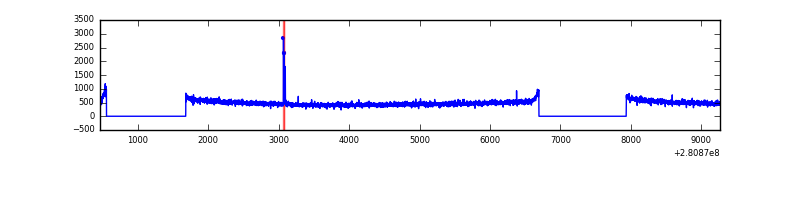 |
| B | 8797 | 6433 | 28 | 28 | 0.32% | 0.44% | 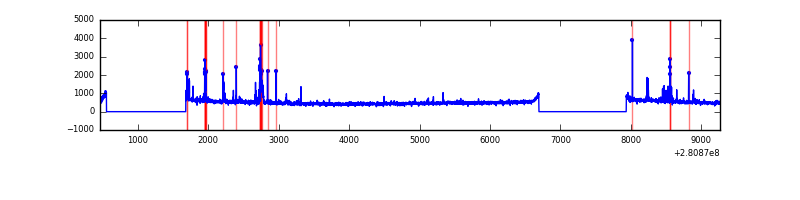 |
| C | 8797 | 6434 | 0 | 0 | 0.00% | 0.00% | 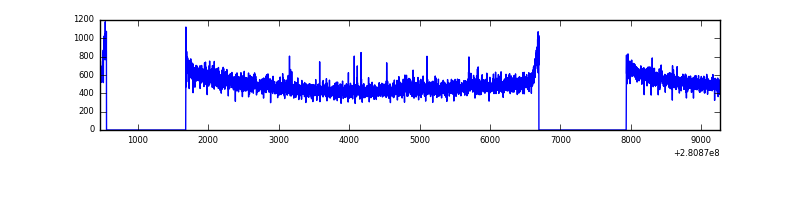 |
| D | 8797 | 6433 | 5 | 5 | 0.06% | 0.08% | 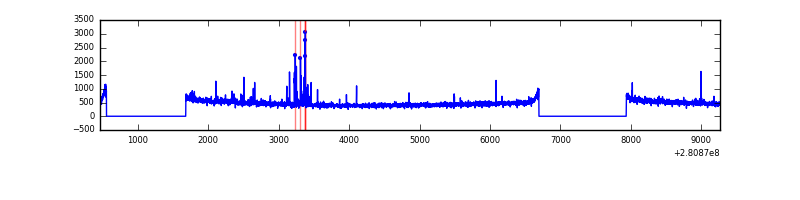 |
Top three noisy pixels from each quadrant. If the there are fewer than three noisy pixels in the level2.evt file, extra rows are filled as -1
| Pixel properties | Quadrant properties | ||||||
|---|---|---|---|---|---|---|---|
| Quadrant | DetID | PixID | Counts | Sigma | Mean | Median | Sigma |
| A | 4 | 2 | 26206 | 156.96 | 802 | 785 | 162.0 |
| A | 0 | 226 | 7032 | 38.57 | 802 | 785 | 162.0 |
| A | 12 | 194 | 6001 | 32.21 | 802 | 785 | 162.0 |
| B | 15 | 32 | 162256 | 1072.3 | 807 | 787 | 150.6 |
| B | 0 | 197 | 36572 | 237.64 | 807 | 787 | 150.6 |
| B | 0 | 229 | 22786 | 146.09 | 807 | 787 | 150.6 |
| C | 14 | 238 | 120126 | 654.71 | 781 | 786 | 182.3 |
| C | 3 | 233 | 16230 | 84.73 | 781 | 786 | 182.3 |
| C | 9 | 54 | 10606 | 53.87 | 781 | 786 | 182.3 |
| D | 1 | 52 | 59063 | 306.93 | 785 | 764 | 189.9 |
| D | 2 | 234 | 25428 | 129.85 | 785 | 764 | 189.9 |
| D | 5 | 222 | 21007 | 106.57 | 785 | 764 | 189.9 |
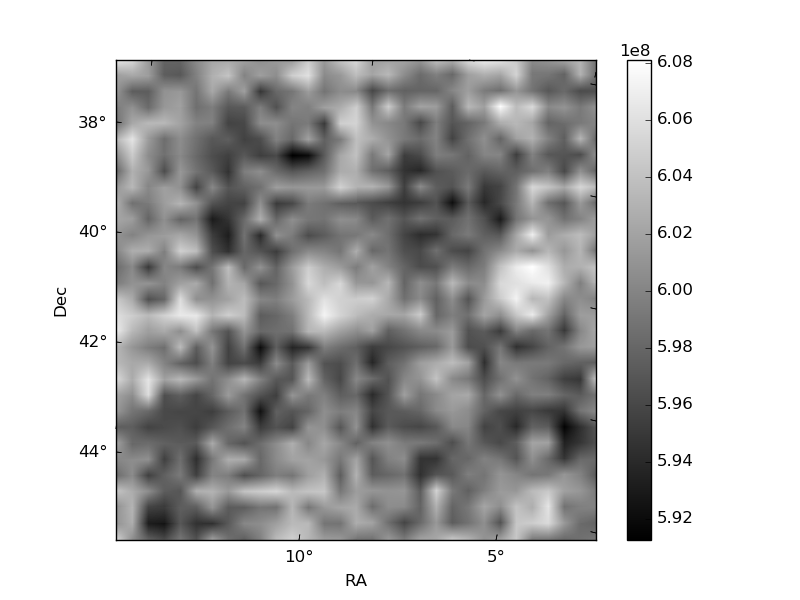
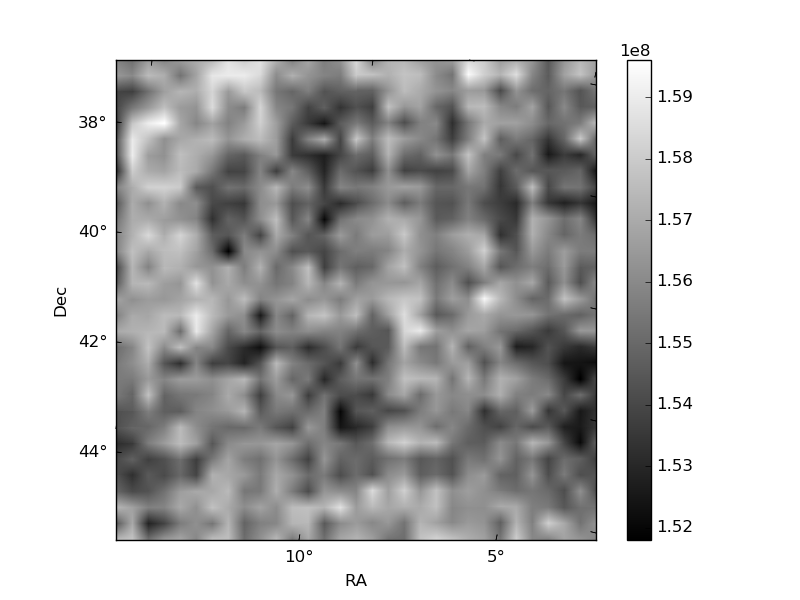
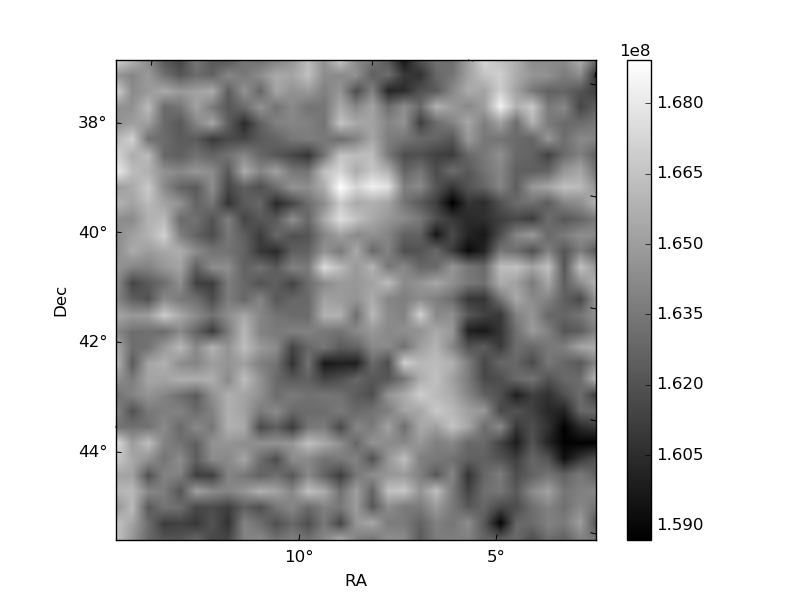
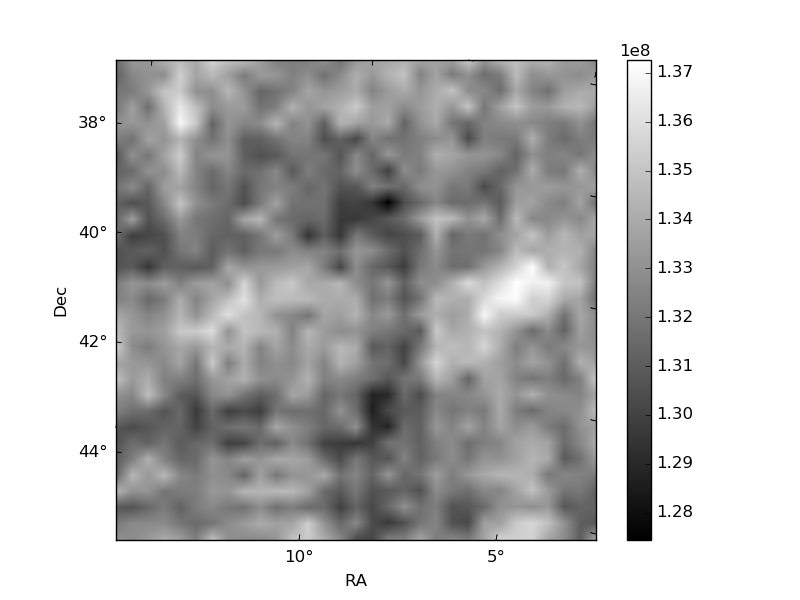
Histogram calculated using DETX and DETY for each event in the final _common_clean file
| Quadrant A | 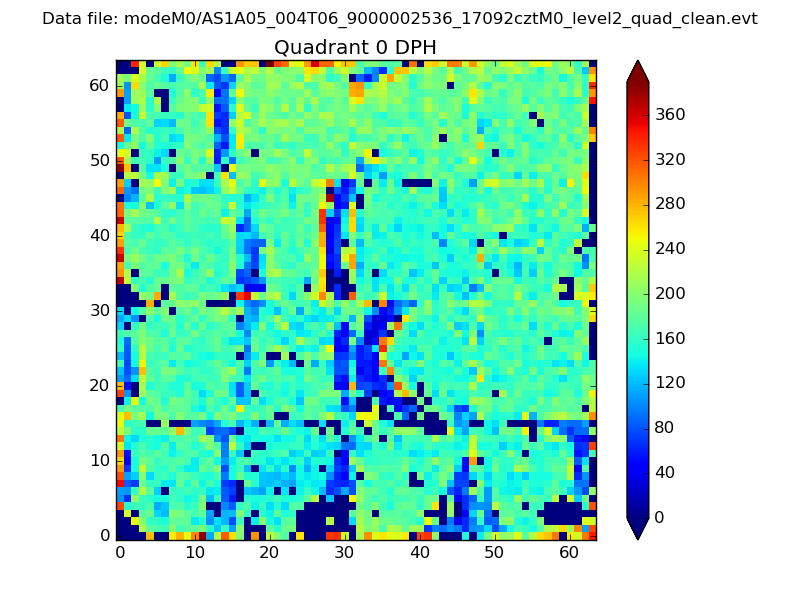 |
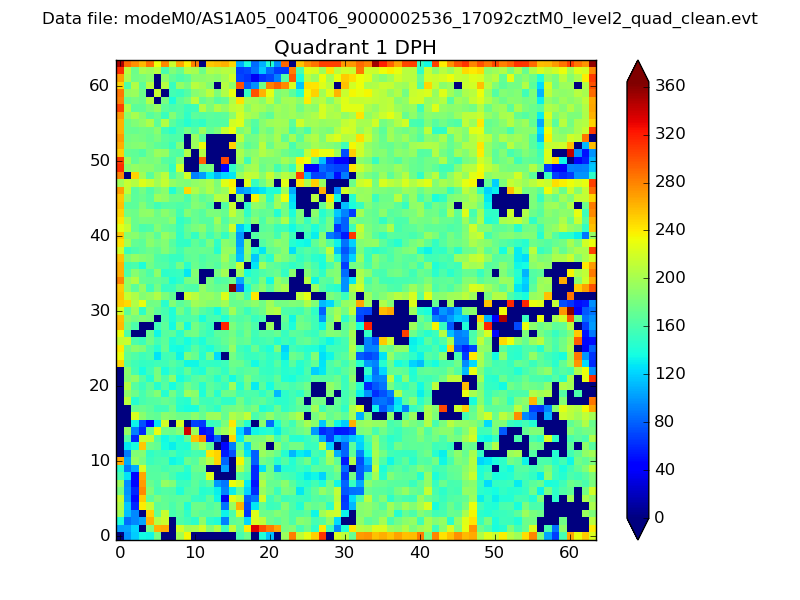 |
Quadrant B |
|---|---|---|---|
| Quadrant D |  |
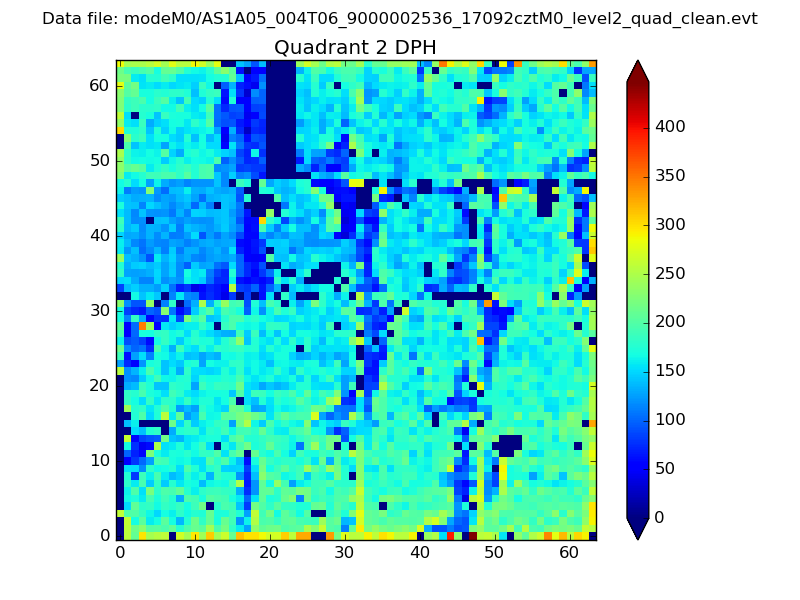 |
Quadrant C |
| Plot type | Count rate plots | Images |
|---|---|---|
| Comparison with Poisson distribution Blue bars denote a histogram of data divided into 1 sec bins. Red curve is a Poisson curve with rate = median count rate of data. |
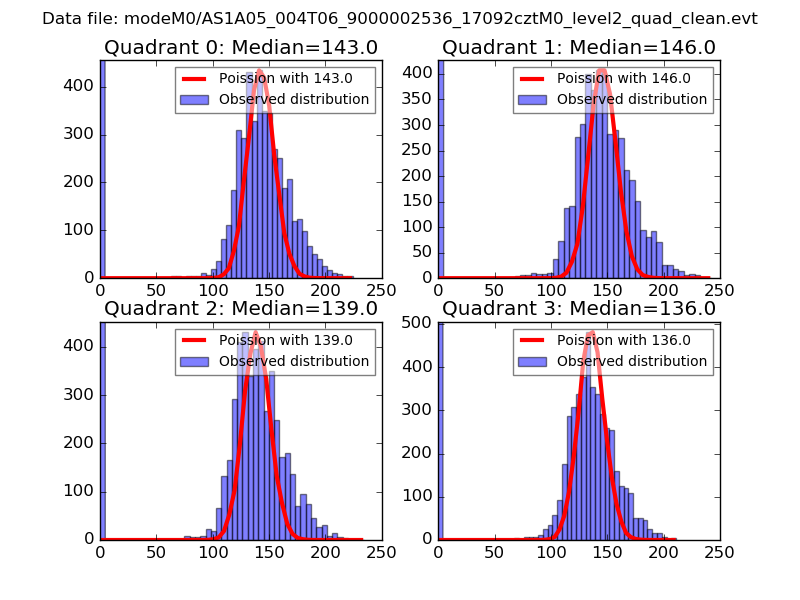 |
 |
| Quadrant-wise count rates Data is divided into 100 sec bins |
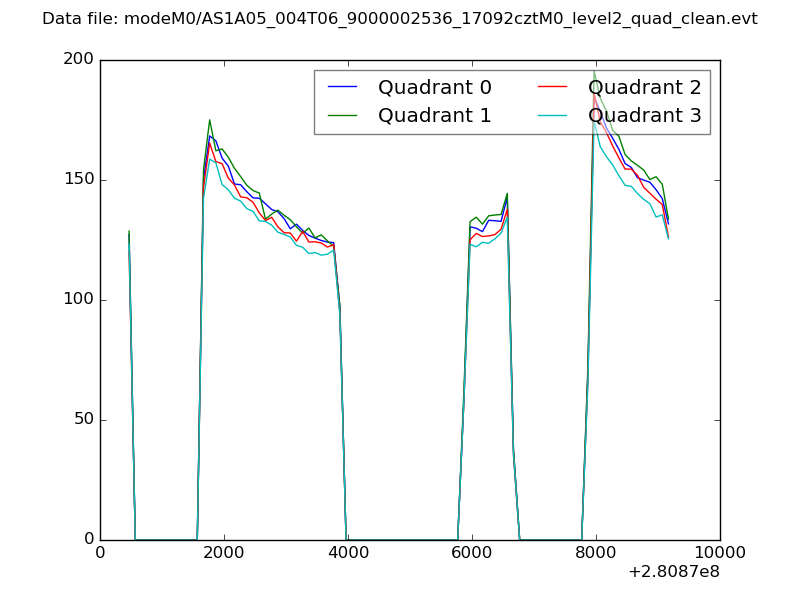 |
|
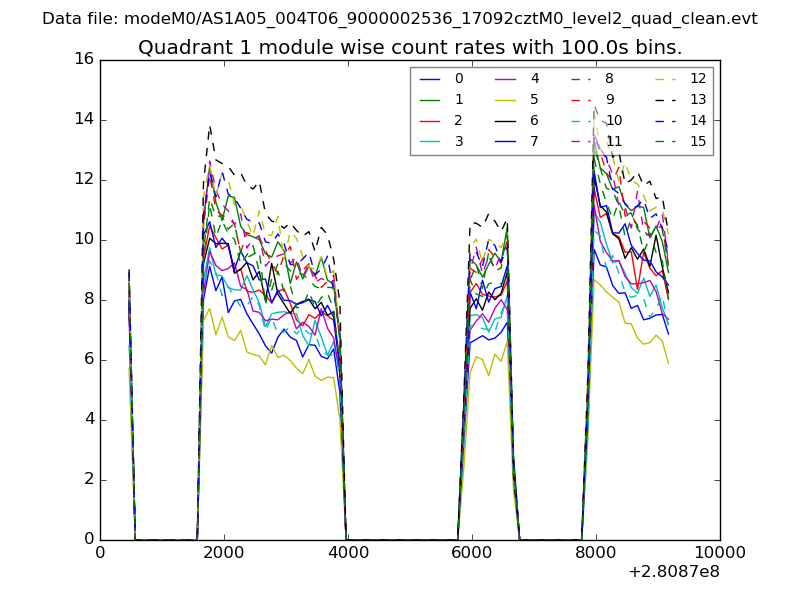
| Module-wise count rates for Quadrant A Data is divided into 100 sec bins |
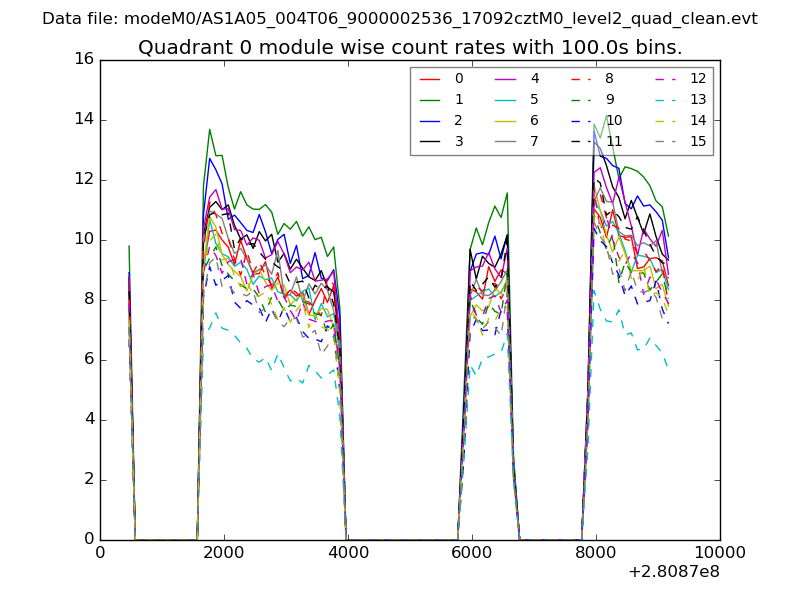 |
 |
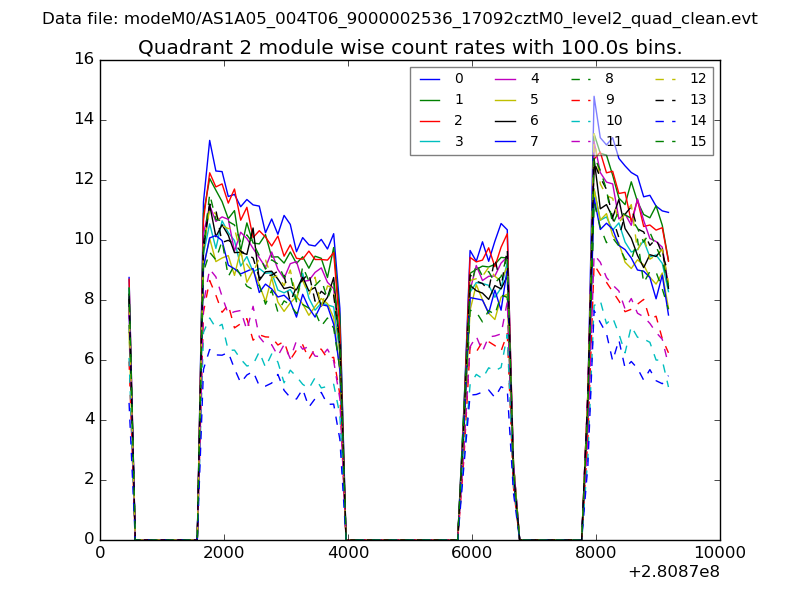
| Module-wise count rates for Quadrant B Data is divided into 100 sec bins |
 |
 |
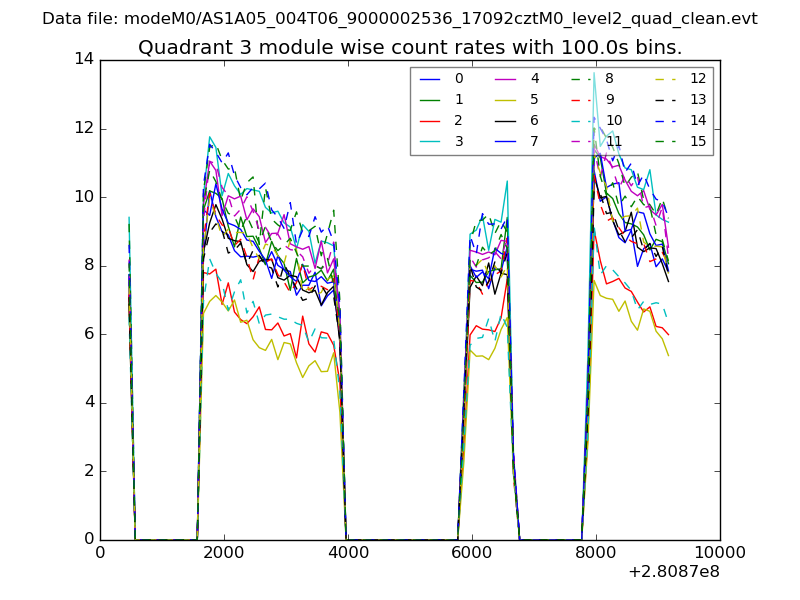
| Module-wise count rates for Quadrant C Data is divided into 100 sec bins |
 |
 |
| Module-wise count rates for Quadrant D Data is divided into 100 sec bins |
 |
 |
| Parameter | Plot |
|---|---|
| CZT HV Monitor | 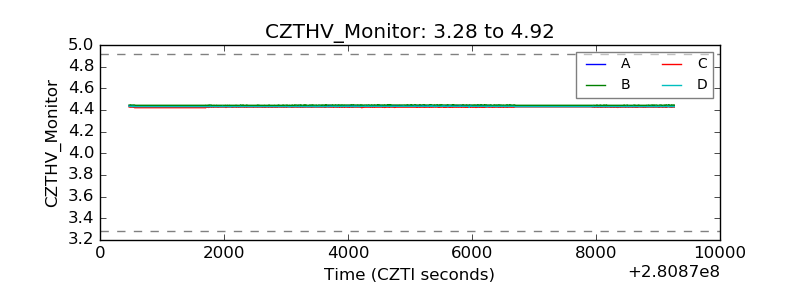 |
| D_VDD | 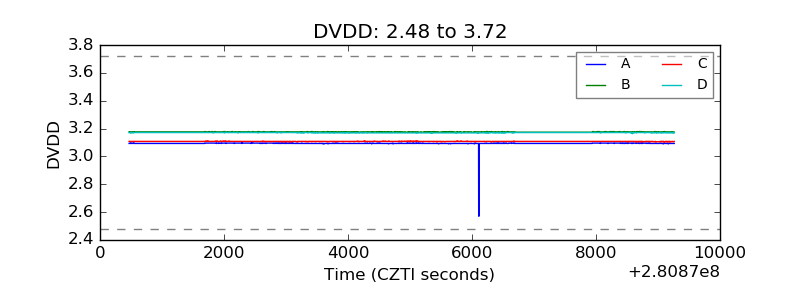 |
| Temperature 1 | 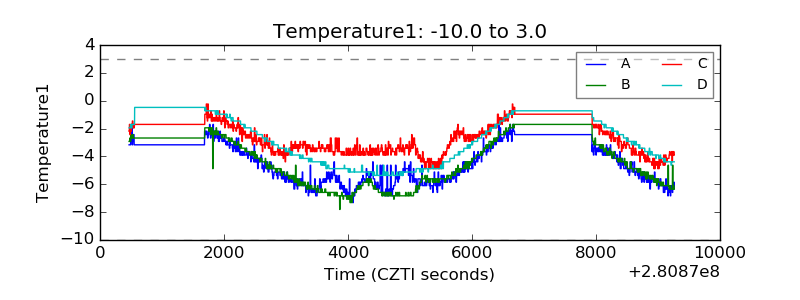 |
| Veto HV Monitor | 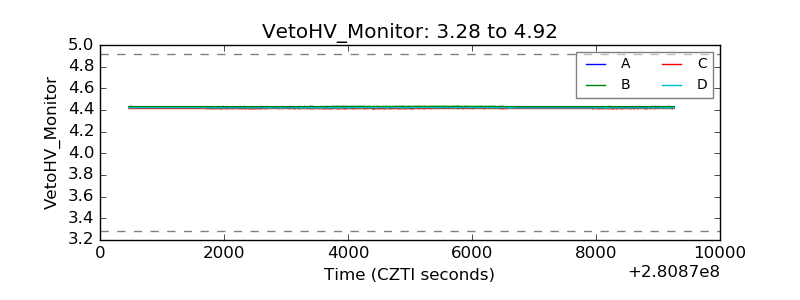 |
| Veto LLD | 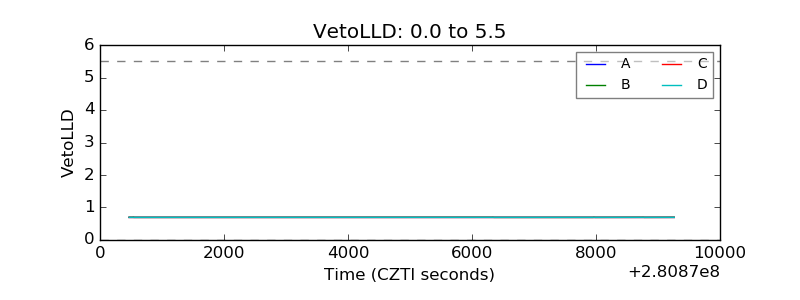 |
| Alpha Counter | 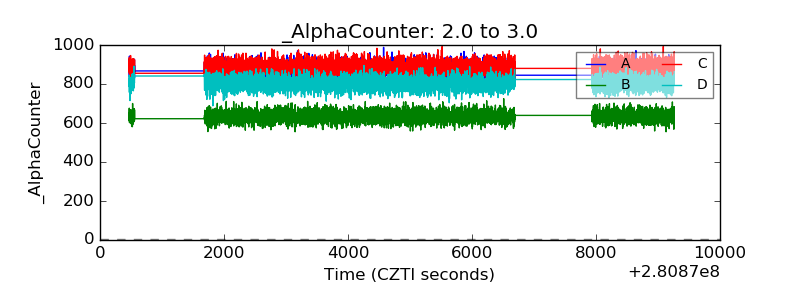 |
| _CPM_Rate | 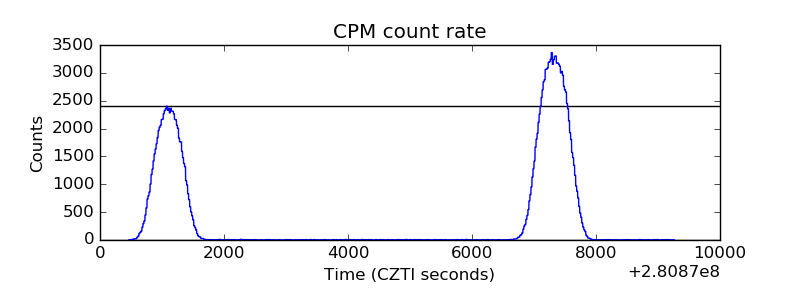 |
| CZT Counter | 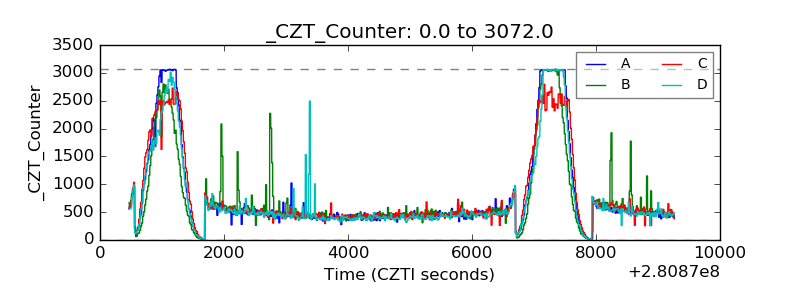 |
| +2.5 Volts monitor |  |
| +5 Volts monitor |  |
| _ROLL_ROT | 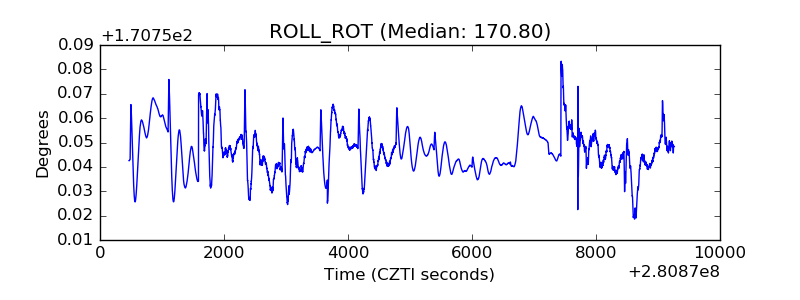 |
| _Roll_DEC | 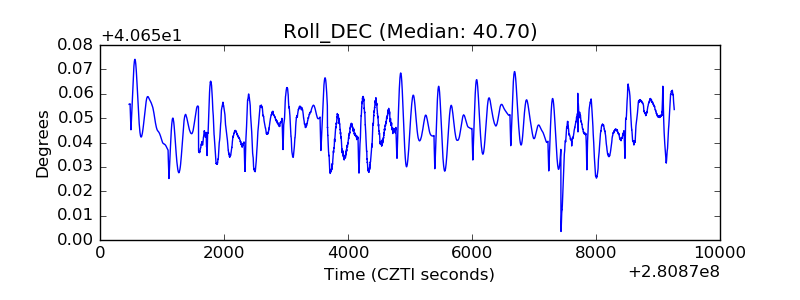 |
| _Roll_RA | 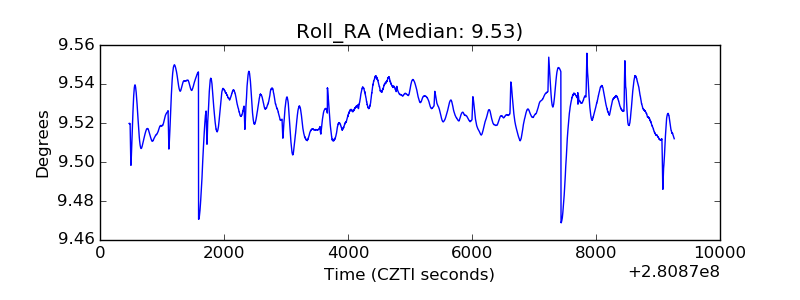 |
| Veto Counter | 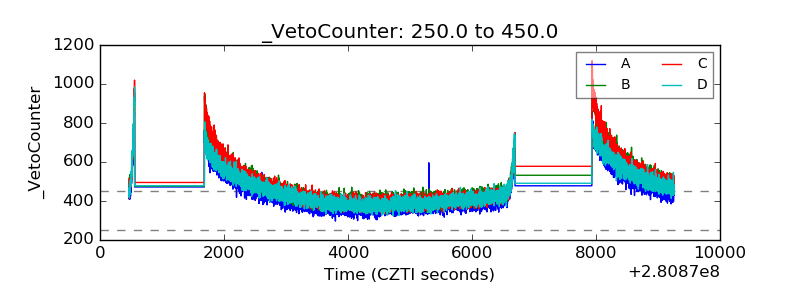 |