| Param | Original file | Final file |
|---|---|---|
| Filename | modeM0/AS1A05_004T06_9000002536_17093cztM0_level2.evt | modeM0/AS1A05_004T06_9000002536_17093cztM0_level2_quad_clean.evt |
| Size (bytes) | 419,993,280 | 96,117,120 |
| Size | 400.5 MB | 91.7 MB |
| Events in quadrant A | 2,979,077 | 627,703 |
| Events in quadrant B | 3,193,048 | 649,466 |
| Events in quadrant C | 3,171,201 | 614,599 |
| Events in quadrant D | 2,958,849 | 590,620 |
| Mode SS | |||
|---|---|---|---|
| Quadrant | BADHDUFLAG | Total packets | Discarded packets |
| A | 0 | 124 | 0 |
| B | 0 | 124 | 0 |
| C | 0 | 124 | 0 |
| D | 0 | 124 | 0 |
| Mode M0 | |||
|---|---|---|---|
| Quadrant | BADHDUFLAG | Total packets | Discarded packets |
| A | 0 | 12785 | 2 |
| B | 0 | 13434 | 2 |
| C | 0 | 13254 | 2 |
| D | 0 | 12957 | 2 |
| Mode M9 | |||
|---|---|---|---|
| Quadrant | BADHDUFLAG | Total packets | Discarded packets |
| A | 0 | 24 | 0 |
| B | 0 | 25 | 0 |
| C | 0 | 25 | 0 |
| D | 0 | 25 | 0 |
| Quadrant | Total seconds | Saturated seconds | Saturation percentage |
|---|---|---|---|
| A | 6141 | 12 | 0.195408% |
| B | 6141 | 33 | 0.537372% |
| C | 6141 | 51 | 0.830484% |
| D | 6141 | 14 | 0.227976% |
Noise dominated data is calculated using 1-second bins in cleaned event files. If a bin has >2000 counts, and if more than 50% of those come from <1% of pixels, then it is considered to be noise-dominated and hence unusable.
| Quadrant | # 1 sec bins | Bins with >0 counts | Bins with >2000 counts | High rate bins dominated by noise | Noise dominated (total time) | Noise dominated (detector-on time) | Marked lightcurve |
|---|---|---|---|---|---|---|---|
| A | 7511 | 6142 | 0 | 0 | 0.00% | 0.00% | 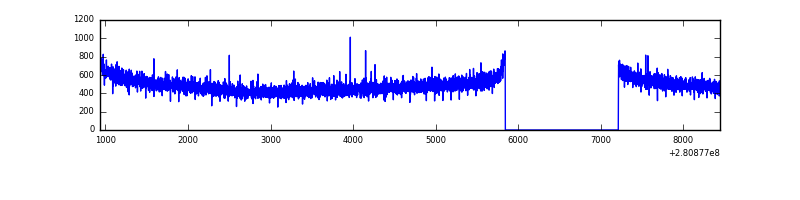 |
| B | 7511 | 6142 | 7 | 7 | 0.09% | 0.11% | 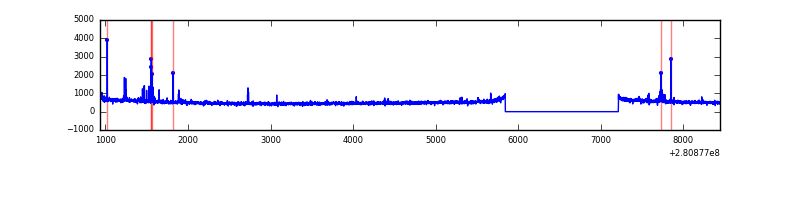 |
| C | 7511 | 6142 | 0 | 0 | 0.00% | 0.00% | 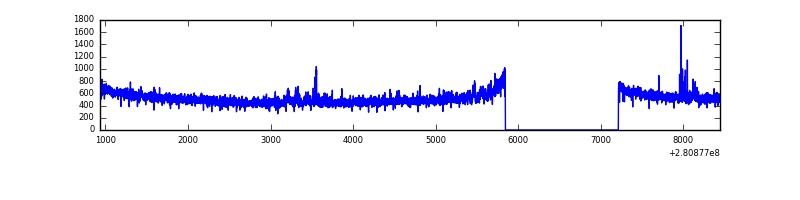 |
| D | 7511 | 6142 | 9 | 9 | 0.12% | 0.15% | 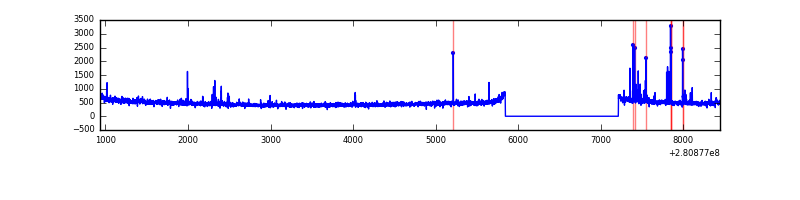 |
Top three noisy pixels from each quadrant. If the there are fewer than three noisy pixels in the level2.evt file, extra rows are filled as -1
| Pixel properties | Quadrant properties | ||||||
|---|---|---|---|---|---|---|---|
| Quadrant | DetID | PixID | Counts | Sigma | Mean | Median | Sigma |
| A | 0 | 226 | 6750 | 38.57 | 774 | 758 | 155.4 |
| A | 12 | 194 | 5756 | 32.17 | 774 | 758 | 155.4 |
| A | 3 | 137 | 5245 | 28.88 | 774 | 758 | 155.4 |
| B | 0 | 197 | 48960 | 331.95 | 784 | 766 | 145.2 |
| B | 15 | 32 | 24134 | 160.96 | 784 | 766 | 145.2 |
| B | 0 | 189 | 18012 | 118.79 | 784 | 766 | 145.2 |
| C | 14 | 238 | 118398 | 674.47 | 754 | 762 | 174.4 |
| C | 3 | 233 | 67783 | 384.27 | 754 | 762 | 174.4 |
| C | 9 | 54 | 26537 | 147.78 | 754 | 762 | 174.4 |
| D | 10 | 70 | 58130 | 317.33 | 751 | 730 | 180.9 |
| D | 2 | 234 | 23828 | 127.7 | 751 | 730 | 180.9 |
| D | 12 | 235 | 20825 | 111.09 | 751 | 730 | 180.9 |
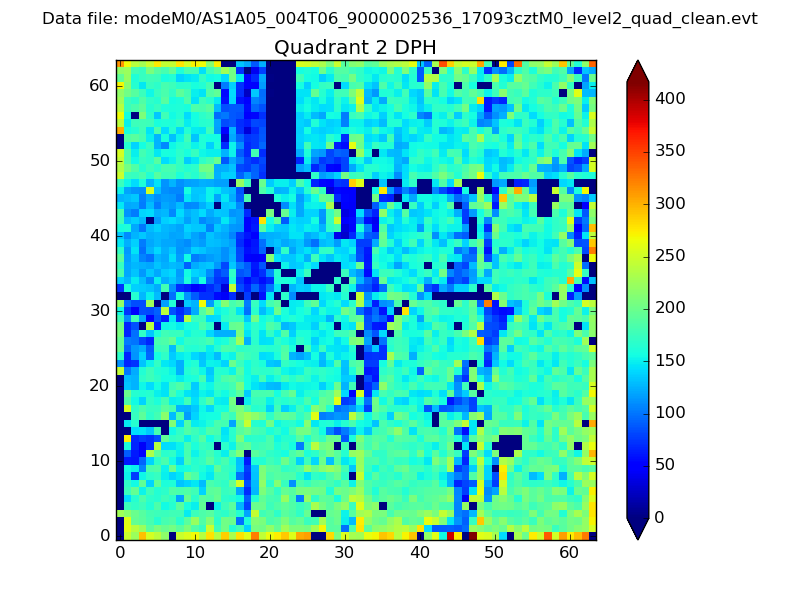
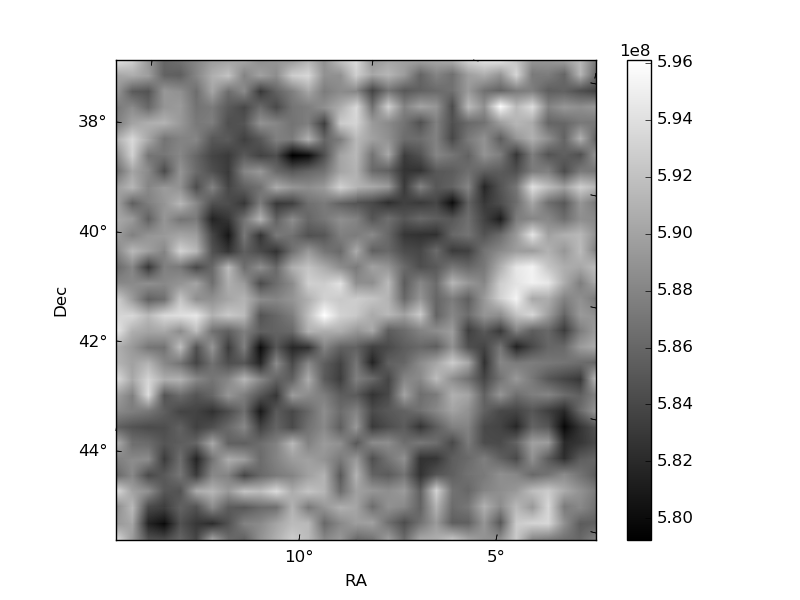
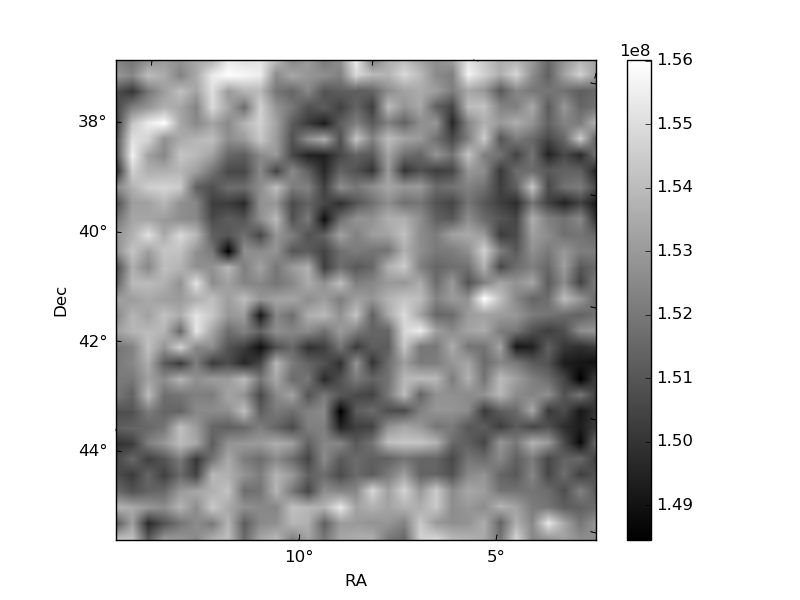
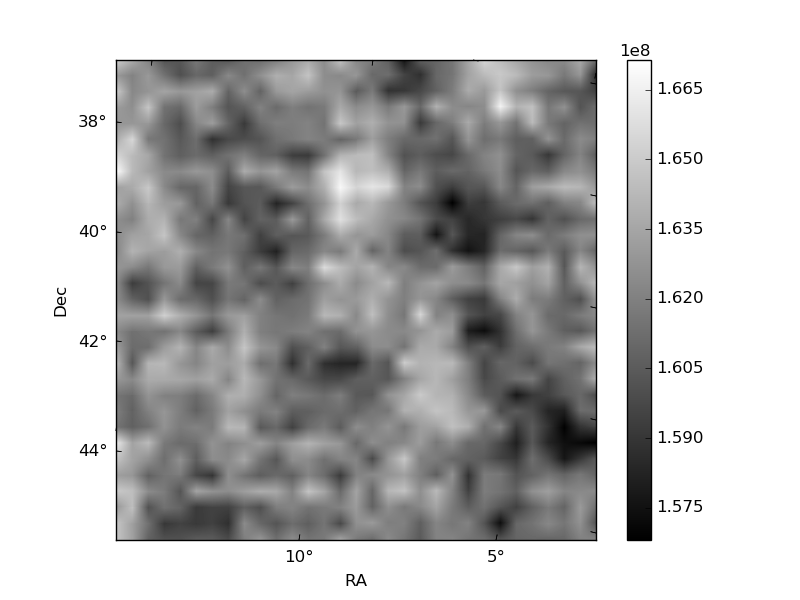
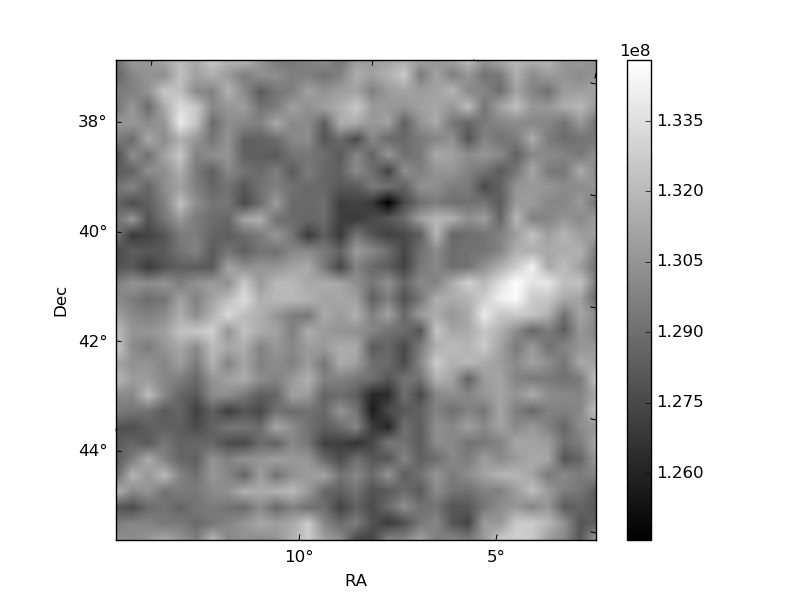
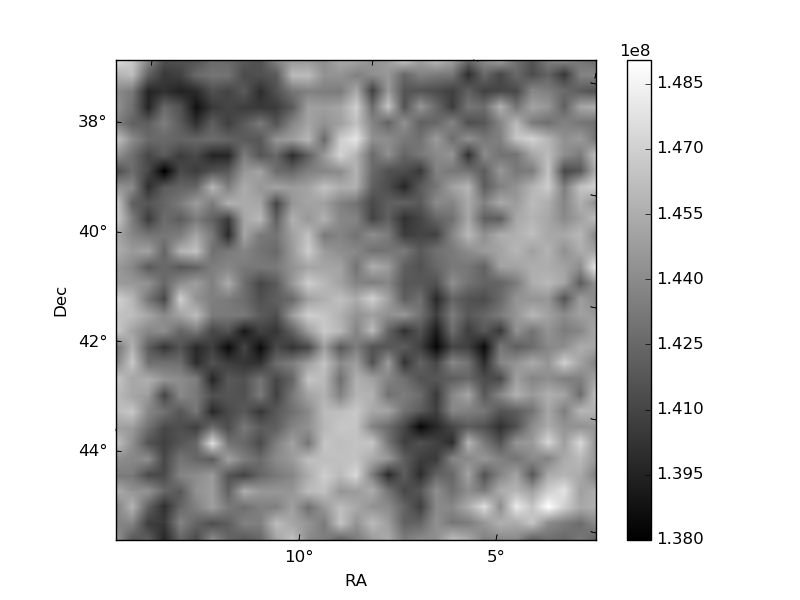
Histogram calculated using DETX and DETY for each event in the final _common_clean file
| Quadrant A | 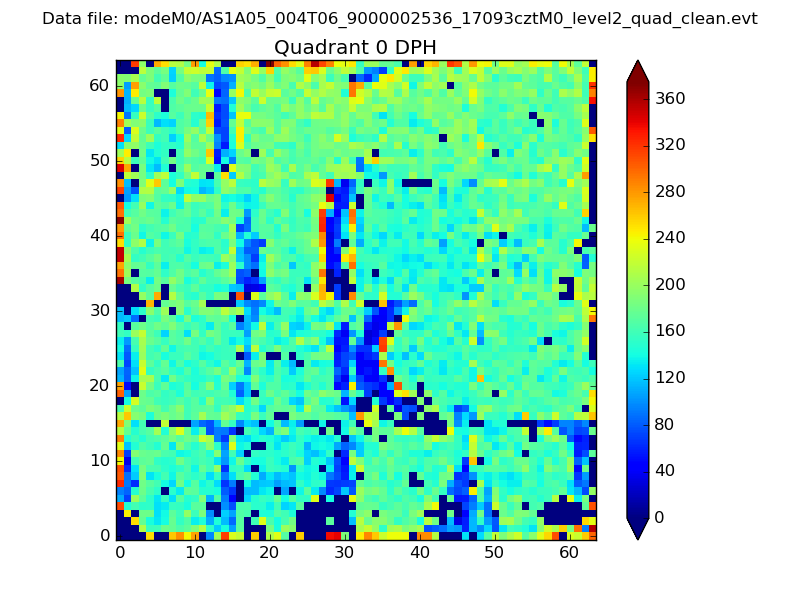 |
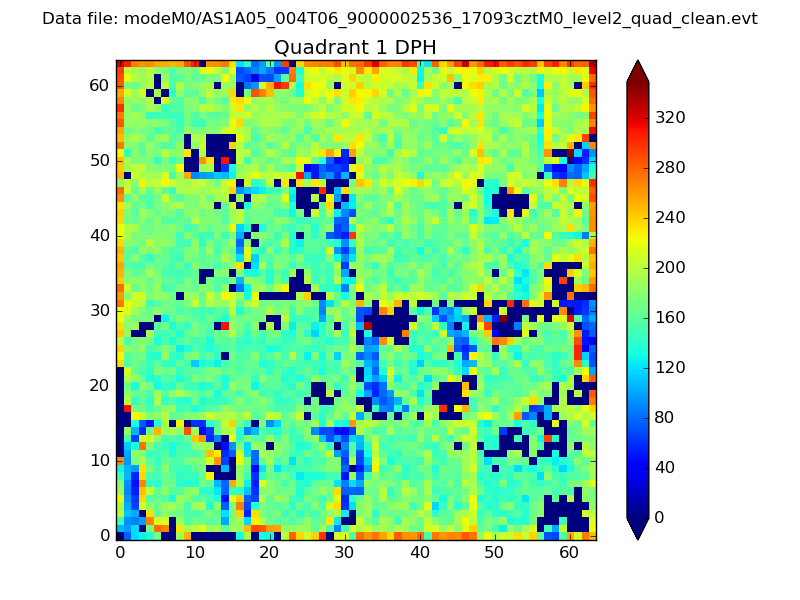 |
Quadrant B |
|---|---|---|---|
| Quadrant D | 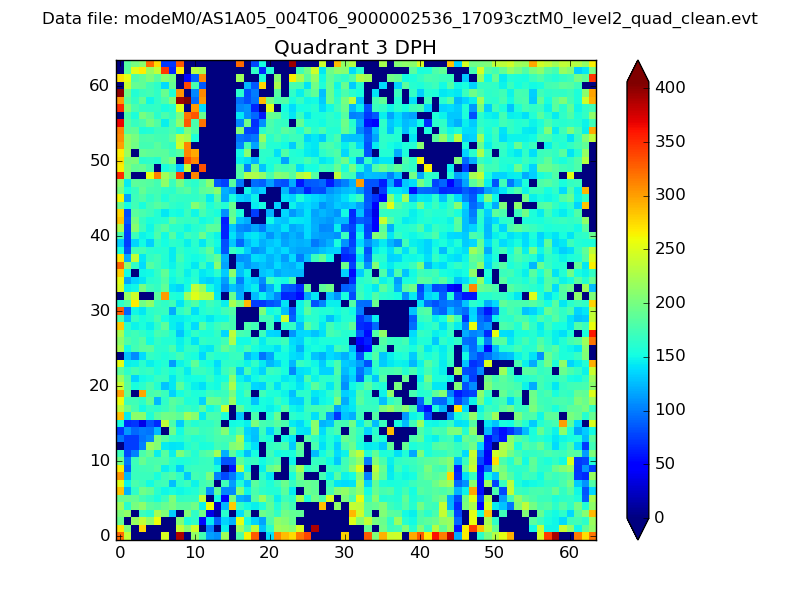 |
 |
Quadrant C |
| Plot type | Count rate plots | Images |
|---|---|---|
| Comparison with Poisson distribution Blue bars denote a histogram of data divided into 1 sec bins. Red curve is a Poisson curve with rate = median count rate of data. |
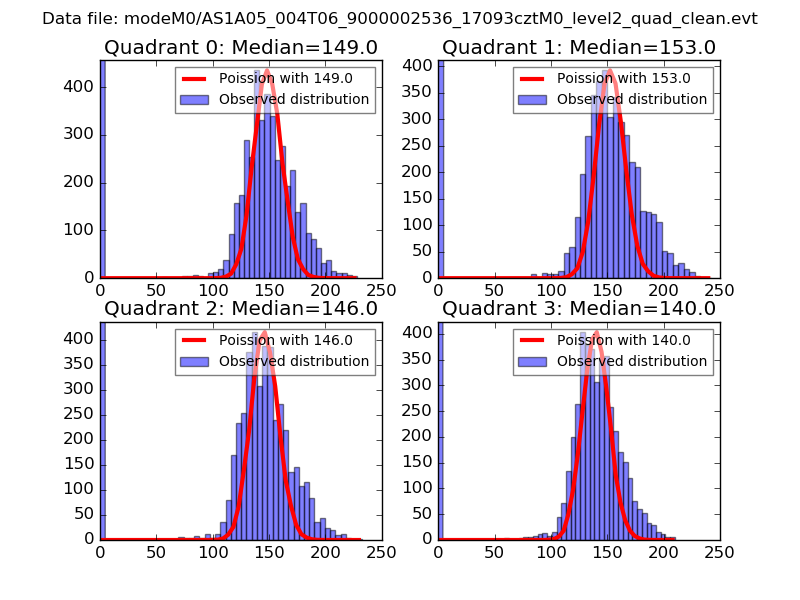 |
 |
| Quadrant-wise count rates Data is divided into 100 sec bins |
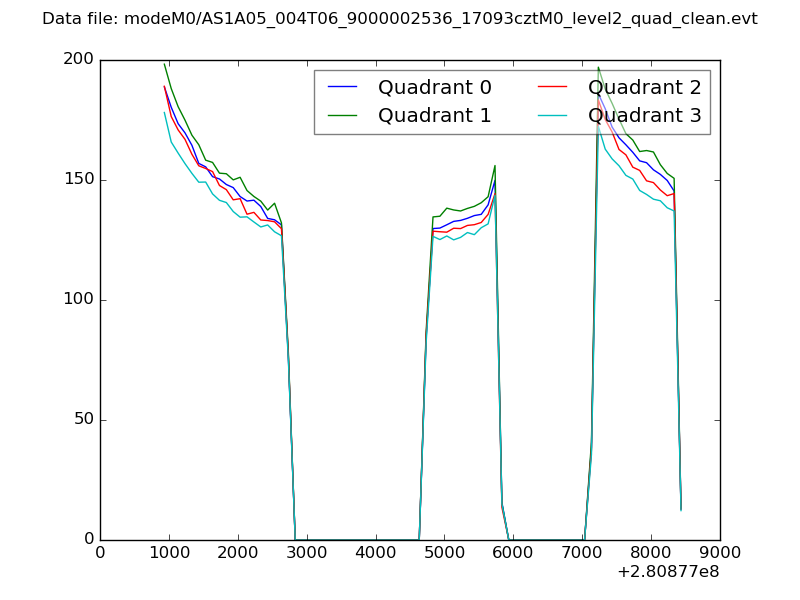 |
|
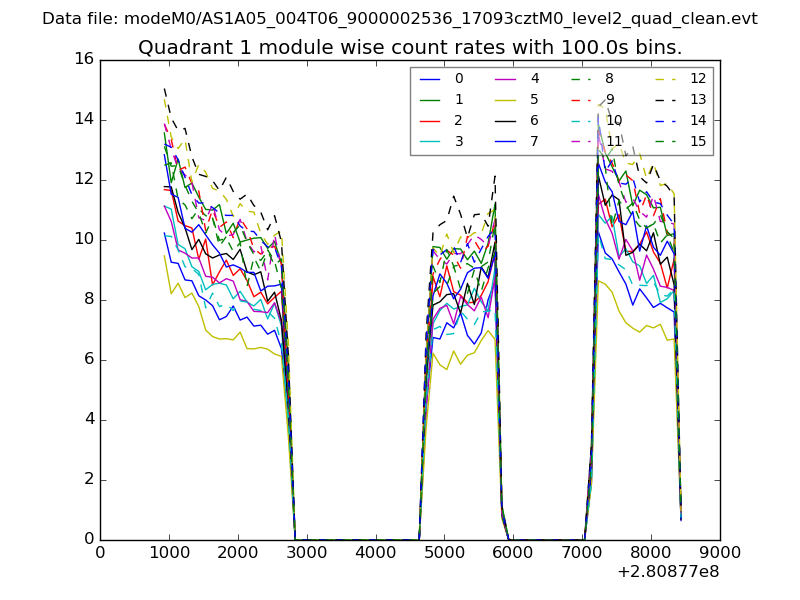
| Module-wise count rates for Quadrant A Data is divided into 100 sec bins |
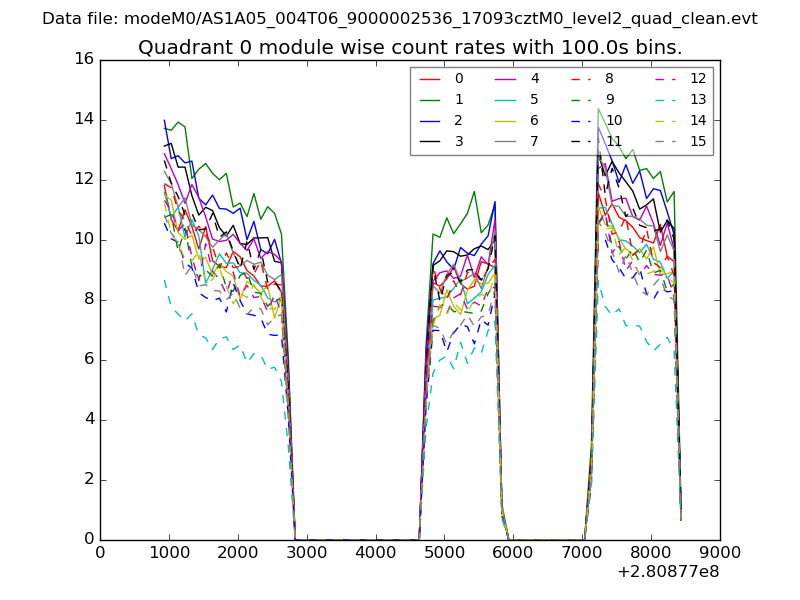 |
 |
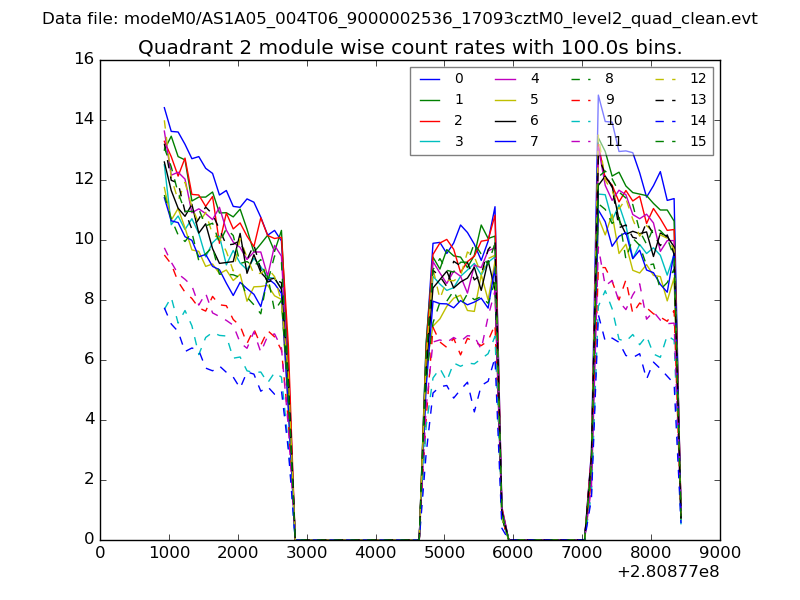
| Module-wise count rates for Quadrant B Data is divided into 100 sec bins |
 |
 |
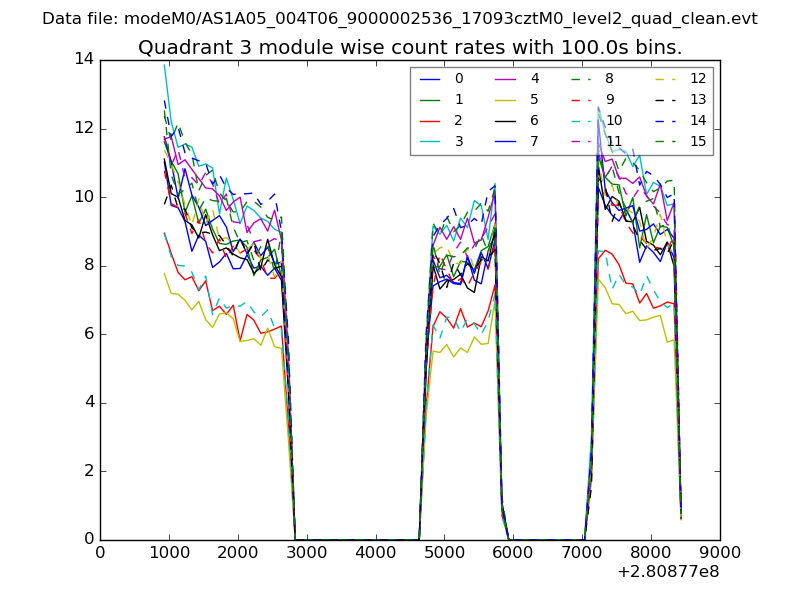
| Module-wise count rates for Quadrant C Data is divided into 100 sec bins |
 |
 |
| Module-wise count rates for Quadrant D Data is divided into 100 sec bins |
 |
 |
| Parameter | Plot |
|---|---|
| CZT HV Monitor | 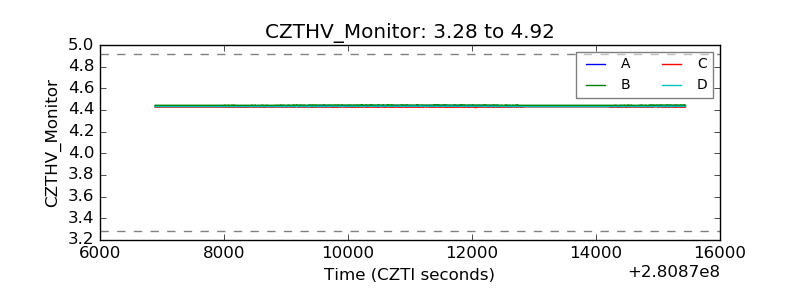 |
| D_VDD | 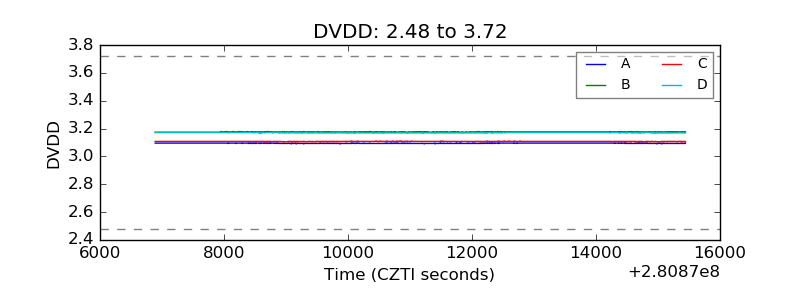 |
| Temperature 1 | 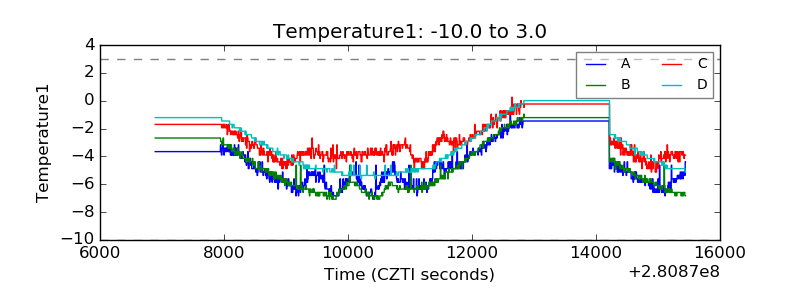 |
| Veto HV Monitor |  |
| Veto LLD | 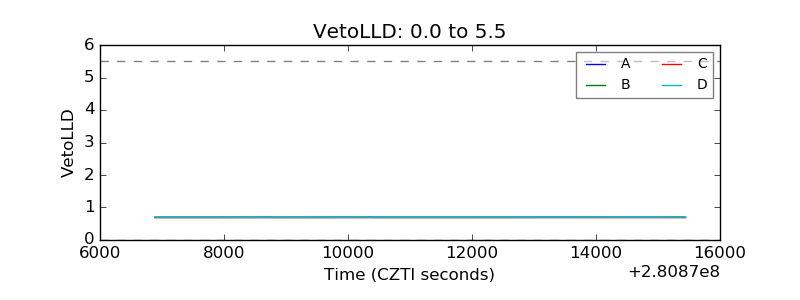 |
| Alpha Counter | 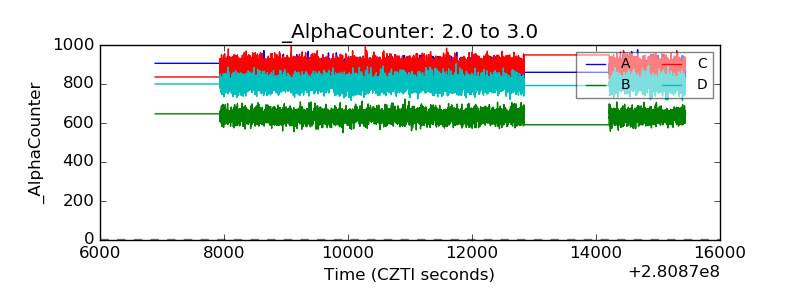 |
| _CPM_Rate | 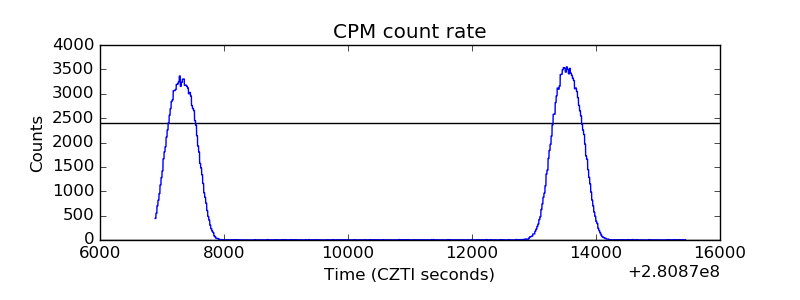 |
| CZT Counter | 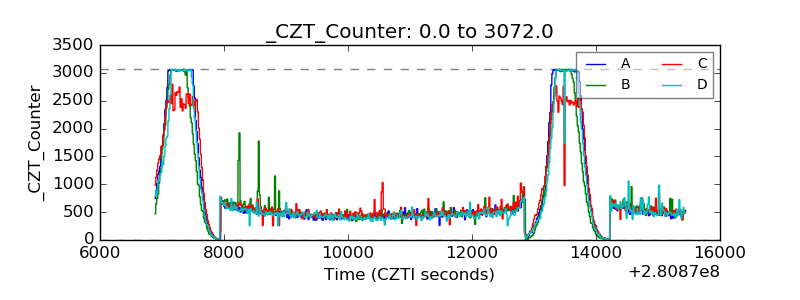 |
| +2.5 Volts monitor |  |
| +5 Volts monitor |  |
| _ROLL_ROT | 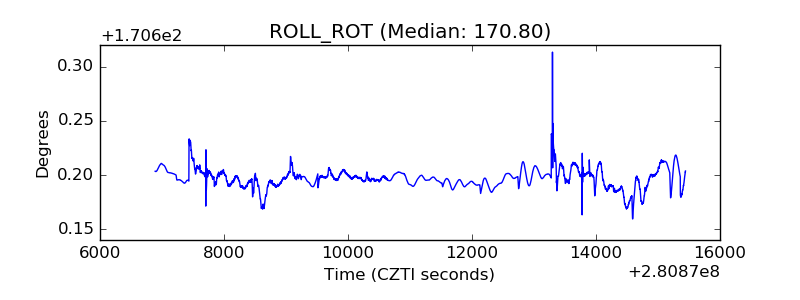 |
| _Roll_DEC | 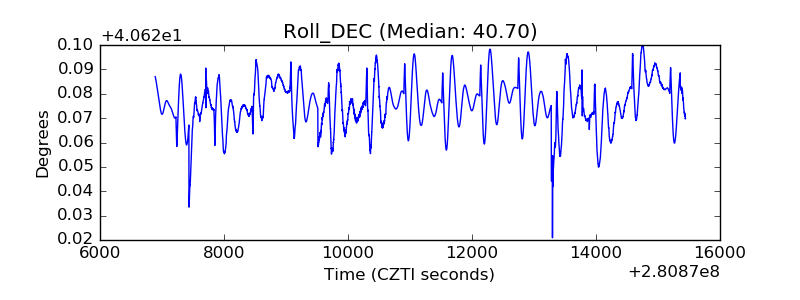 |
| _Roll_RA | 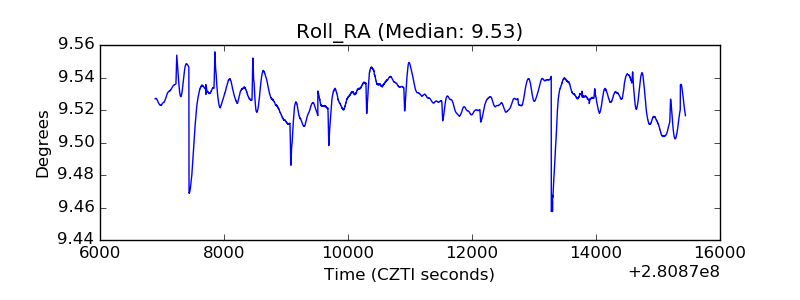 |
| Veto Counter | 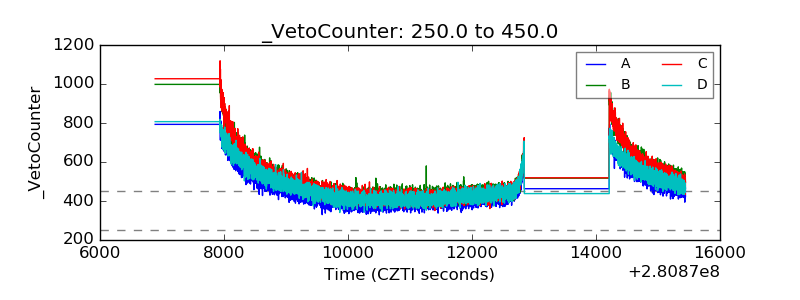 |