| Param | Original file | Final file |
|---|---|---|
| Filename | modeM0/AS1A05_004T06_9000002536_17095cztM0_level2.evt | modeM0/AS1A05_004T06_9000002536_17095cztM0_level2_quad_clean.evt |
| Size (bytes) | 437,054,400 | 85,440,960 |
| Size | 416.8 MB | 81.5 MB |
| Events in quadrant A | 3,094,149 | 549,414 |
| Events in quadrant B | 3,352,231 | 564,397 |
| Events in quadrant C | 3,128,754 | 529,729 |
| Events in quadrant D | 3,238,831 | 510,108 |
| Mode SS | |||
|---|---|---|---|
| Quadrant | BADHDUFLAG | Total packets | Discarded packets |
| A | 0 | 128 | 0 |
| B | 0 | 128 | 0 |
| C | 0 | 128 | 0 |
| D | 0 | 128 | 0 |
| Mode M0 | |||
|---|---|---|---|
| Quadrant | BADHDUFLAG | Total packets | Discarded packets |
| A | 0 | 13077 | 2 |
| B | 0 | 13787 | 2 |
| C | 0 | 13118 | 2 |
| D | 0 | 13792 | 2 |
| Mode M9 | |||
|---|---|---|---|
| Quadrant | BADHDUFLAG | Total packets | Discarded packets |
| A | 0 | 27 | 0 |
| B | 0 | 27 | 0 |
| C | 0 | 27 | 0 |
| D | 0 | 27 | 0 |
| Quadrant | Total seconds | Saturated seconds | Saturation percentage |
|---|---|---|---|
| A | 6215 | 31 | 0.498793% |
| B | 6216 | 101 | 1.624839% |
| C | 6216 | 78 | 1.254826% |
| D | 6216 | 71 | 1.142214% |
Noise dominated data is calculated using 1-second bins in cleaned event files. If a bin has >2000 counts, and if more than 50% of those come from <1% of pixels, then it is considered to be noise-dominated and hence unusable.
| Quadrant | # 1 sec bins | Bins with >0 counts | Bins with >2000 counts | High rate bins dominated by noise | Noise dominated (total time) | Noise dominated (detector-on time) | Marked lightcurve |
|---|---|---|---|---|---|---|---|
| A | 8960 | 6217 | 1 | 1 | 0.01% | 0.02% | 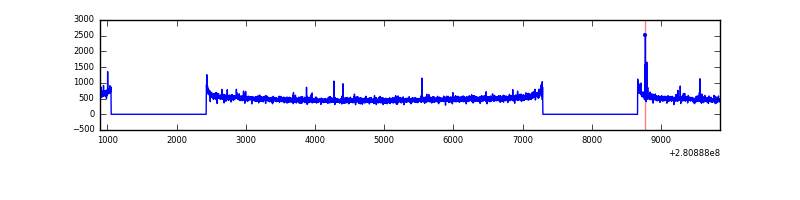 |
| B | 8961 | 6218 | 14 | 14 | 0.16% | 0.23% | 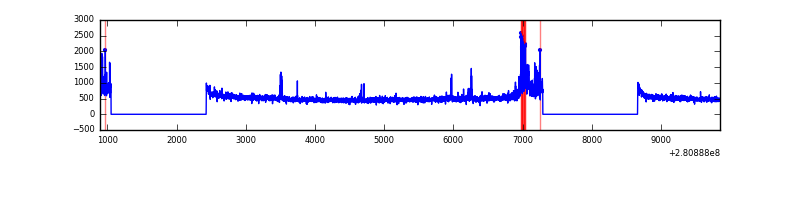 |
| C | 8961 | 6218 | 0 | 0 | 0.00% | 0.00% | 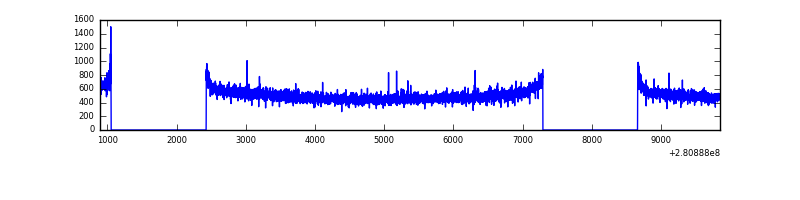 |
| D | 8961 | 6218 | 30 | 30 | 0.33% | 0.48% | 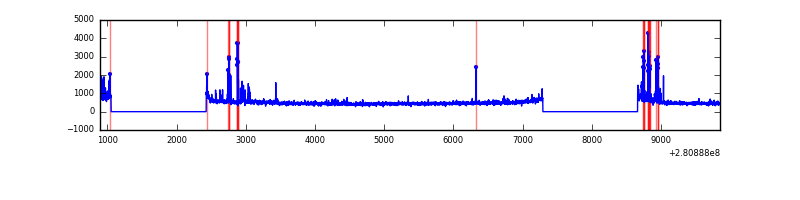 |
Top three noisy pixels from each quadrant. If the there are fewer than three noisy pixels in the level2.evt file, extra rows are filled as -1
| Pixel properties | Quadrant properties | ||||||
|---|---|---|---|---|---|---|---|
| Quadrant | DetID | PixID | Counts | Sigma | Mean | Median | Sigma |
| A | 4 | 2 | 35602 | 216.38 | 794 | 781 | 160.9 |
| A | 0 | 226 | 6984 | 38.55 | 794 | 781 | 160.9 |
| A | 12 | 194 | 5804 | 31.21 | 794 | 781 | 160.9 |
| B | 15 | 35 | 87020 | 574.56 | 800 | 783 | 150.1 |
| B | 7 | 220 | 61805 | 406.56 | 800 | 783 | 150.1 |
| B | 0 | 189 | 30010 | 194.73 | 800 | 783 | 150.1 |
| C | 14 | 238 | 118898 | 667.96 | 766 | 772 | 176.8 |
| C | 3 | 233 | 11048 | 58.11 | 766 | 772 | 176.8 |
| C | 7 | 247 | 9952 | 51.91 | 766 | 772 | 176.8 |
| D | 5 | 222 | 178273 | 945.16 | 764 | 740 | 187.8 |
| D | 10 | 70 | 104545 | 552.64 | 764 | 740 | 187.8 |
| D | 2 | 234 | 22609 | 116.43 | 764 | 740 | 187.8 |
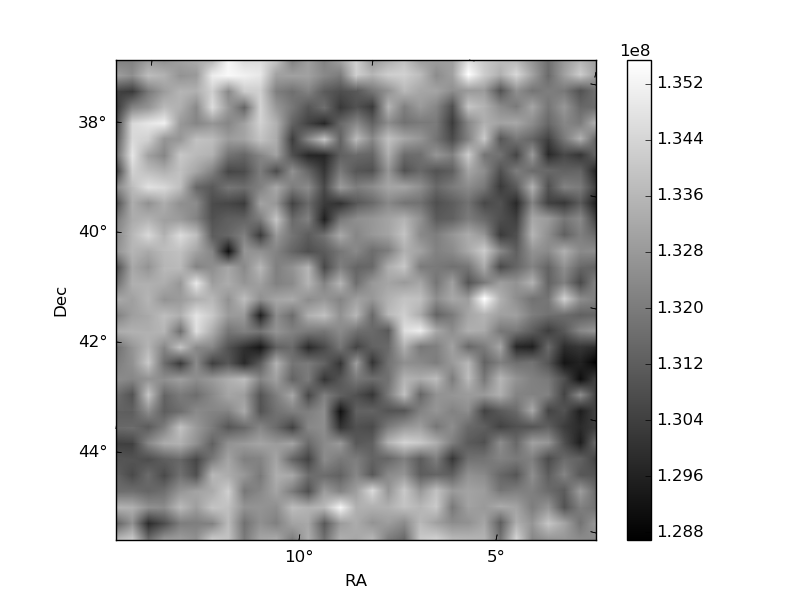
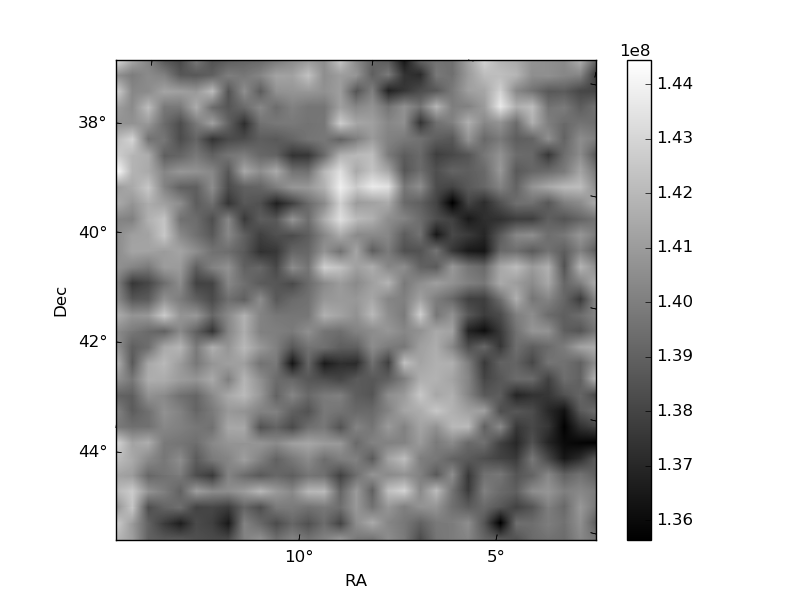
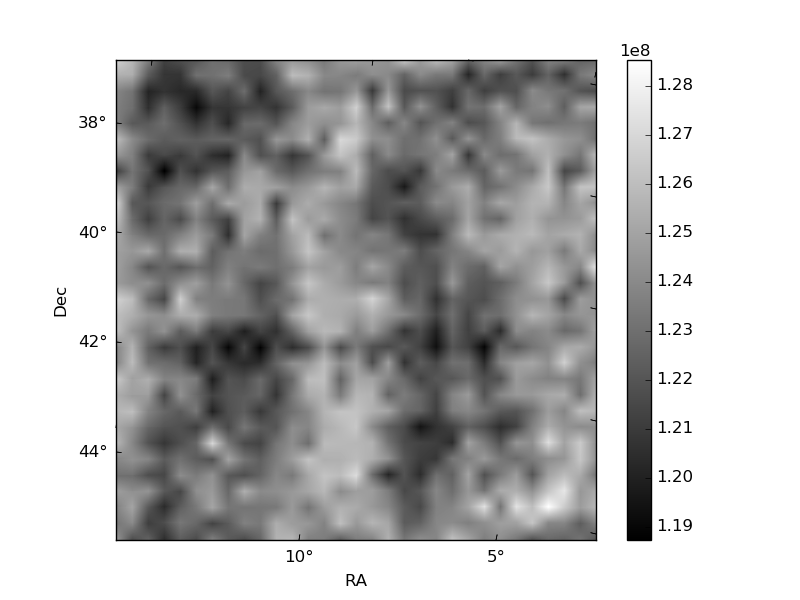
Histogram calculated using DETX and DETY for each event in the final _common_clean file
| Quadrant A | 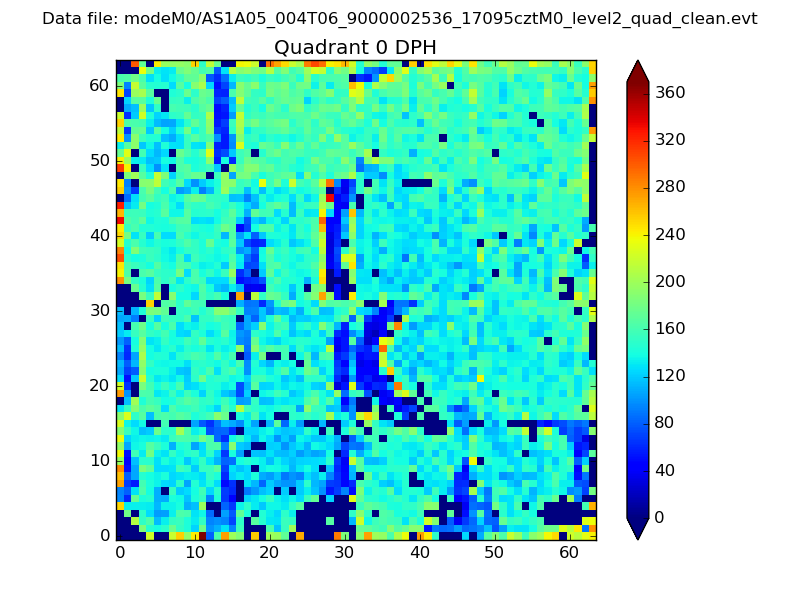 |
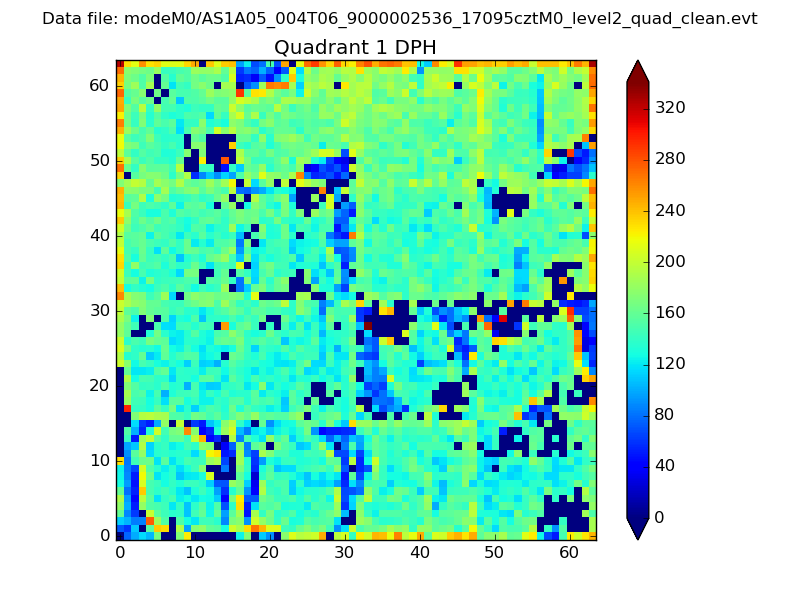 |
Quadrant B |
|---|---|---|---|
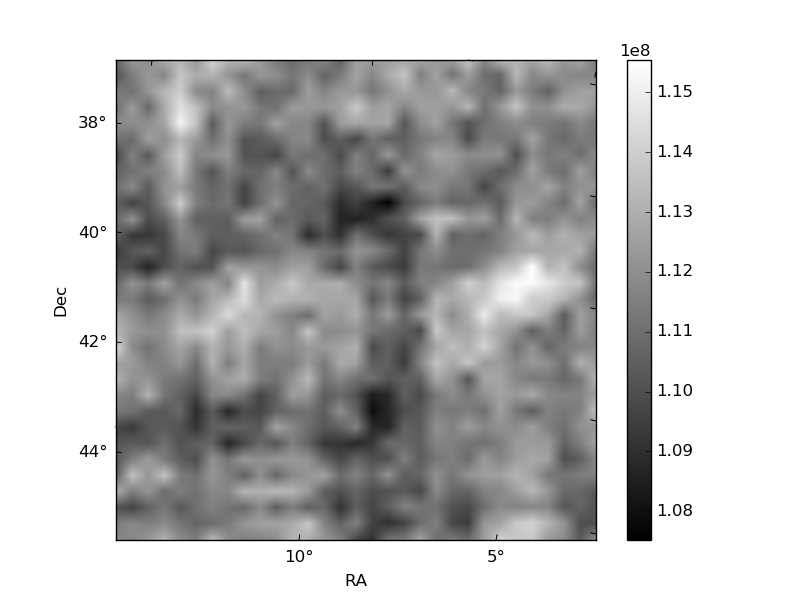
| Quadrant D | 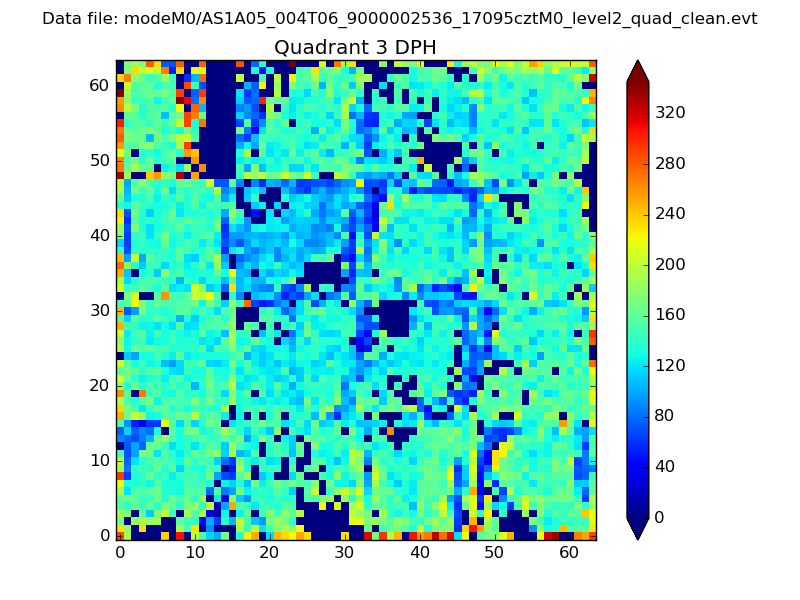 |
 |
Quadrant C |
| Plot type | Count rate plots | Images |
|---|---|---|
| Comparison with Poisson distribution Blue bars denote a histogram of data divided into 1 sec bins. Red curve is a Poisson curve with rate = median count rate of data. |
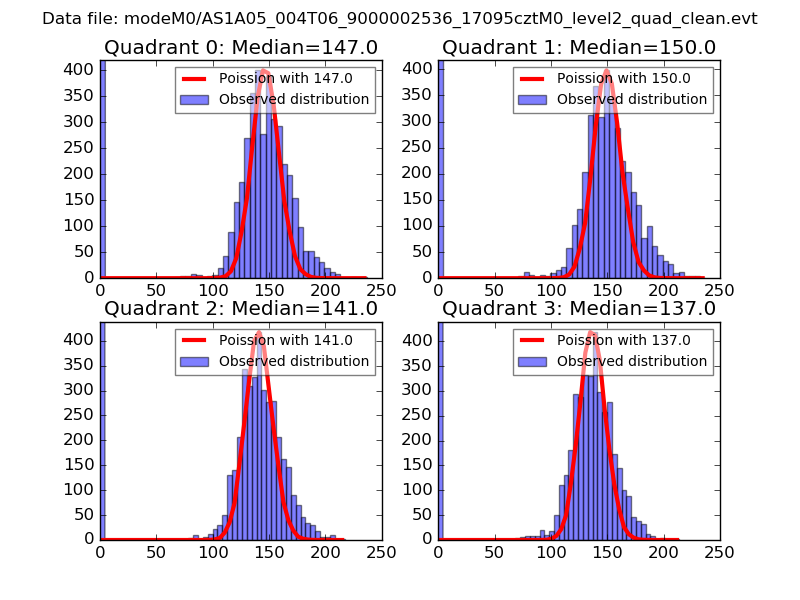 |
 |
| Quadrant-wise count rates Data is divided into 100 sec bins |
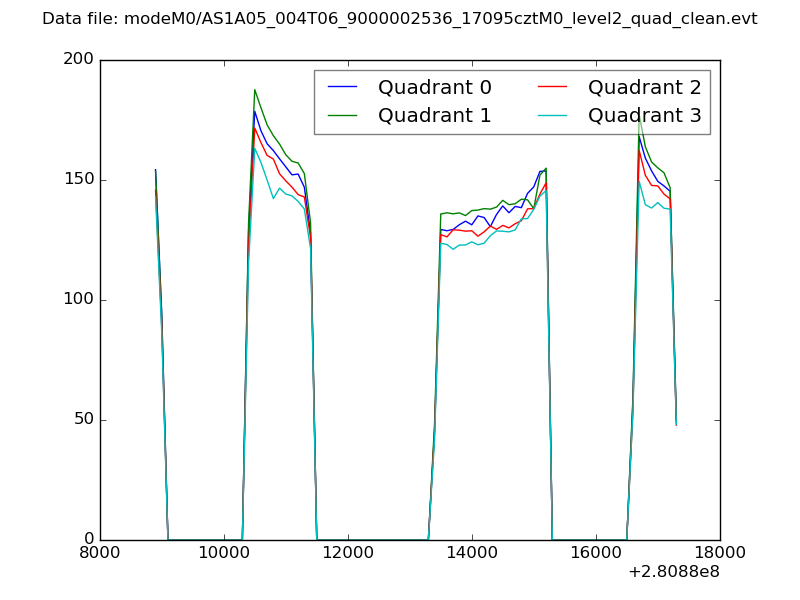 |
|
| Module-wise count rates for Quadrant A Data is divided into 100 sec bins |
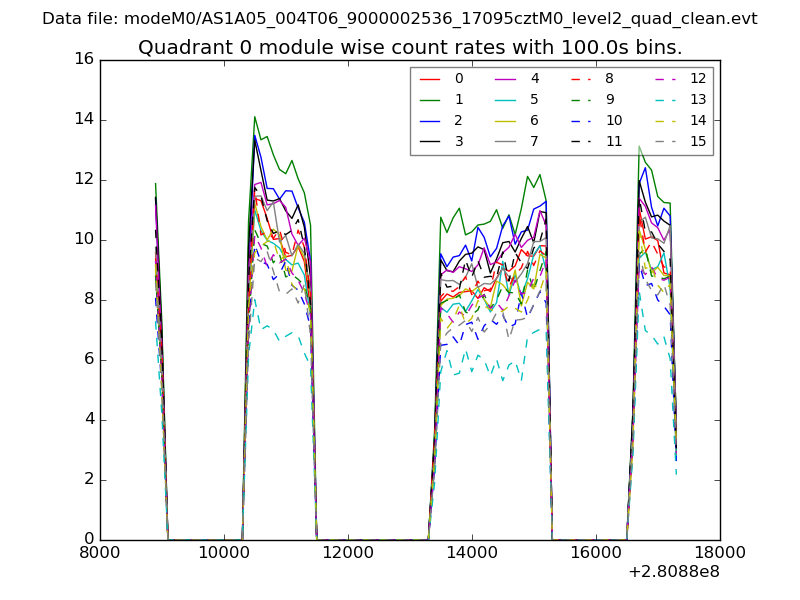 |
 |
| Module-wise count rates for Quadrant B Data is divided into 100 sec bins |
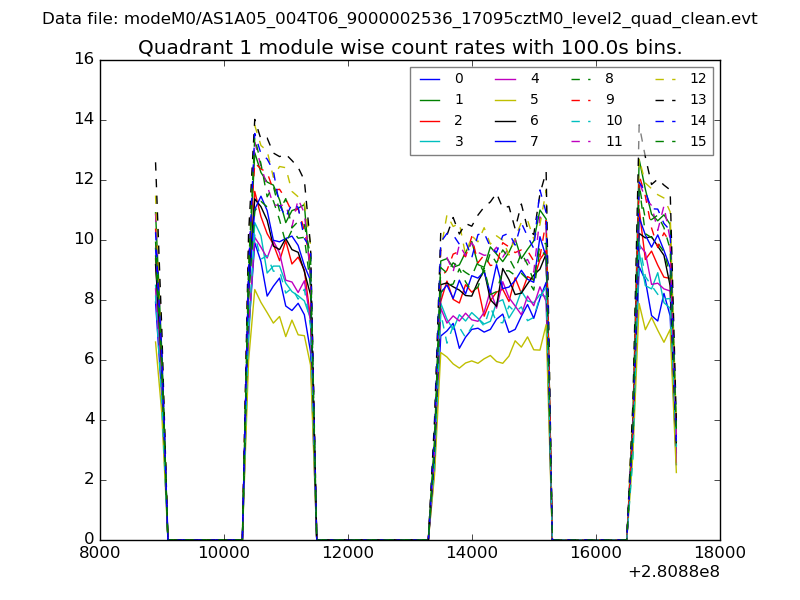 |
 |
| Module-wise count rates for Quadrant C Data is divided into 100 sec bins |
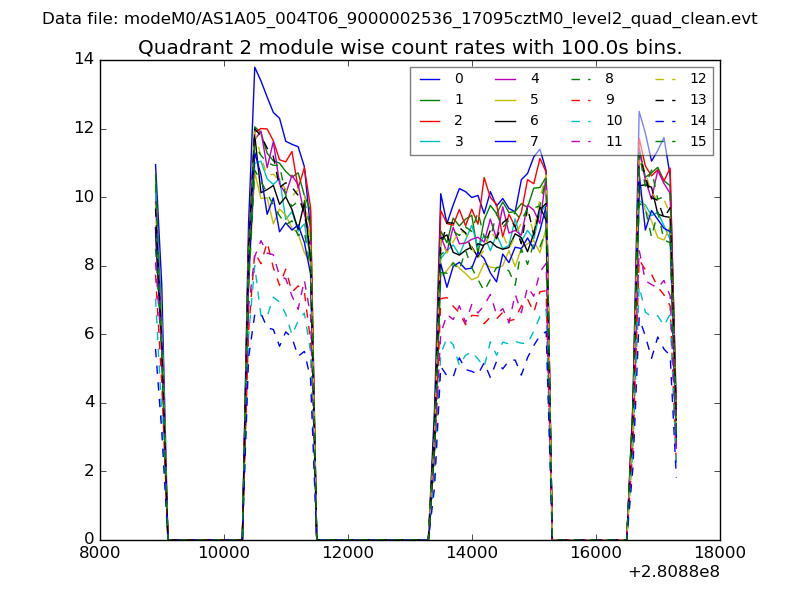 |
 |
| Module-wise count rates for Quadrant D Data is divided into 100 sec bins |
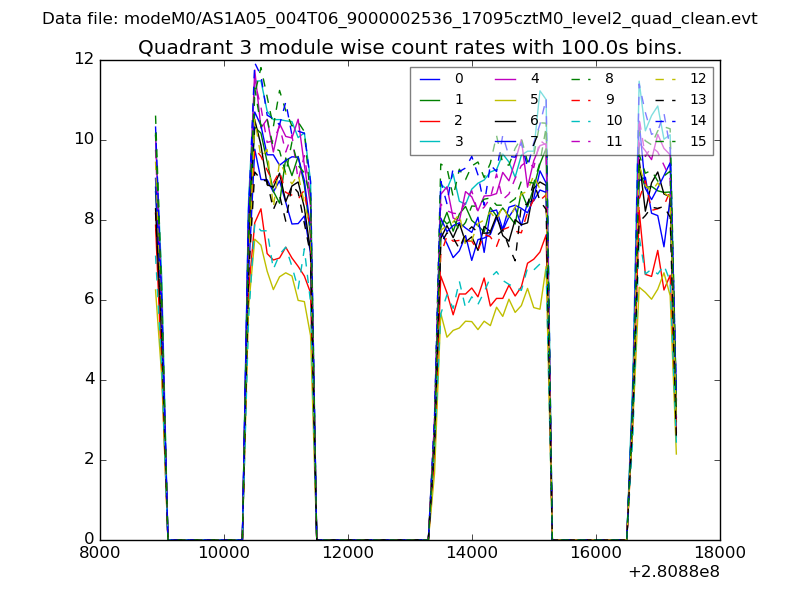 |
 |
| Parameter | Plot |
|---|---|
| CZT HV Monitor | 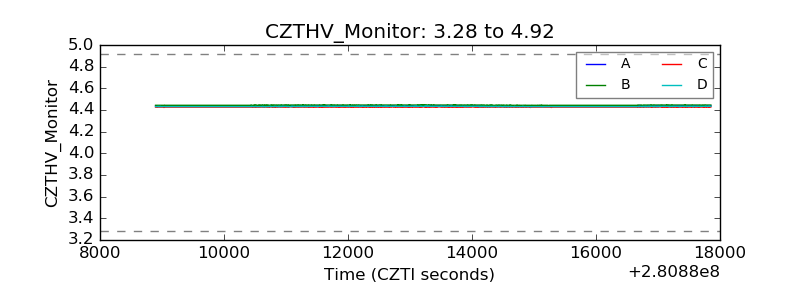 |
| D_VDD | 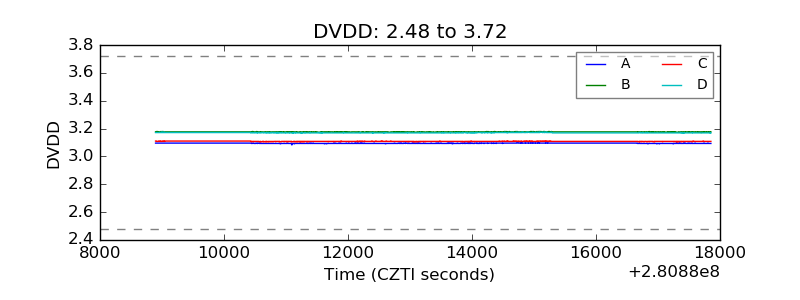 |
| Temperature 1 | 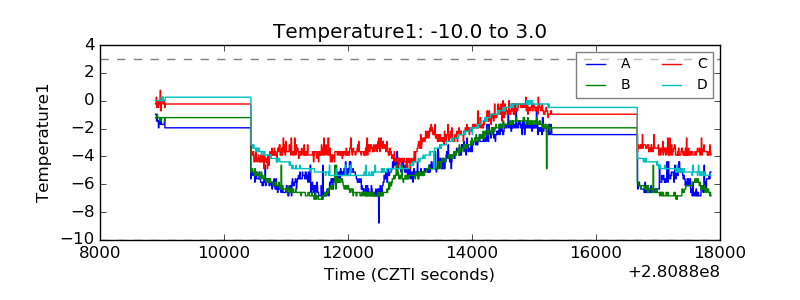 |
| Veto HV Monitor | 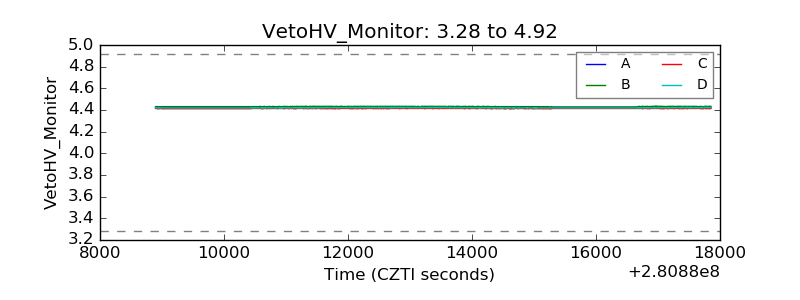 |
| Veto LLD | 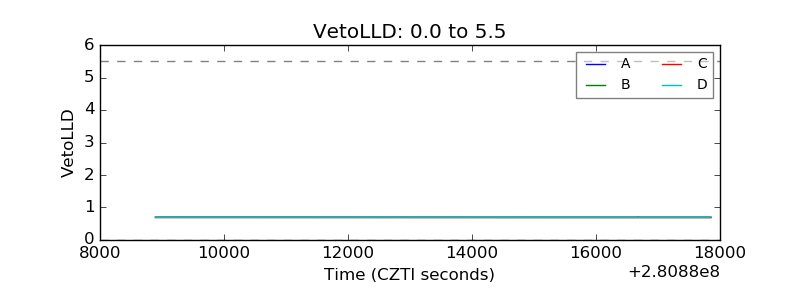 |
| Alpha Counter | 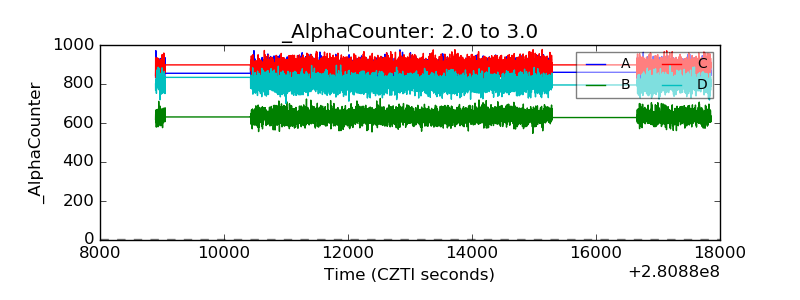 |
| _CPM_Rate | 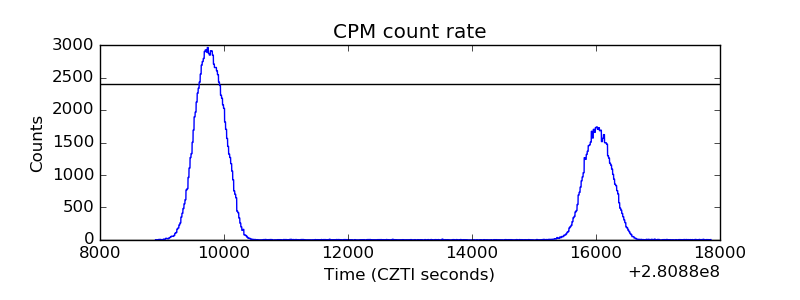 |
| CZT Counter |  |
| +2.5 Volts monitor |  |
| +5 Volts monitor |  |
| _ROLL_ROT | 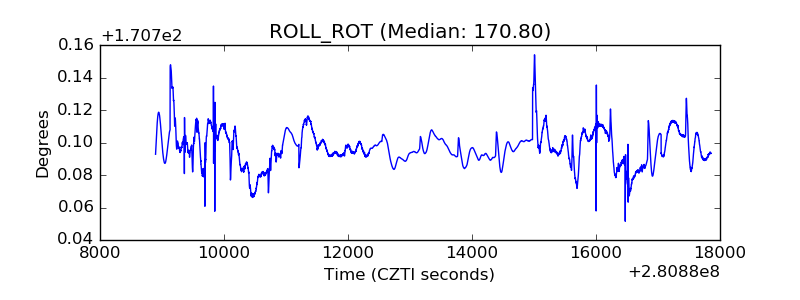 |
| _Roll_DEC | 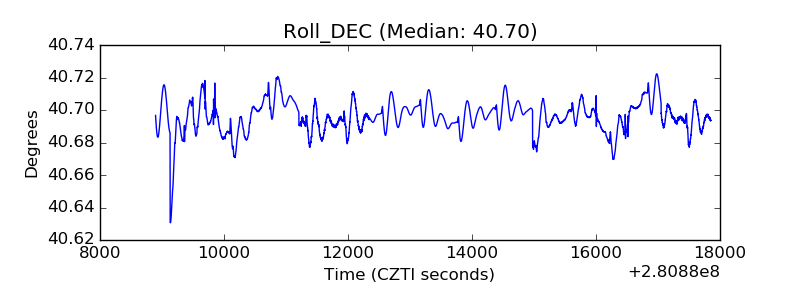 |
| _Roll_RA |  |
| Veto Counter | 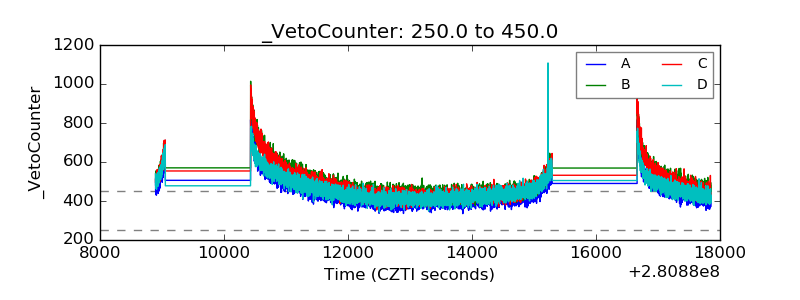 |