| Param | Original file | Final file |
|---|---|---|
| Filename | modeM0/AS1A05_004T06_9000002536_17096cztM0_level2.evt | modeM0/AS1A05_004T06_9000002536_17096cztM0_level2_quad_clean.evt |
| Size (bytes) | 473,163,840 | 80,850,240 |
| Size | 451.2 MB | 77.1 MB |
| Events in quadrant A | 3,328,156 | 502,471 |
| Events in quadrant B | 3,496,951 | 511,809 |
| Events in quadrant C | 3,368,645 | 485,794 |
| Events in quadrant D | 3,671,479 | 471,714 |
| Mode SS | |||
|---|---|---|---|
| Quadrant | BADHDUFLAG | Total packets | Discarded packets |
| A | 0 | 140 | 0 |
| B | 0 | 140 | 0 |
| C | 0 | 140 | 0 |
| D | 0 | 140 | 0 |
| Mode M0 | |||
|---|---|---|---|
| Quadrant | BADHDUFLAG | Total packets | Discarded packets |
| A | 0 | 14310 | 2 |
| B | 0 | 14643 | 2 |
| C | 0 | 14315 | 2 |
| D | 0 | 15621 | 2 |
| Mode M9 | |||
|---|---|---|---|
| Quadrant | BADHDUFLAG | Total packets | Discarded packets |
| A | 0 | 25 | 0 |
| B | 0 | 25 | 0 |
| C | 0 | 25 | 0 |
| D | 0 | 25 | 0 |
| Quadrant | Total seconds | Saturated seconds | Saturation percentage |
|---|---|---|---|
| A | 6838 | 76 | 1.111436% |
| B | 6838 | 113 | 1.652530% |
| C | 6838 | 107 | 1.564785% |
| D | 6839 | 82 | 1.199006% |
Noise dominated data is calculated using 1-second bins in cleaned event files. If a bin has >2000 counts, and if more than 50% of those come from <1% of pixels, then it is considered to be noise-dominated and hence unusable.
| Quadrant | # 1 sec bins | Bins with >0 counts | Bins with >2000 counts | High rate bins dominated by noise | Noise dominated (total time) | Noise dominated (detector-on time) | Marked lightcurve |
|---|---|---|---|---|---|---|---|
| A | 9348 | 6840 | 1 | 1 | 0.01% | 0.01% | 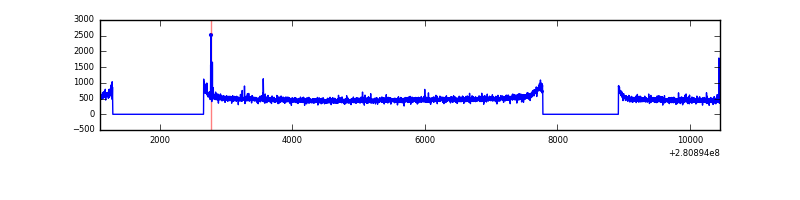 |
| B | 9348 | 6840 | 6 | 6 | 0.06% | 0.09% | 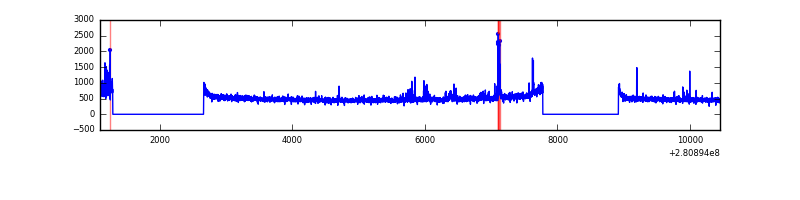 |
| C | 9348 | 6840 | 0 | 0 | 0.00% | 0.00% | 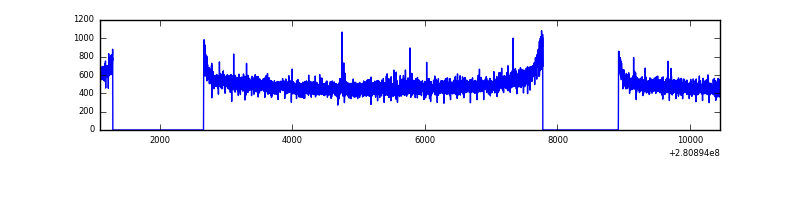 |
| D | 9349 | 6841 | 41 | 41 | 0.44% | 0.60% | 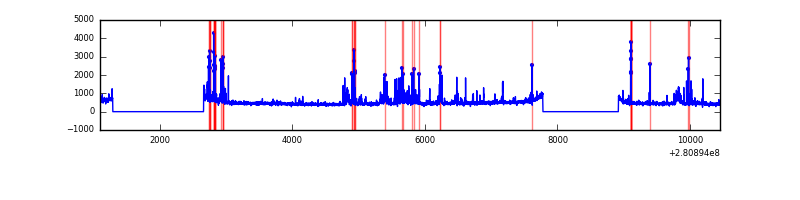 |
Top three noisy pixels from each quadrant. If the there are fewer than three noisy pixels in the level2.evt file, extra rows are filled as -1
| Pixel properties | Quadrant properties | ||||||
|---|---|---|---|---|---|---|---|
| Quadrant | DetID | PixID | Counts | Sigma | Mean | Median | Sigma |
| A | 4 | 2 | 29100 | 163.44 | 856 | 839 | 172.9 |
| A | 10 | 1 | 8838 | 46.26 | 856 | 839 | 172.9 |
| A | 0 | 226 | 7577 | 38.97 | 856 | 839 | 172.9 |
| B | 0 | 197 | 35340 | 210.89 | 861 | 839 | 163.6 |
| B | 7 | 220 | 29253 | 173.68 | 861 | 839 | 163.6 |
| B | 12 | 111 | 18877 | 110.26 | 861 | 839 | 163.6 |
| C | 14 | 238 | 126432 | 660.76 | 821 | 824 | 190.1 |
| C | 3 | 233 | 17352 | 86.95 | 821 | 824 | 190.1 |
| C | 7 | 247 | 15671 | 78.1 | 821 | 824 | 190.1 |
| D | 5 | 222 | 404250 | 2004.0 | 824 | 797 | 201.3 |
| D | 10 | 70 | 59542 | 291.79 | 824 | 797 | 201.3 |
| D | 1 | 52 | 42837 | 208.82 | 824 | 797 | 201.3 |
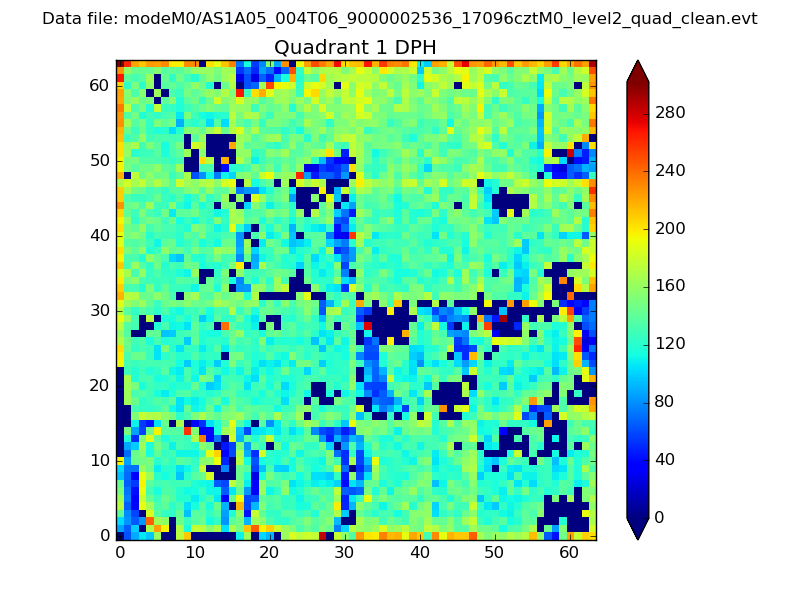
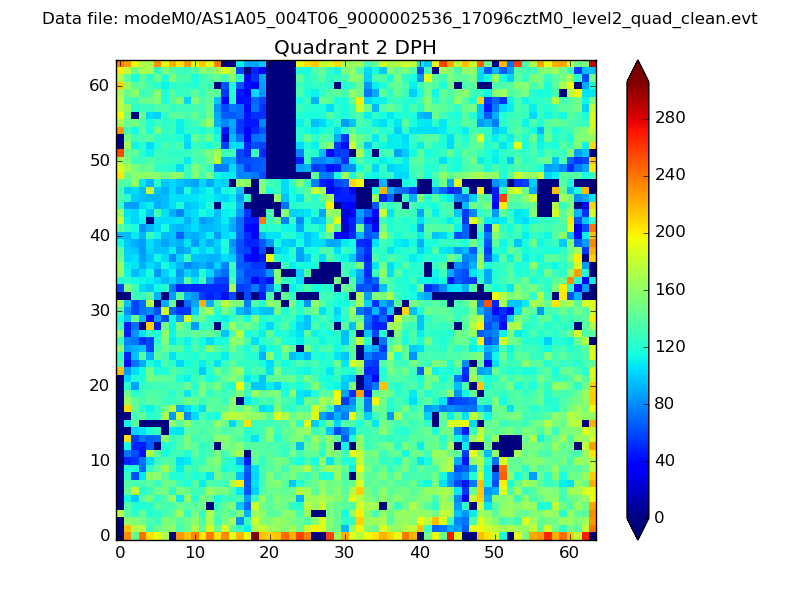
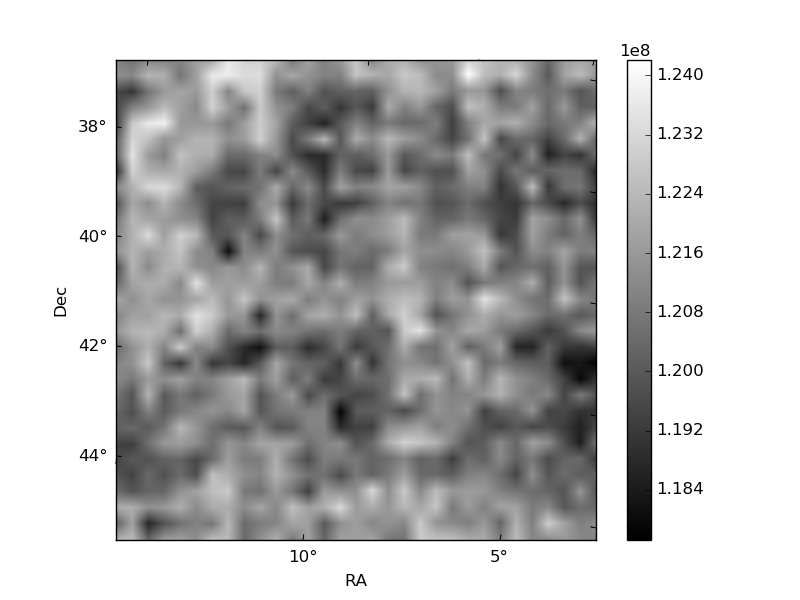
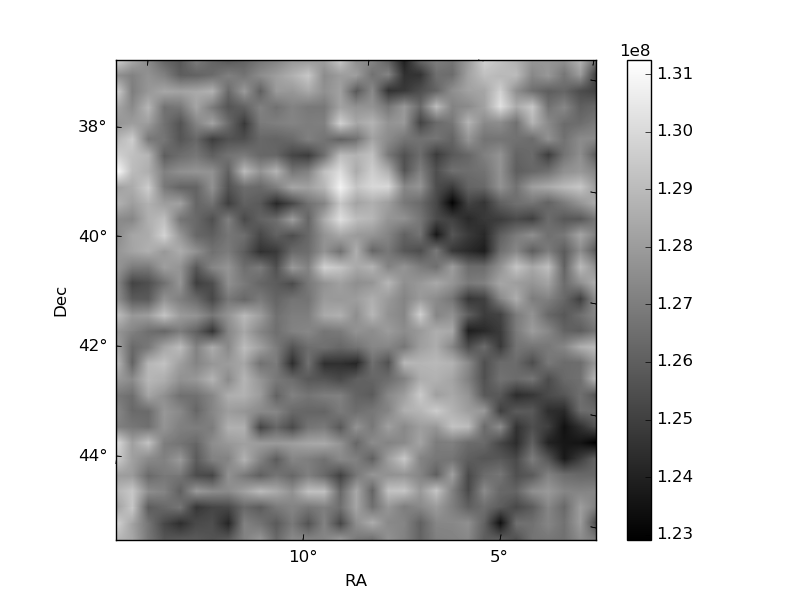
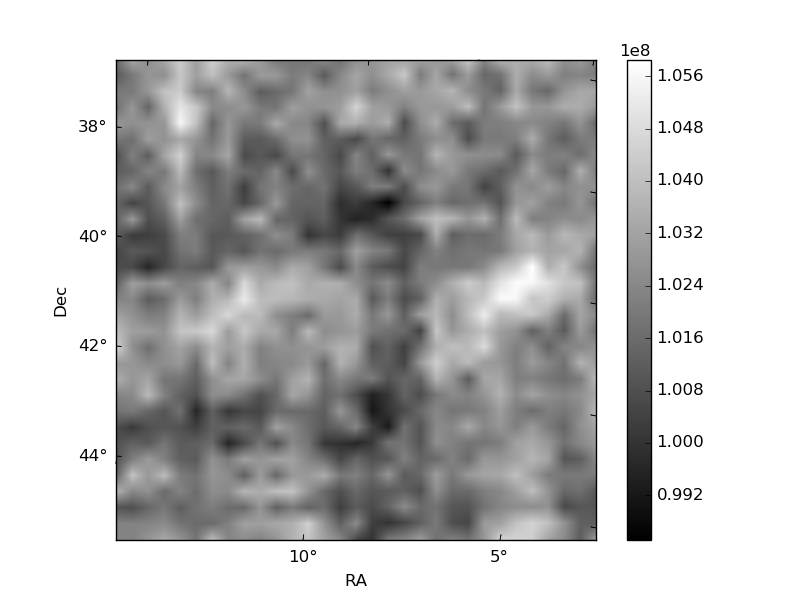
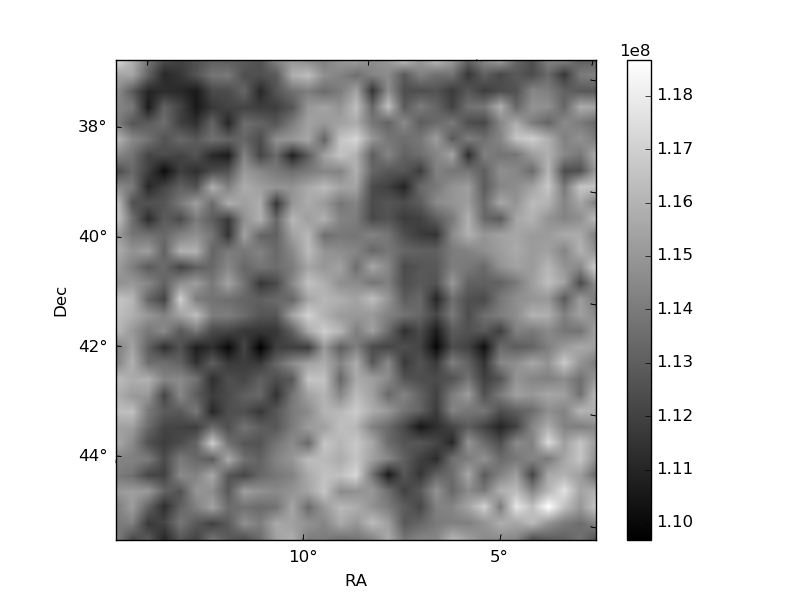
Histogram calculated using DETX and DETY for each event in the final _common_clean file
| Quadrant A |  |
 |
Quadrant B |
|---|---|---|---|
| Quadrant D | 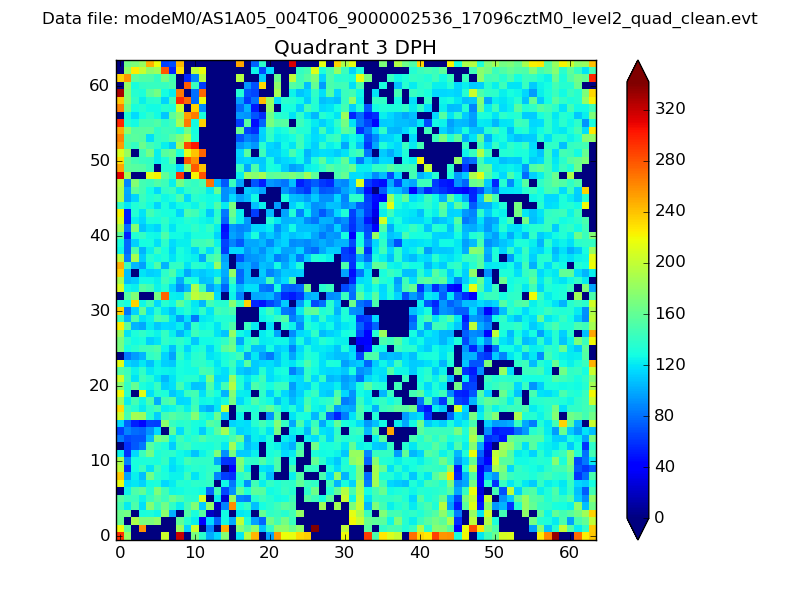 |
 |
Quadrant C |
| Plot type | Count rate plots | Images |
|---|---|---|
| Comparison with Poisson distribution Blue bars denote a histogram of data divided into 1 sec bins. Red curve is a Poisson curve with rate = median count rate of data. |
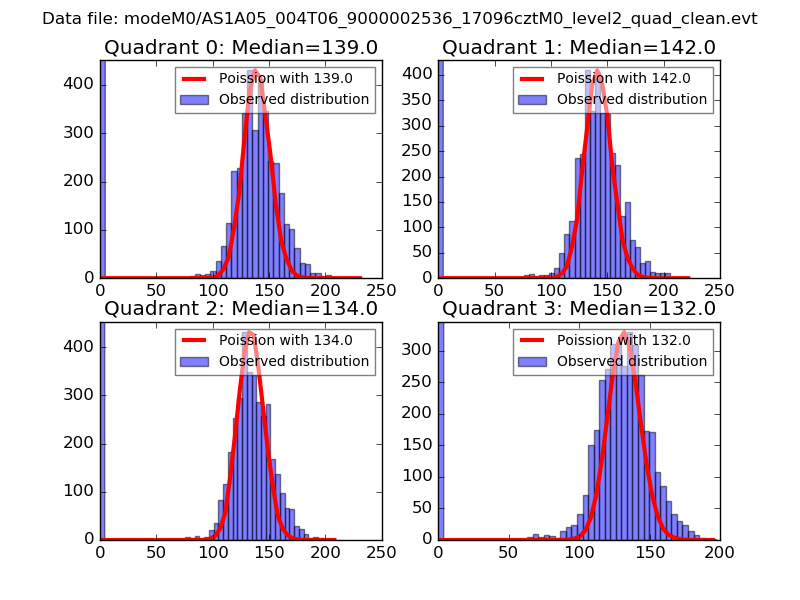 |
 |
| Quadrant-wise count rates Data is divided into 100 sec bins |
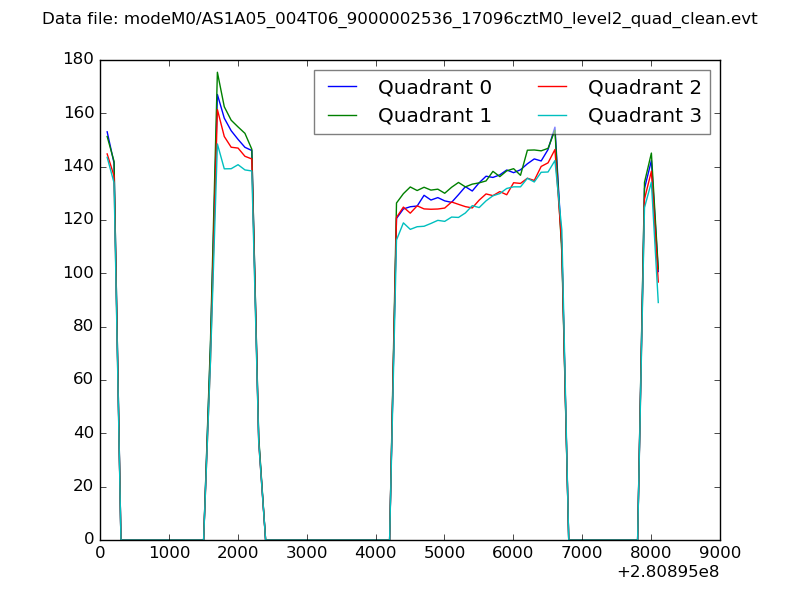 |
|
| Module-wise count rates for Quadrant A Data is divided into 100 sec bins |
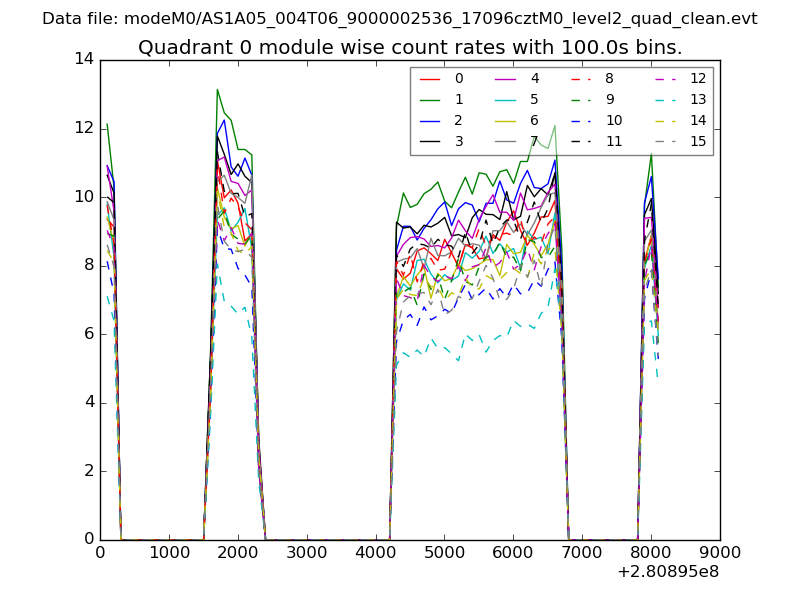 |
 |
| Module-wise count rates for Quadrant B Data is divided into 100 sec bins |
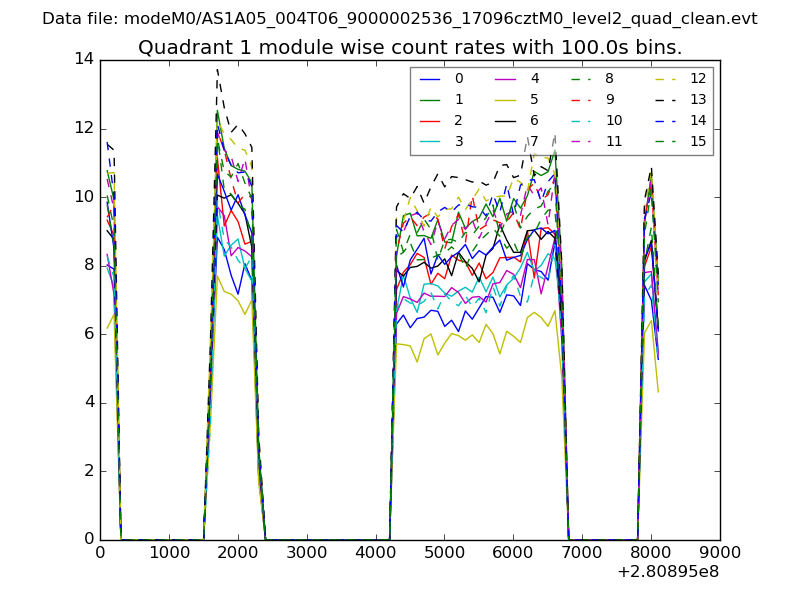 |
 |
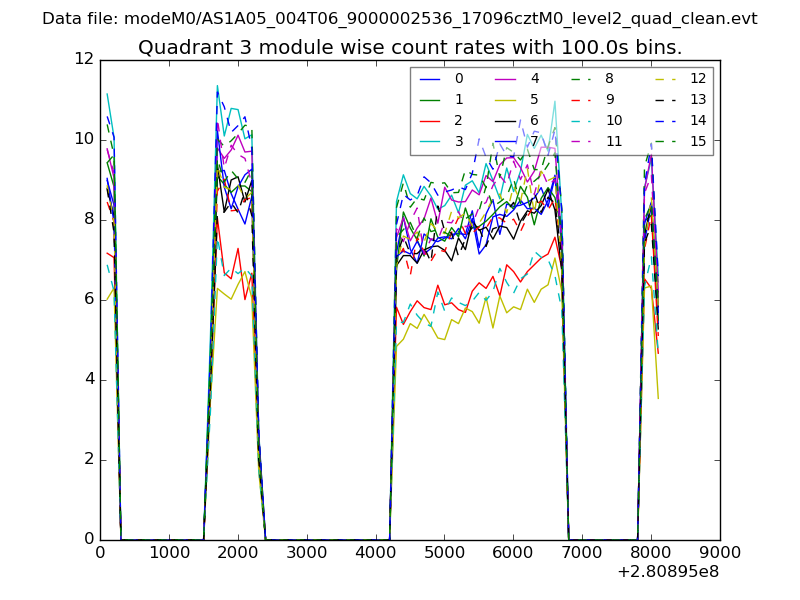
| Module-wise count rates for Quadrant C Data is divided into 100 sec bins |
 |
 |
| Module-wise count rates for Quadrant D Data is divided into 100 sec bins |
 |
 |
| Parameter | Plot |
|---|---|
| CZT HV Monitor | 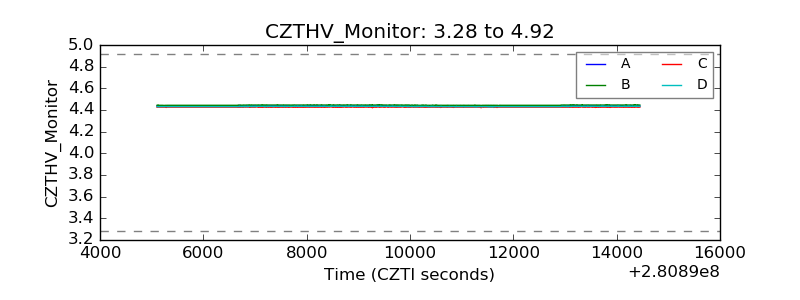 |
| D_VDD | 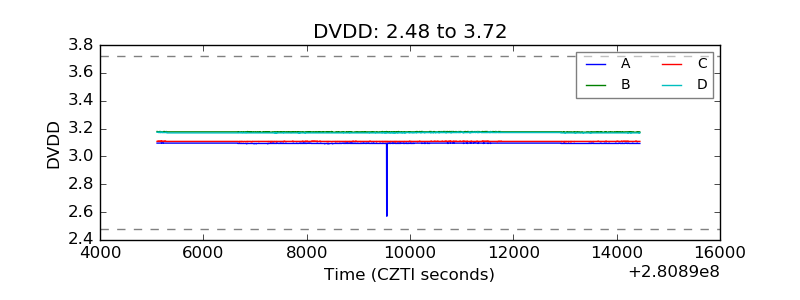 |
| Temperature 1 | 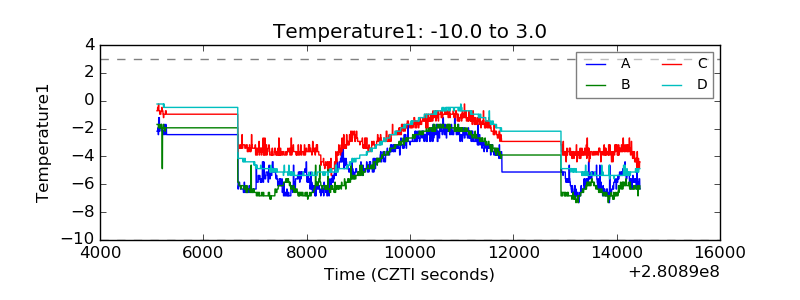 |
| Veto HV Monitor |  |
| Veto LLD | 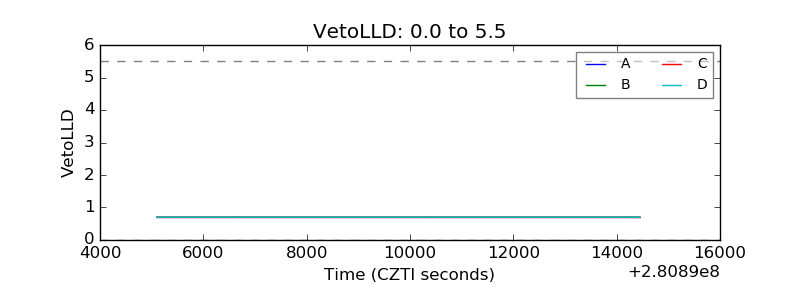 |
| Alpha Counter | 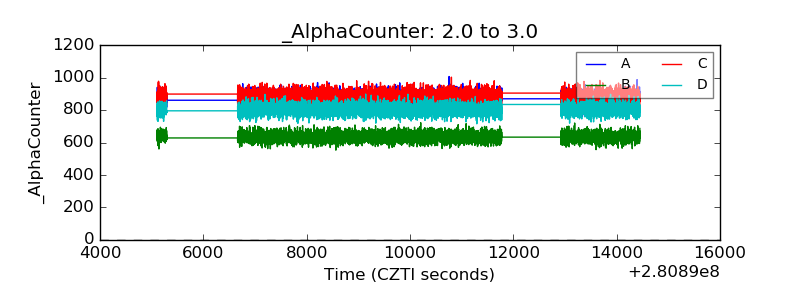 |
| _CPM_Rate | 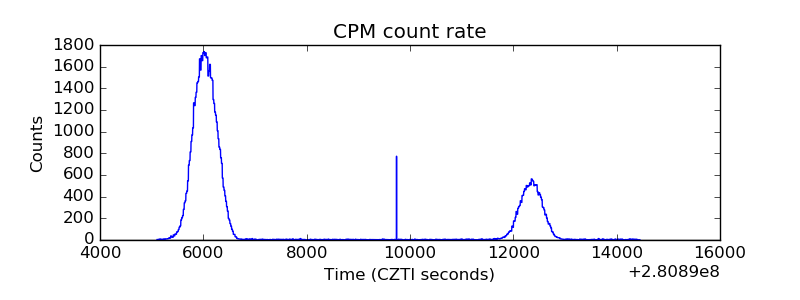 |
| CZT Counter | 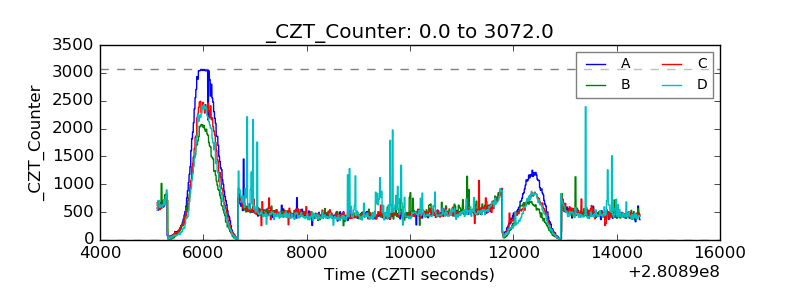 |
| +2.5 Volts monitor |  |
| +5 Volts monitor |  |
| _ROLL_ROT | 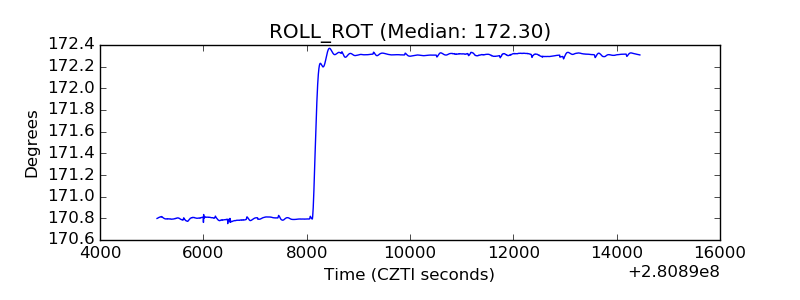 |
| _Roll_DEC | 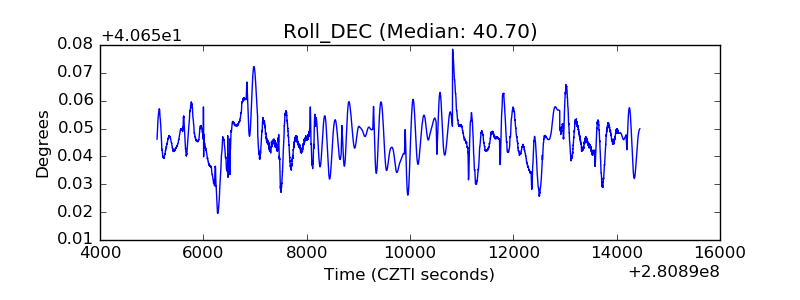 |
| _Roll_RA |  |
| Veto Counter | 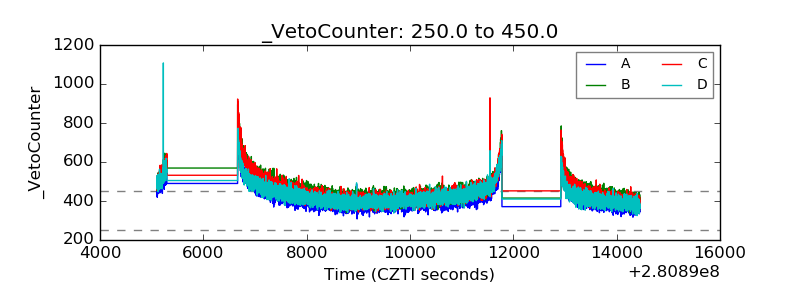 |