| Param | Original file | Final file |
|---|---|---|
| Filename | modeM0/AS1A05_004T06_9000002536_17097cztM0_level2.evt | modeM0/AS1A05_004T06_9000002536_17097cztM0_level2_quad_clean.evt |
| Size (bytes) | 482,244,480 | 79,159,680 |
| Size | 459.9 MB | 75.5 MB |
| Events in quadrant A | 3,435,259 | 482,645 |
| Events in quadrant B | 3,577,776 | 488,616 |
| Events in quadrant C | 3,503,998 | 466,596 |
| Events in quadrant D | 3,598,491 | 457,867 |
| Mode SS | |||
|---|---|---|---|
| Quadrant | BADHDUFLAG | Total packets | Discarded packets |
| A | 0 | 146 | 0 |
| B | 0 | 146 | 0 |
| C | 0 | 146 | 0 |
| D | 0 | 146 | 0 |
| Mode M0 | |||
|---|---|---|---|
| Quadrant | BADHDUFLAG | Total packets | Discarded packets |
| A | 0 | 14985 | 2 |
| B | 0 | 15188 | 2 |
| C | 0 | 14983 | 2 |
| D | 0 | 15744 | 3 |
| Mode M9 | |||
|---|---|---|---|
| Quadrant | BADHDUFLAG | Total packets | Discarded packets |
| A | 0 | 20 | 0 |
| B | 0 | 20 | 0 |
| C | 0 | 20 | 0 |
| D | 0 | 20 | 0 |
| Quadrant | Total seconds | Saturated seconds | Saturation percentage |
|---|---|---|---|
| A | 7205 | 120 | 1.665510% |
| B | 7206 | 159 | 2.206495% |
| C | 7206 | 150 | 2.081599% |
| D | 7205 | 101 | 1.401804% |
Noise dominated data is calculated using 1-second bins in cleaned event files. If a bin has >2000 counts, and if more than 50% of those come from <1% of pixels, then it is considered to be noise-dominated and hence unusable.
| Quadrant | # 1 sec bins | Bins with >0 counts | Bins with >2000 counts | High rate bins dominated by noise | Noise dominated (total time) | Noise dominated (detector-on time) | Marked lightcurve |
|---|---|---|---|---|---|---|---|
| A | 9100 | 7208 | 0 | 0 | 0.00% | 0.00% | 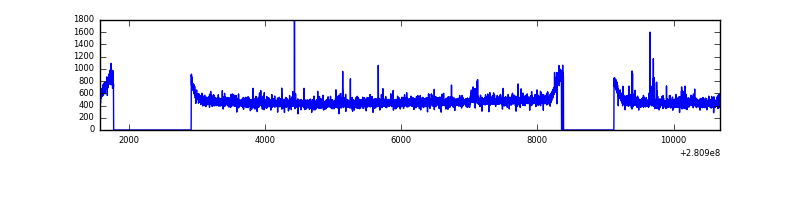 |
| B | 9101 | 7209 | 0 | 0 | 0.00% | 0.00% | 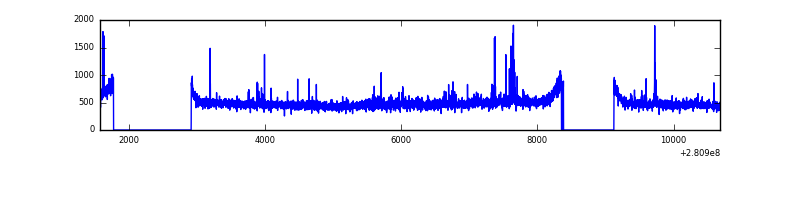 |
| C | 9101 | 7209 | 0 | 0 | 0.00% | 0.00% | 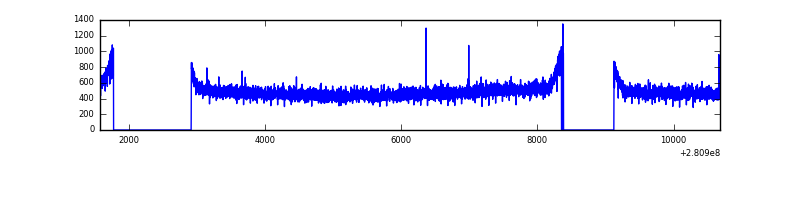 |
| D | 9100 | 7207 | 30 | 30 | 0.33% | 0.42% | 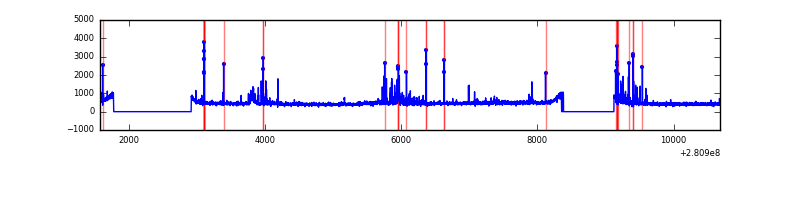 |
Top three noisy pixels from each quadrant. If the there are fewer than three noisy pixels in the level2.evt file, extra rows are filled as -1
| Pixel properties | Quadrant properties | ||||||
|---|---|---|---|---|---|---|---|
| Quadrant | DetID | PixID | Counts | Sigma | Mean | Median | Sigma |
| A | 4 | 2 | 42389 | 231.58 | 881 | 862 | 179.3 |
| A | 0 | 226 | 7505 | 37.05 | 881 | 862 | 179.3 |
| A | 12 | 194 | 6448 | 31.15 | 881 | 862 | 179.3 |
| B | 0 | 229 | 42840 | 246.23 | 885 | 861 | 170.5 |
| B | 0 | 197 | 23271 | 131.45 | 885 | 861 | 170.5 |
| B | 4 | 216 | 23116 | 130.54 | 885 | 861 | 170.5 |
| C | 14 | 238 | 132116 | 658.45 | 848 | 854 | 199.3 |
| C | 3 | 233 | 35167 | 172.13 | 848 | 854 | 199.3 |
| C | 7 | 247 | 20048 | 96.28 | 848 | 854 | 199.3 |
| D | 1 | 52 | 197233 | 939.26 | 856 | 829 | 209.1 |
| D | 5 | 222 | 124900 | 593.34 | 856 | 829 | 209.1 |
| D | 2 | 234 | 27162 | 125.93 | 856 | 829 | 209.1 |
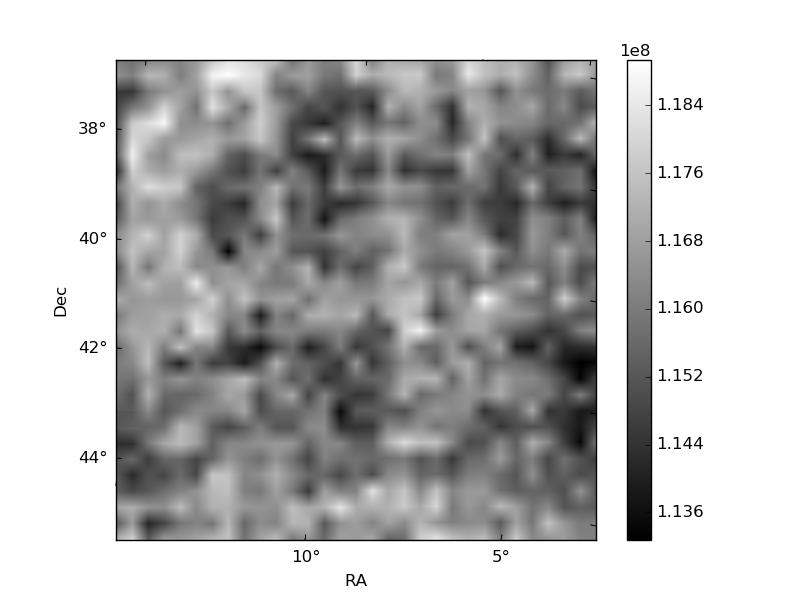
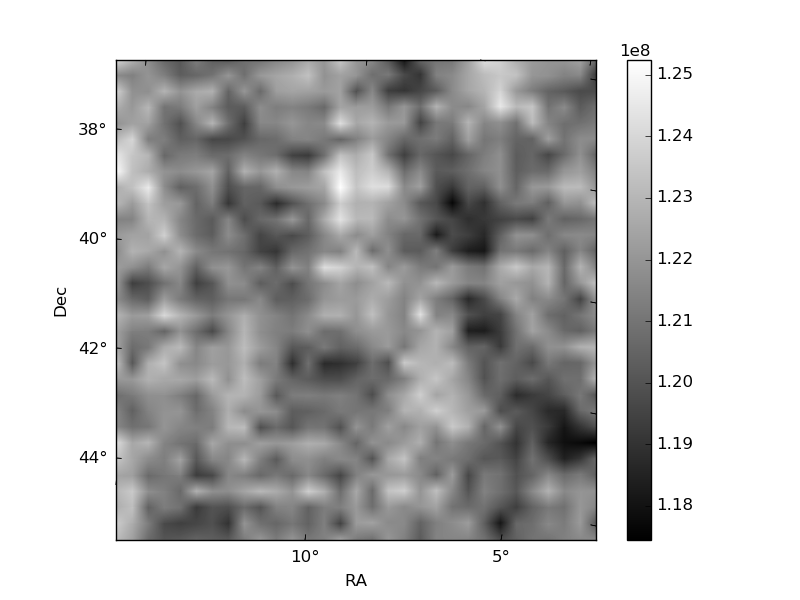
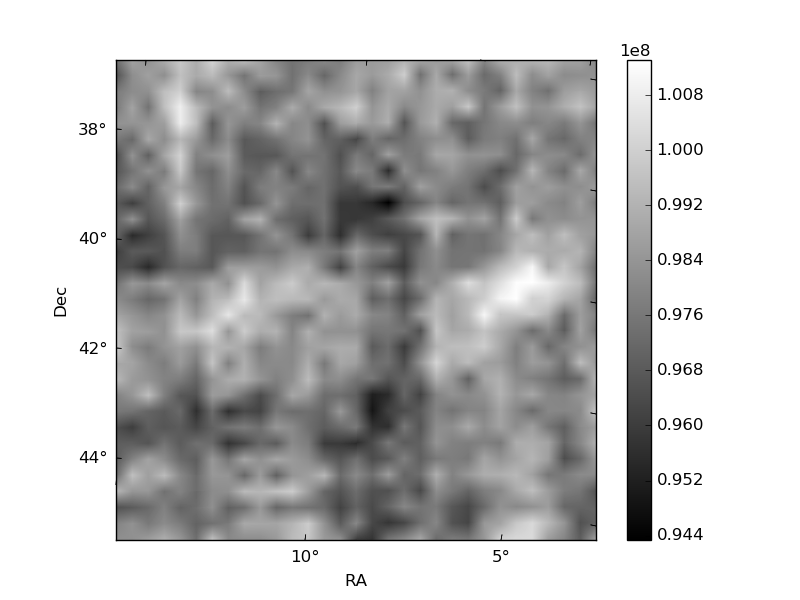
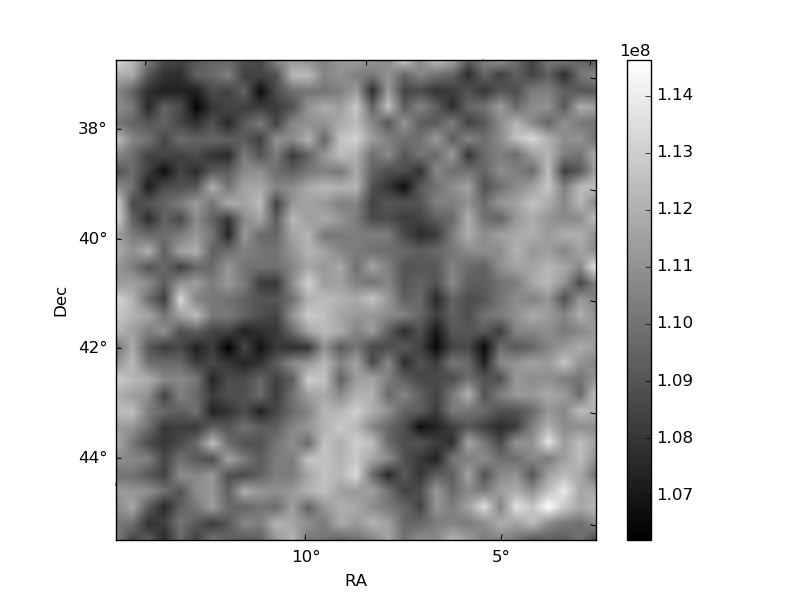
Histogram calculated using DETX and DETY for each event in the final _common_clean file
| Quadrant A | 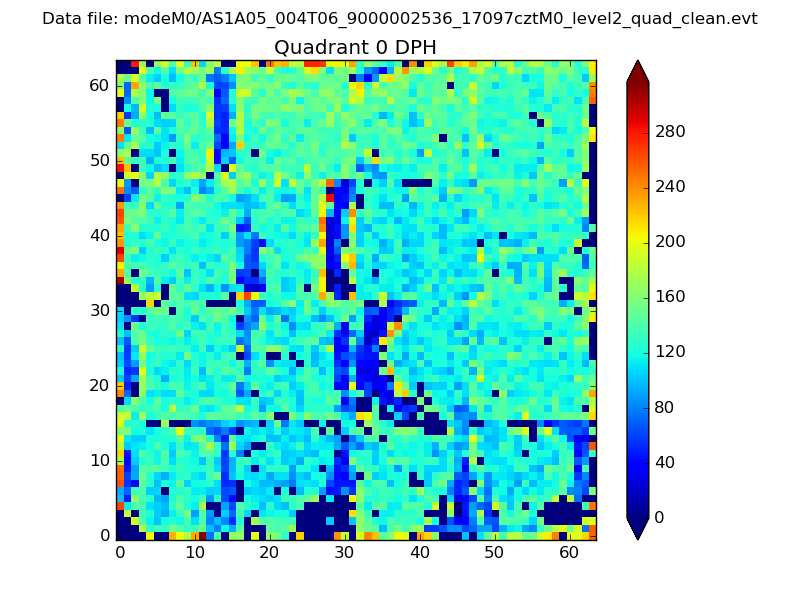 |
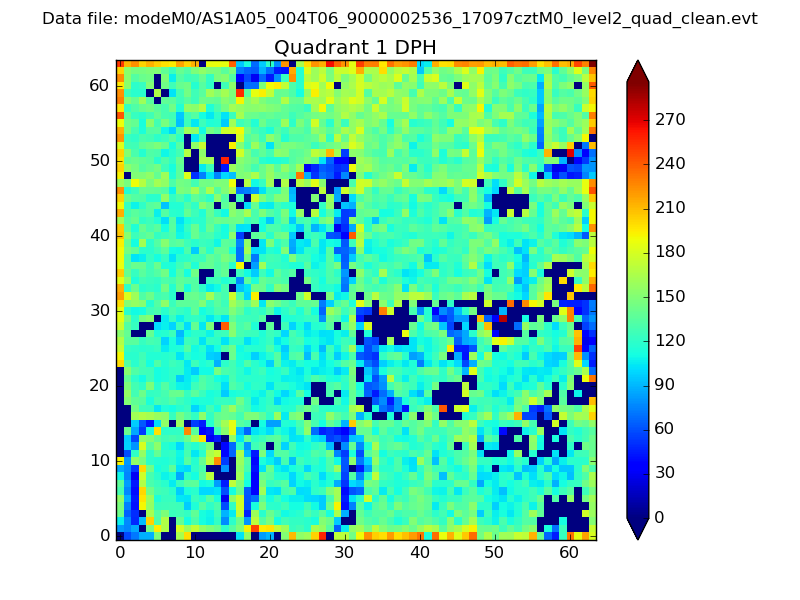 |
Quadrant B |
|---|---|---|---|
| Quadrant D | 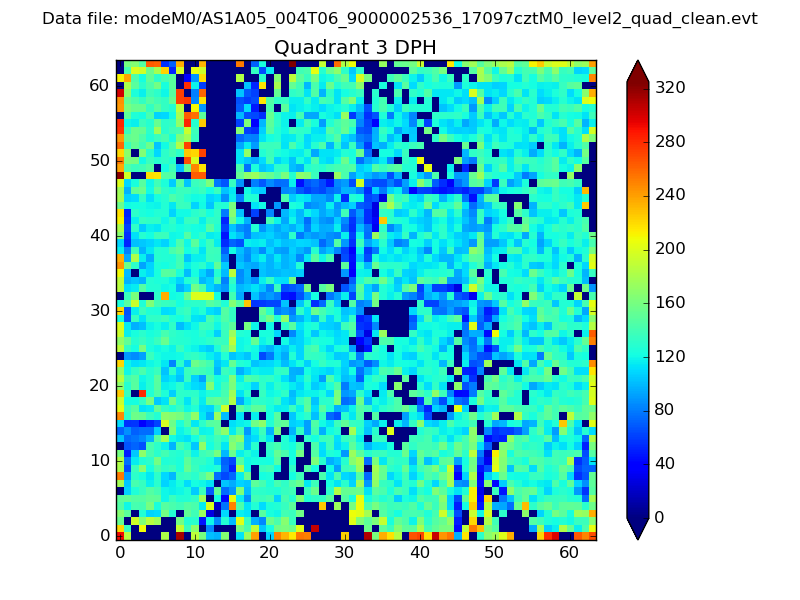 |
 |
Quadrant C |
| Plot type | Count rate plots | Images |
|---|---|---|
| Comparison with Poisson distribution Blue bars denote a histogram of data divided into 1 sec bins. Red curve is a Poisson curve with rate = median count rate of data. |
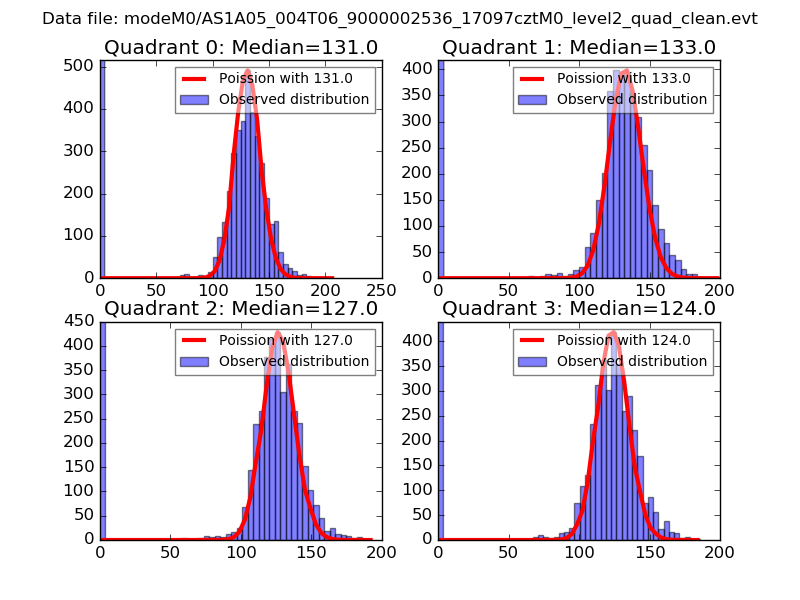 |
 |
| Quadrant-wise count rates Data is divided into 100 sec bins |
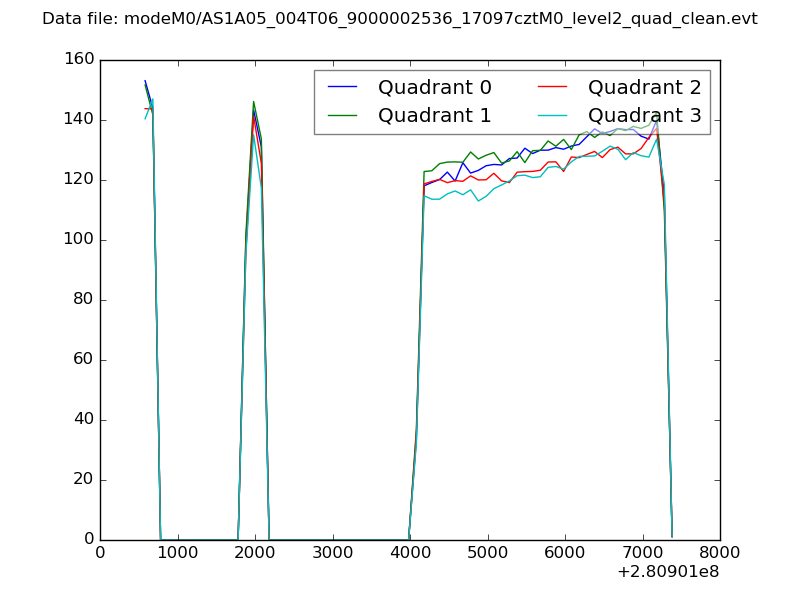 |
|
| Module-wise count rates for Quadrant A Data is divided into 100 sec bins |
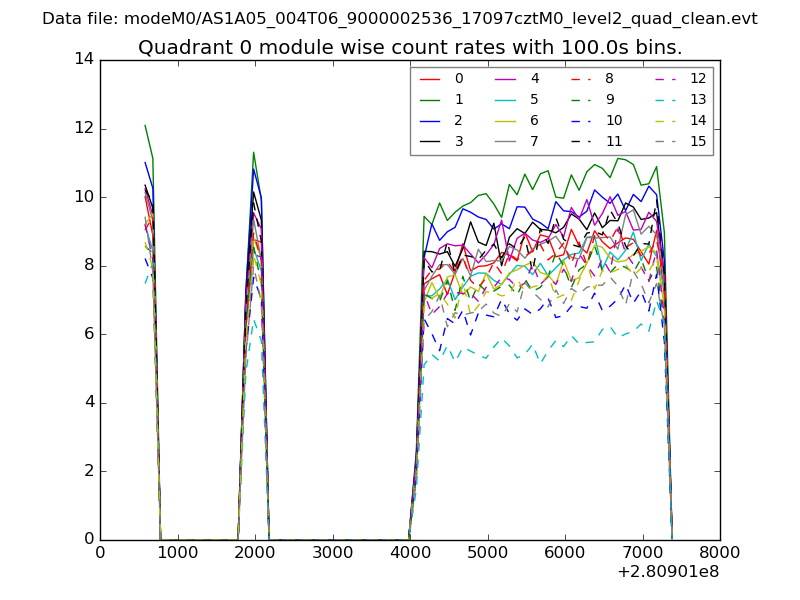 |
 |
| Module-wise count rates for Quadrant B Data is divided into 100 sec bins |
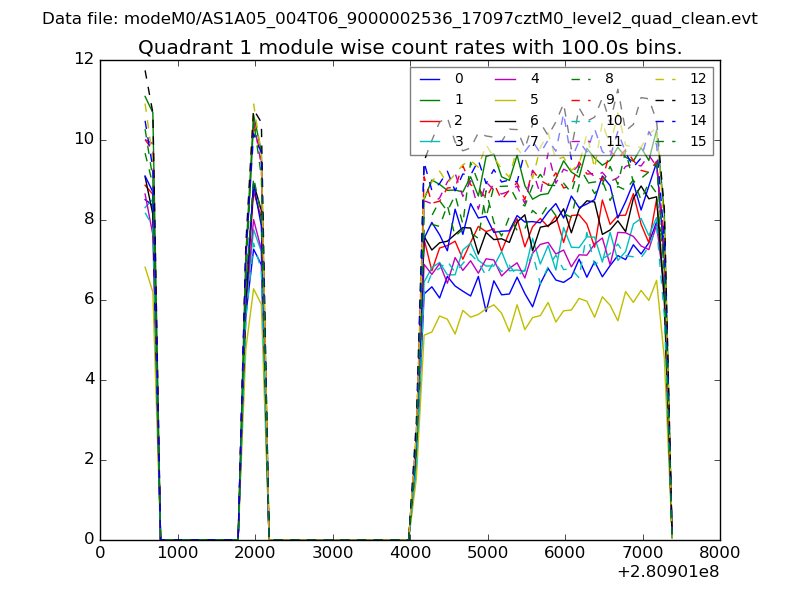 |
 |
| Module-wise count rates for Quadrant C Data is divided into 100 sec bins |
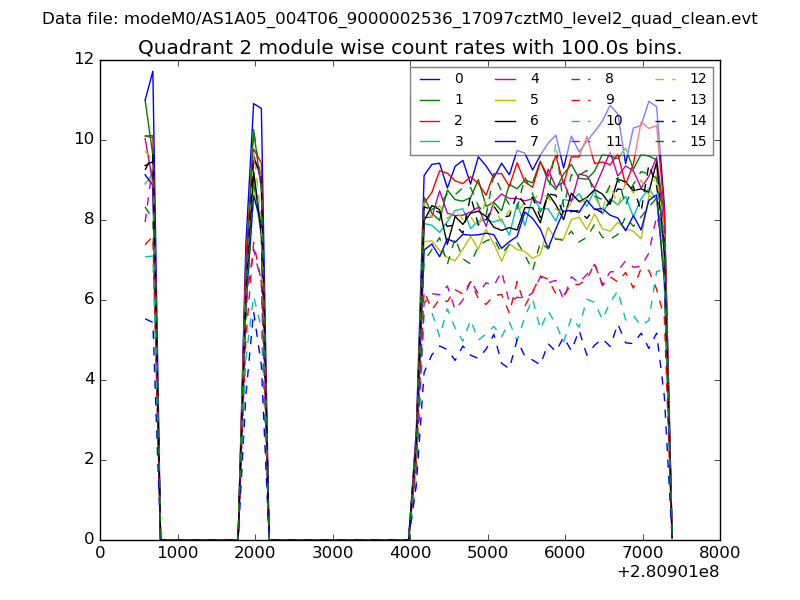 |
 |
| Module-wise count rates for Quadrant D Data is divided into 100 sec bins |
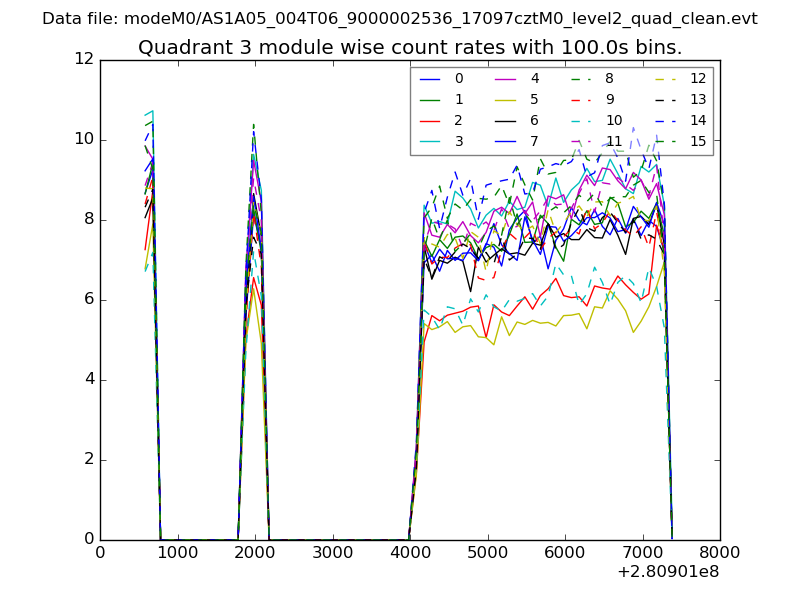 |
 |
| Parameter | Plot |
|---|---|
| CZT HV Monitor | 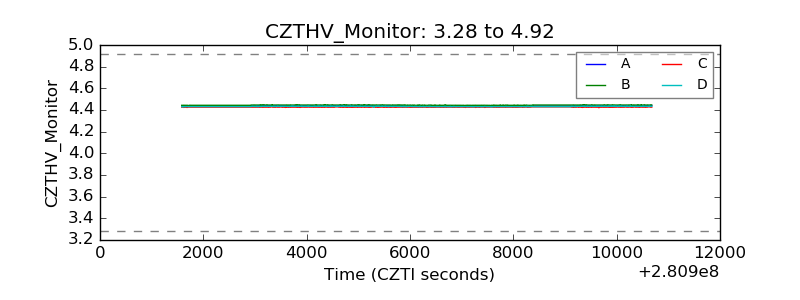 |
| D_VDD | 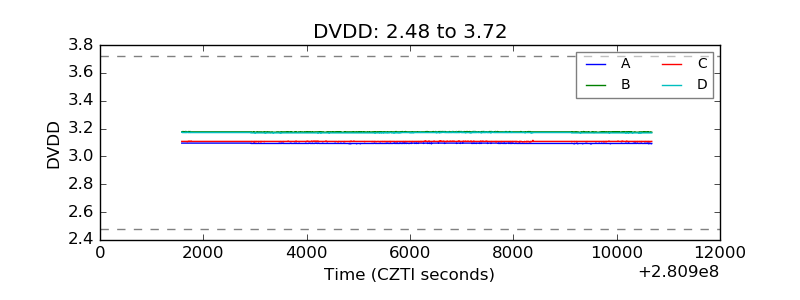 |
| Temperature 1 | 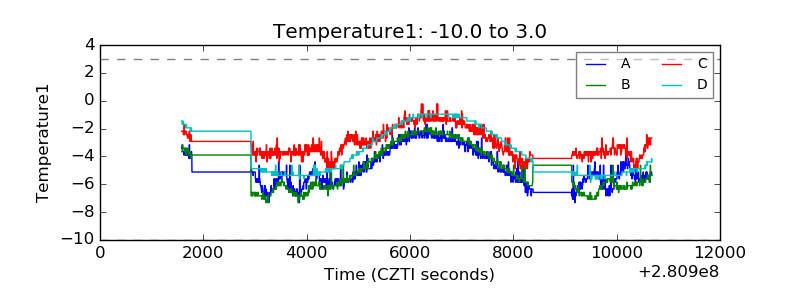 |
| Veto HV Monitor | 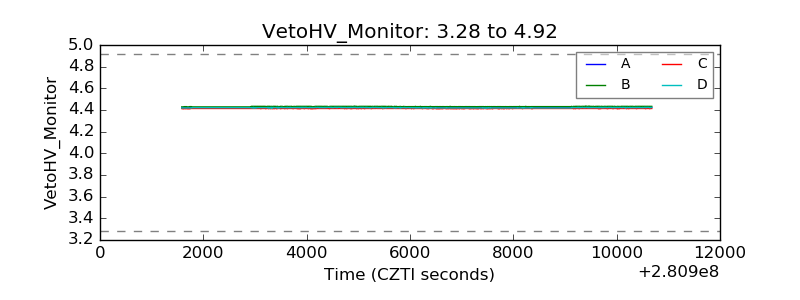 |
| Veto LLD | 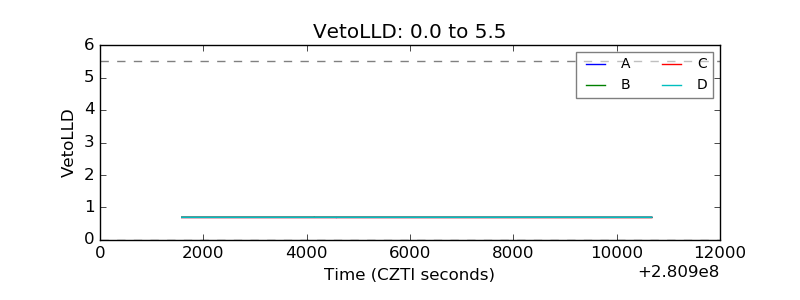 |
| Alpha Counter | 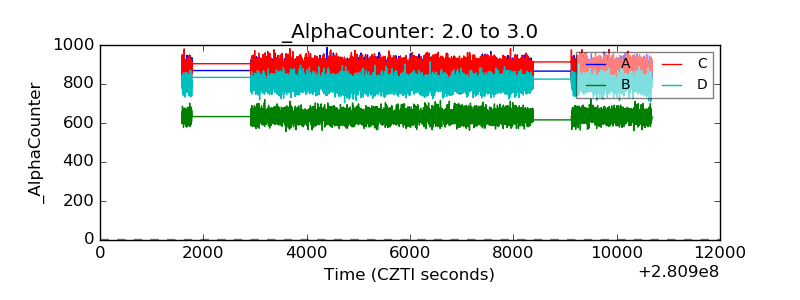 |
| _CPM_Rate | 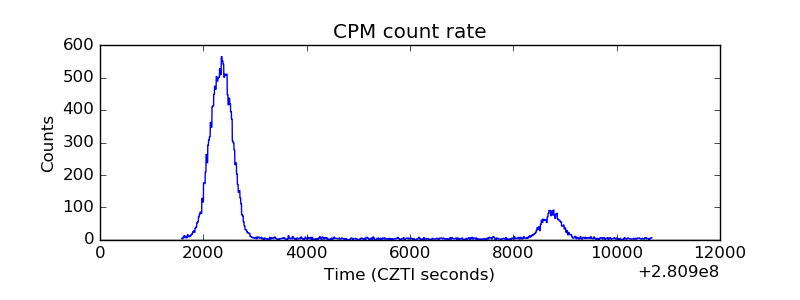 |
| CZT Counter |  |
| +2.5 Volts monitor | 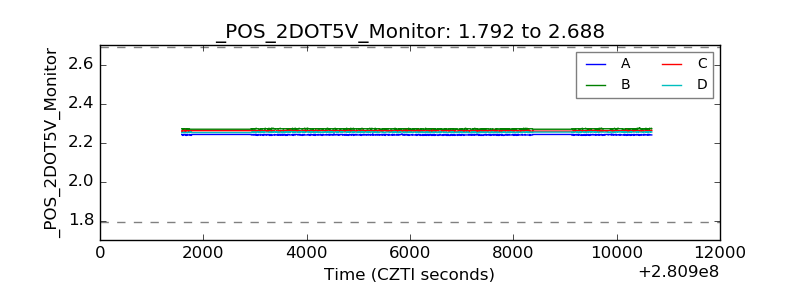 |
| +5 Volts monitor |  |
| _ROLL_ROT | 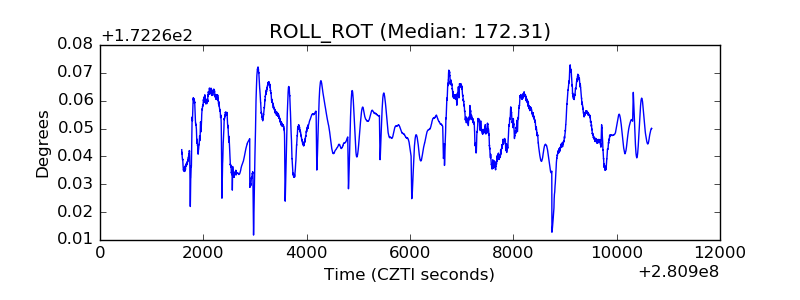 |
| _Roll_DEC | 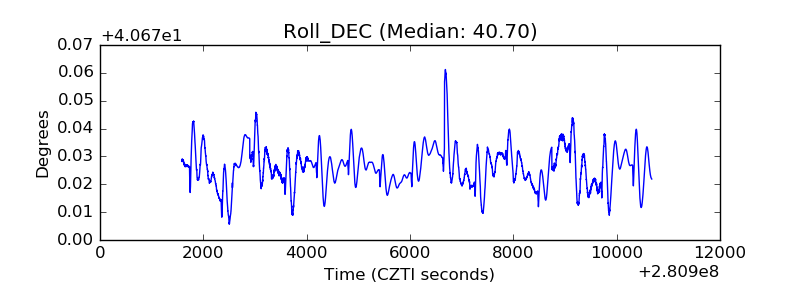 |
| _Roll_RA | 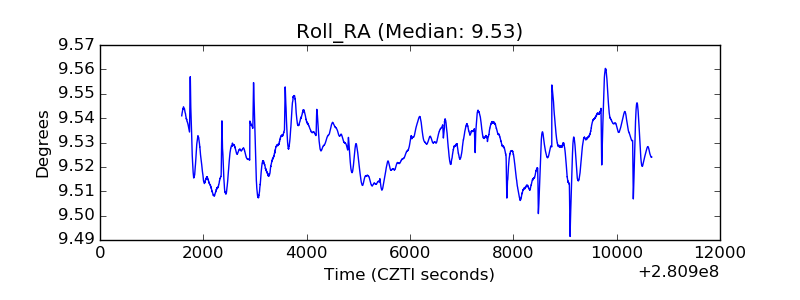 |
| Veto Counter | 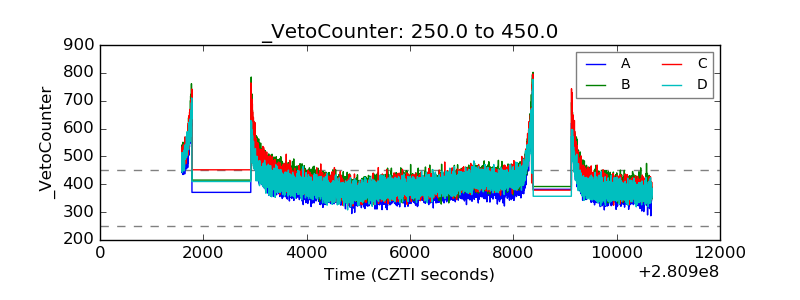 |