| Param | Original file | Final file |
|---|---|---|
| Filename | modeM0/AS1A05_004T06_9000002536_17099cztM0_level2.evt | modeM0/AS1A05_004T06_9000002536_17099cztM0_level2_quad_clean.evt |
| Size (bytes) | 526,826,880 | 87,750,720 |
| Size | 502.4 MB | 83.7 MB |
| Events in quadrant A | 3,708,839 | 536,173 |
| Events in quadrant B | 3,900,195 | 543,177 |
| Events in quadrant C | 3,885,147 | 518,037 |
| Events in quadrant D | 3,921,095 | 508,211 |
| Mode SS | |||
|---|---|---|---|
| Quadrant | BADHDUFLAG | Total packets | Discarded packets |
| A | 0 | 160 | 0 |
| B | 0 | 160 | 0 |
| C | 0 | 160 | 0 |
| D | 0 | 160 | 0 |
| Mode M0 | |||
|---|---|---|---|
| Quadrant | BADHDUFLAG | Total packets | Discarded packets |
| A | 0 | 16477 | 2 |
| B | 0 | 16774 | 2 |
| C | 0 | 16652 | 2 |
| D | 0 | 17369 | 2 |
| Mode M9 | |||
|---|---|---|---|
| Quadrant | BADHDUFLAG | Total packets | Discarded packets |
| A | 1 | 273359709408 | 0 |
| B | 1 | -1 | -1 |
| C | 1 | -1 | -1 |
| D | 1 | -1 | -1 |
| Quadrant | Total seconds | Saturated seconds | Saturation percentage |
|---|---|---|---|
| A | 7932 | 315 | 3.971256% |
| B | 7932 | 340 | 4.286435% |
| C | 7932 | 307 | 3.870398% |
| D | 7931 | 309 | 3.896104% |
Noise dominated data is calculated using 1-second bins in cleaned event files. If a bin has >2000 counts, and if more than 50% of those come from <1% of pixels, then it is considered to be noise-dominated and hence unusable.
| Quadrant | # 1 sec bins | Bins with >0 counts | Bins with >2000 counts | High rate bins dominated by noise | Noise dominated (total time) | Noise dominated (detector-on time) | Marked lightcurve |
|---|---|---|---|---|---|---|---|
| A | 7967 | 7933 | 0 | 0 | 0.00% | 0.00% |  |
| B | 7967 | 7933 | 9 | 9 | 0.11% | 0.11% |  |
| C | 7967 | 7933 | 4 | 4 | 0.05% | 0.05% |  |
| D | 7966 | 7932 | 94 | 94 | 1.18% | 1.19% |  |
Top three noisy pixels from each quadrant. If the there are fewer than three noisy pixels in the level2.evt file, extra rows are filled as -1
| Pixel properties | Quadrant properties | ||||||
|---|---|---|---|---|---|---|---|
| Quadrant | DetID | PixID | Counts | Sigma | Mean | Median | Sigma |
| A | 4 | 2 | 32245 | 161.5 | 956 | 931 | 193.9 |
| A | 0 | 226 | 8339 | 38.21 | 956 | 931 | 193.9 |
| A | 3 | 137 | 7148 | 32.06 | 956 | 931 | 193.9 |
| B | 0 | 189 | 47173 | 249.58 | 957 | 928 | 185.3 |
| B | 0 | 197 | 38922 | 205.05 | 957 | 928 | 185.3 |
| B | 0 | 246 | 30067 | 157.26 | 957 | 928 | 185.3 |
| C | 14 | 238 | 142916 | 659.13 | 918 | 920 | 215.4 |
| C | 5 | 112 | 66922 | 306.37 | 918 | 920 | 215.4 |
| C | 3 | 233 | 55409 | 252.93 | 918 | 920 | 215.4 |
| D | 10 | 70 | 258939 | 1134.06 | 927 | 899 | 227.5 |
| D | 5 | 222 | 116528 | 508.18 | 927 | 899 | 227.5 |
| D | 2 | 234 | 30080 | 128.25 | 927 | 899 | 227.5 |
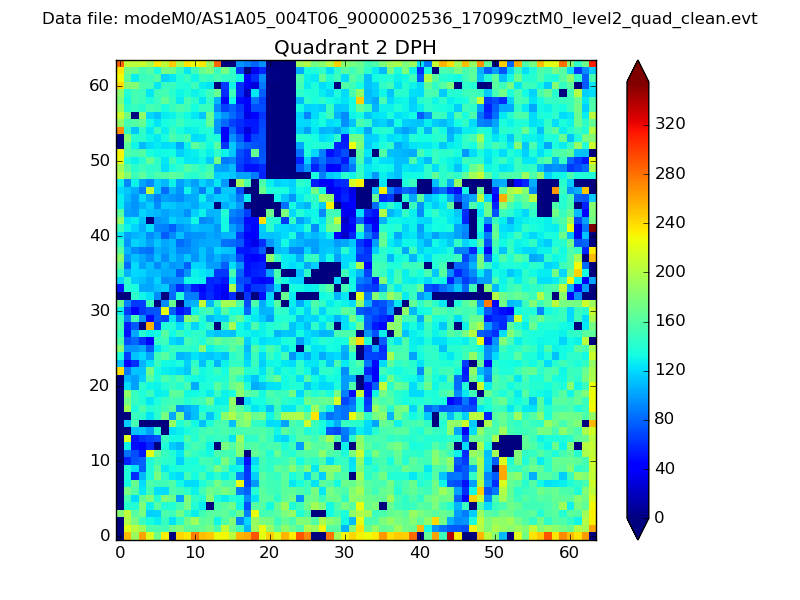
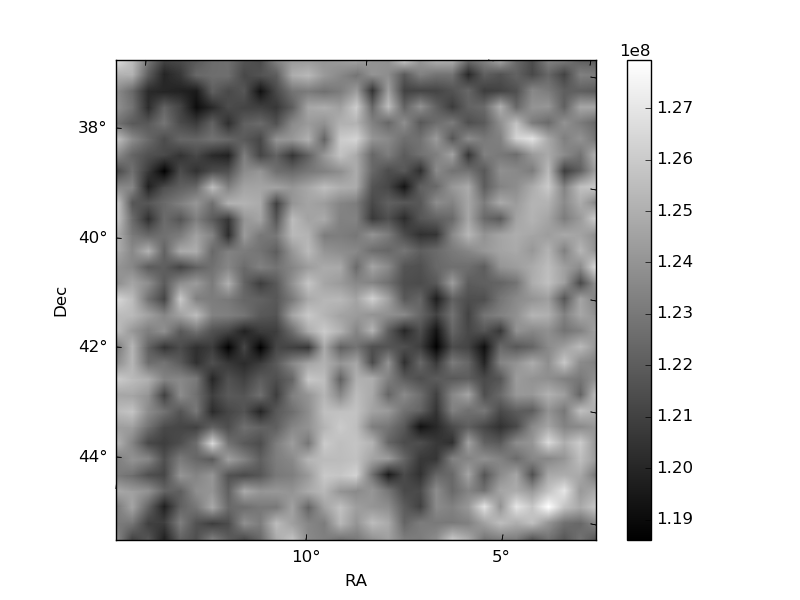
Histogram calculated using DETX and DETY for each event in the final _common_clean file
| Quadrant A | 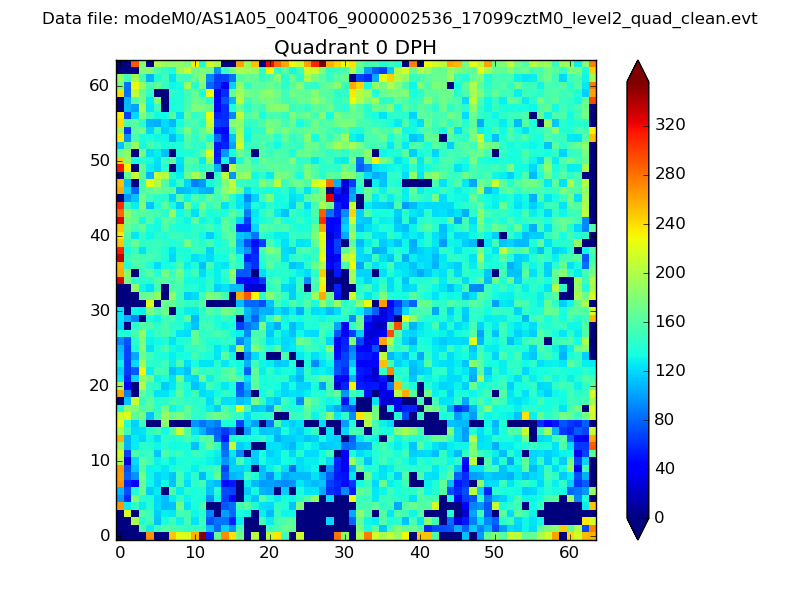 |
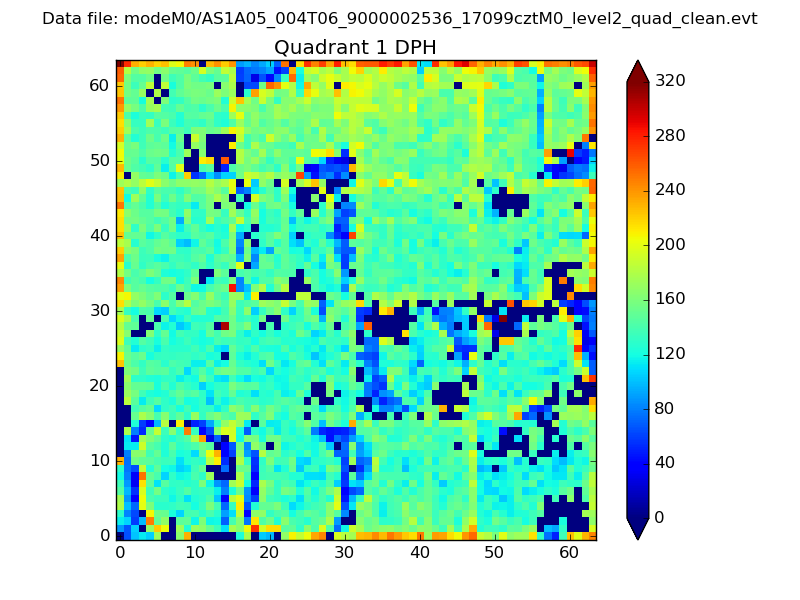 |
Quadrant B |
|---|---|---|---|
| Quadrant D | 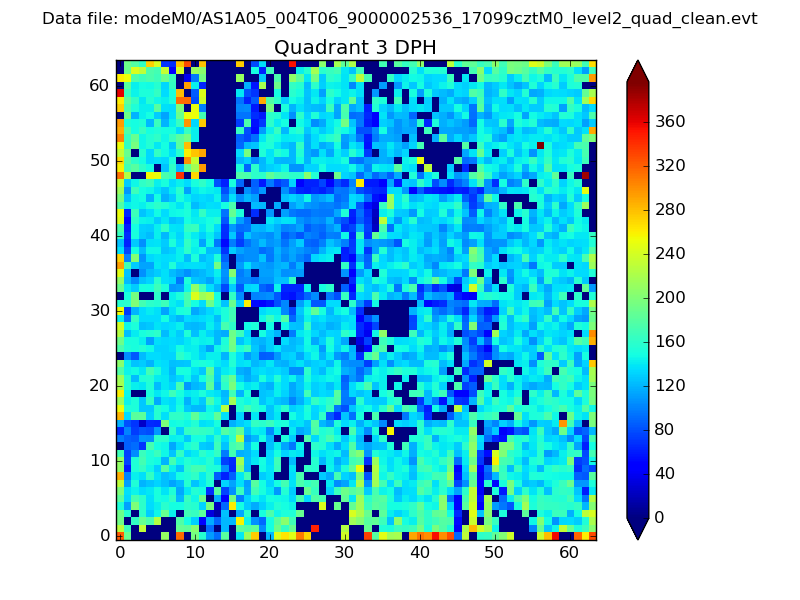 |
 |
Quadrant C |
| Plot type | Count rate plots | Images |
|---|---|---|
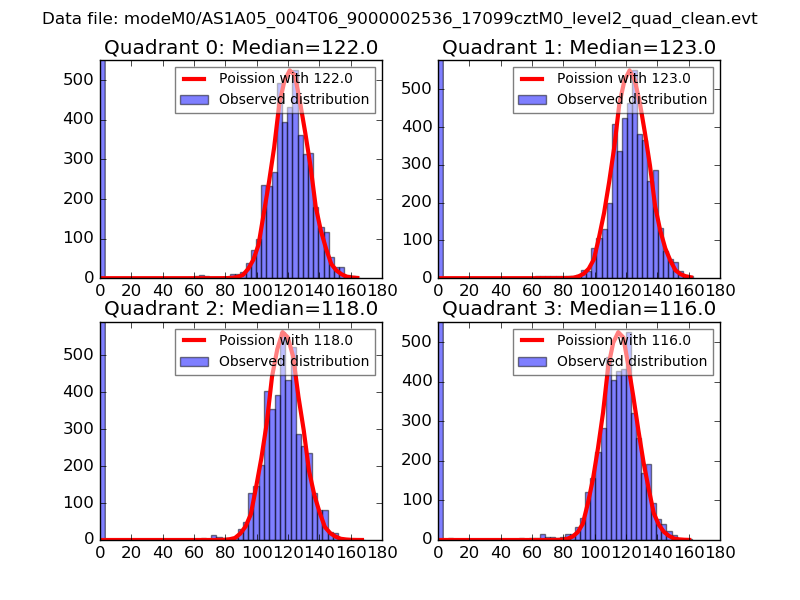
| Comparison with Poisson distribution Blue bars denote a histogram of data divided into 1 sec bins. Red curve is a Poisson curve with rate = median count rate of data. |
 |
 |
| Quadrant-wise count rates Data is divided into 100 sec bins |
 |
|
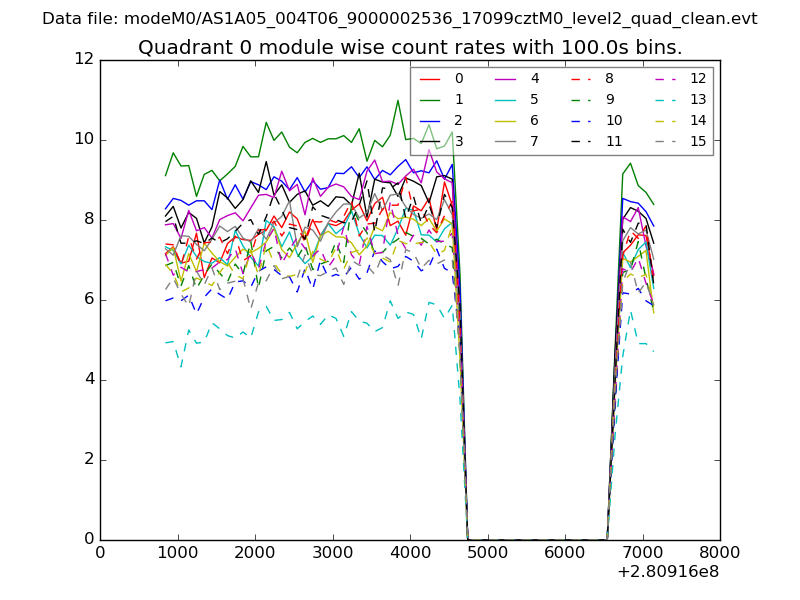
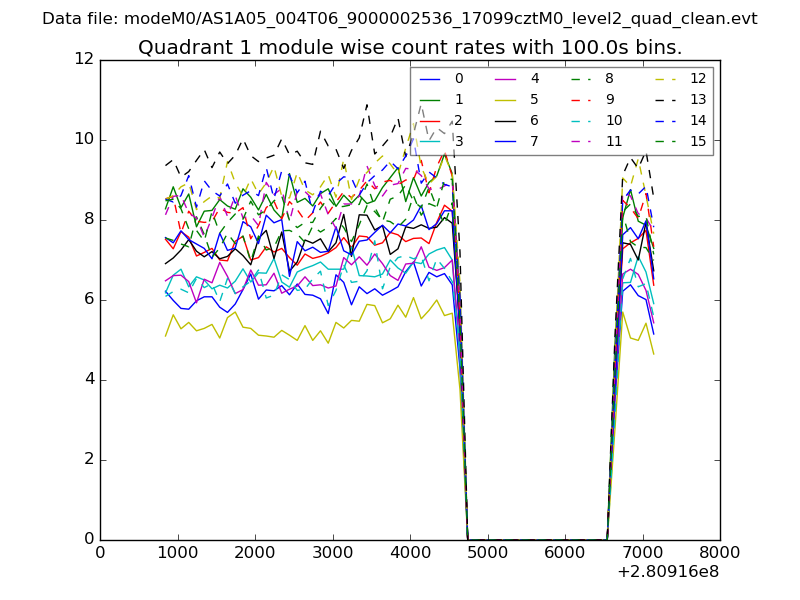
| Module-wise count rates for Quadrant A Data is divided into 100 sec bins |
 |
 |
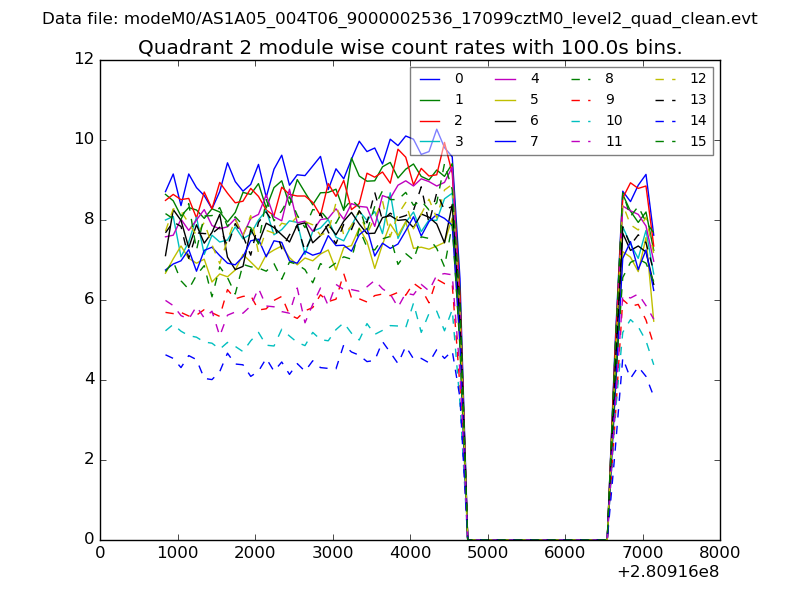
| Module-wise count rates for Quadrant B Data is divided into 100 sec bins |
 |
 |
| Module-wise count rates for Quadrant C Data is divided into 100 sec bins |
 |
 |
| Module-wise count rates for Quadrant D Data is divided into 100 sec bins |
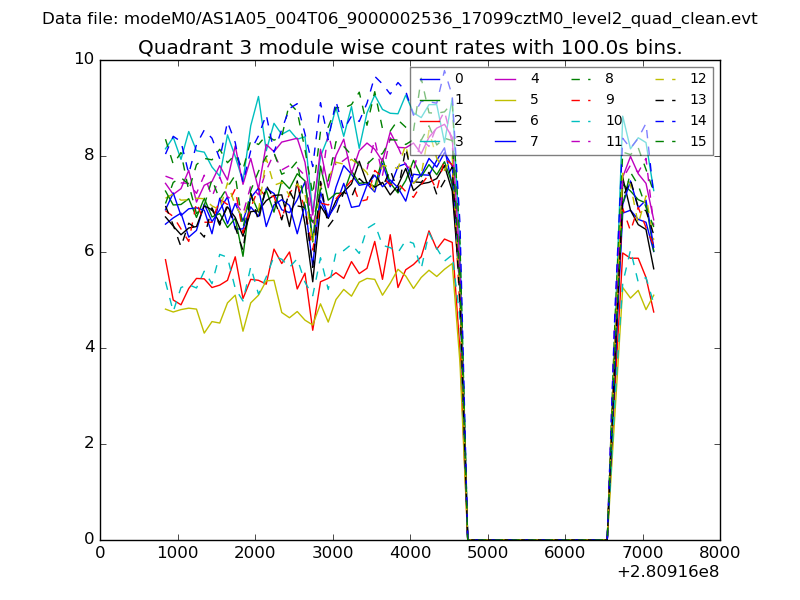 |
 |
| Parameter | Plot |
|---|---|
| CZT HV Monitor | 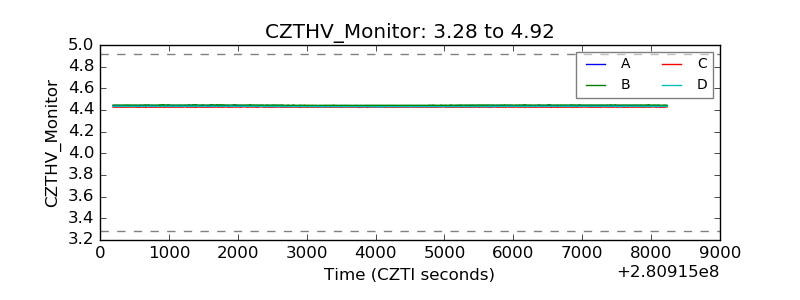 |
| D_VDD | 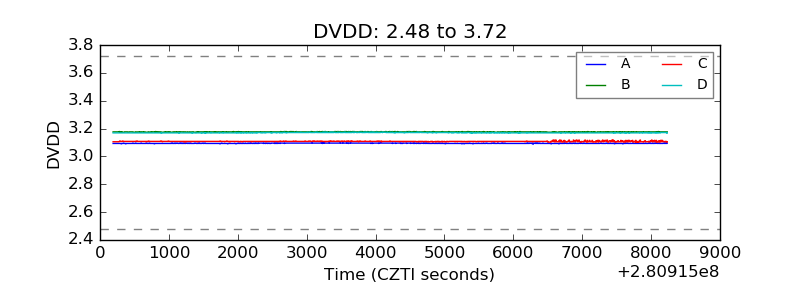 |
| Temperature 1 | 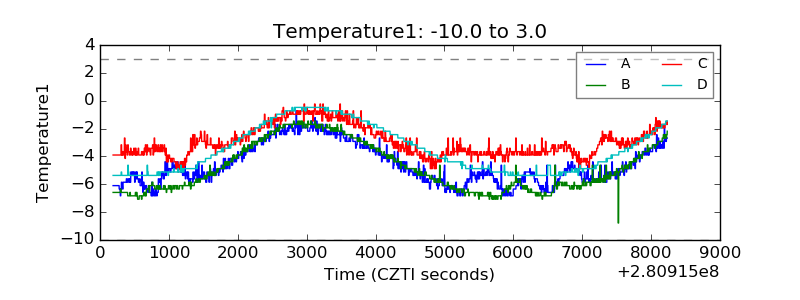 |
| Veto HV Monitor | 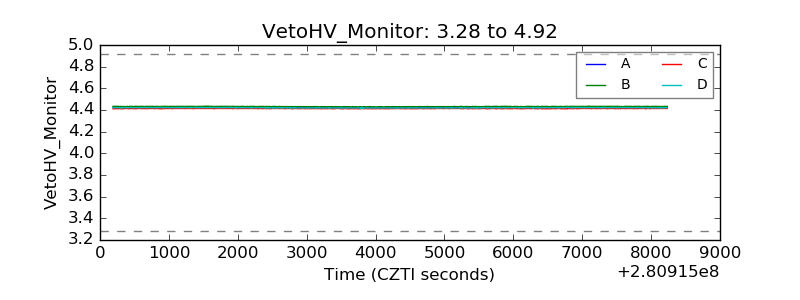 |
| Veto LLD | 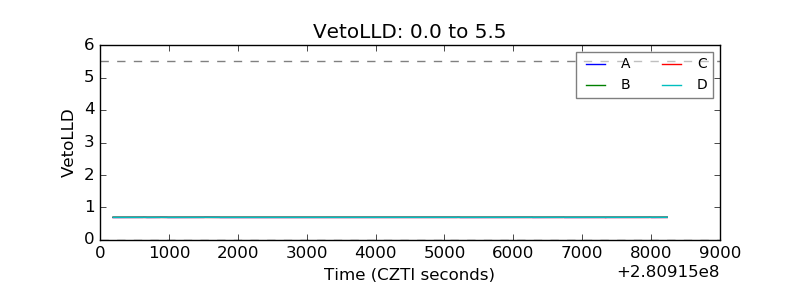 |
| Alpha Counter | 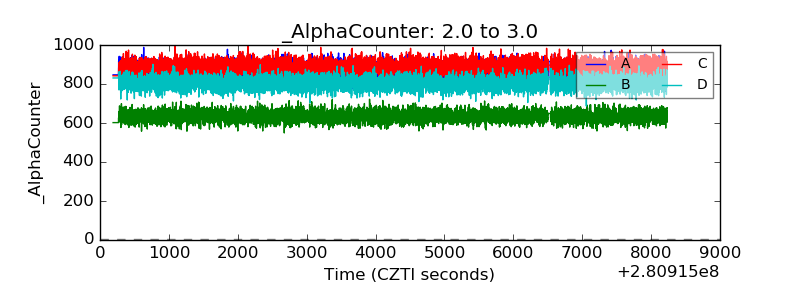 |
| _CPM_Rate |  |
| CZT Counter | 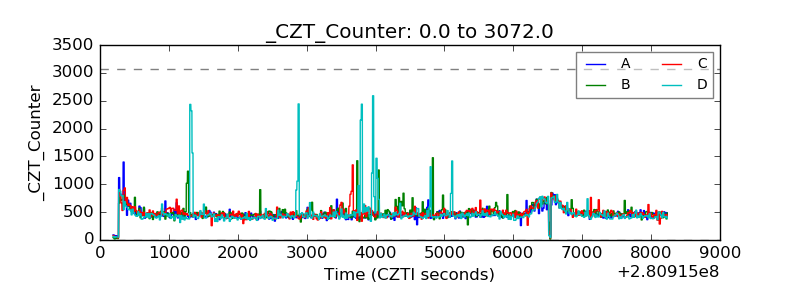 |
| +2.5 Volts monitor |  |
| +5 Volts monitor | 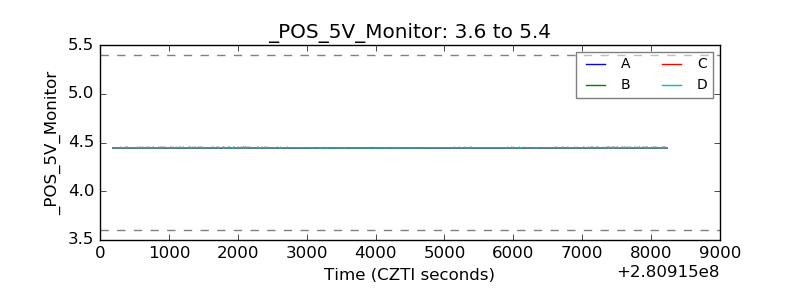 |
| _ROLL_ROT |  |
| _Roll_DEC | 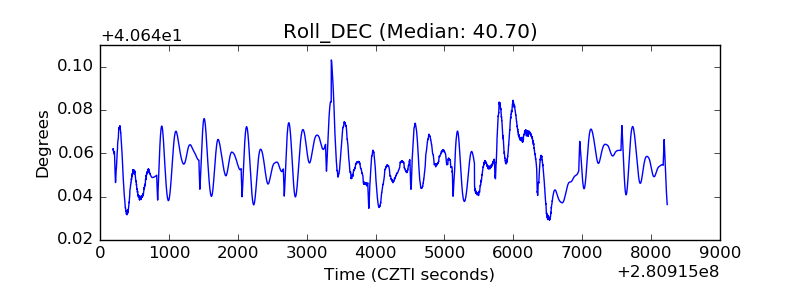 |
| _Roll_RA | 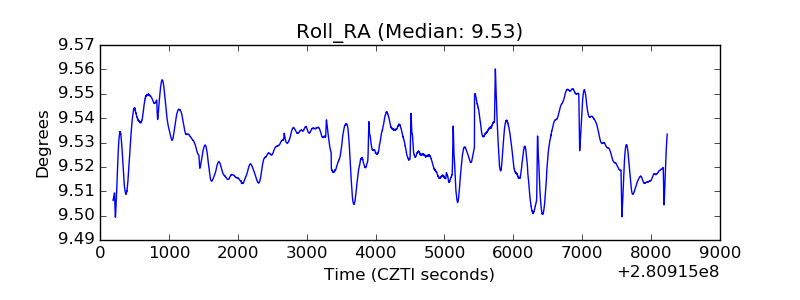 |
| Veto Counter | 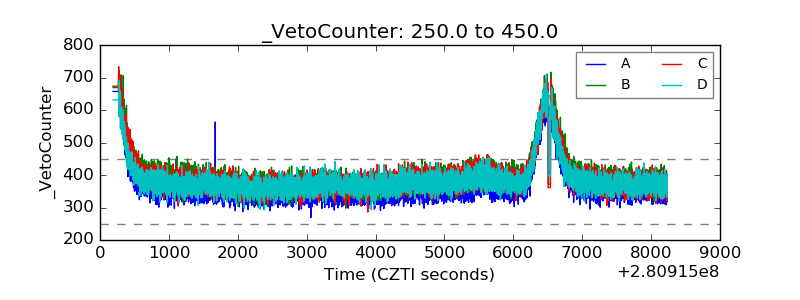 |