| Param | Original file | Final file |
|---|---|---|
| Filename | modeM0/AS1A05_004T06_9000002536_17100cztM0_level2.evt | modeM0/AS1A05_004T06_9000002536_17100cztM0_level2_quad_clean.evt |
| Size (bytes) | 532,549,440 | 95,083,200 |
| Size | 507.9 MB | 90.7 MB |
| Events in quadrant A | 3,741,663 | 592,645 |
| Events in quadrant B | 3,985,970 | 596,519 |
| Events in quadrant C | 4,001,519 | 573,884 |
| Events in quadrant D | 3,857,592 | 562,690 |
| Mode SS | |||
|---|---|---|---|
| Quadrant | BADHDUFLAG | Total packets | Discarded packets |
| A | 0 | 162 | 0 |
| B | 0 | 162 | 0 |
| C | 0 | 162 | 0 |
| D | 0 | 162 | 0 |
| Mode M0 | |||
|---|---|---|---|
| Quadrant | BADHDUFLAG | Total packets | Discarded packets |
| A | 0 | 16579 | 2 |
| B | 0 | 16994 | 2 |
| C | 0 | 16958 | 2 |
| D | 0 | 17147 | 2 |
| Mode M9 | |||
|---|---|---|---|
| Quadrant | BADHDUFLAG | Total packets | Discarded packets |
| A | 0 | 3 | 0 |
| B | 0 | 3 | 0 |
| C | 0 | 3 | 0 |
| D | 0 | 3 | 0 |
| Quadrant | Total seconds | Saturated seconds | Saturation percentage |
|---|---|---|---|
| A | 7962 | 352 | 4.421000% |
| B | 7963 | 378 | 4.746955% |
| C | 7963 | 340 | 4.269748% |
| D | 7963 | 312 | 3.918121% |
Noise dominated data is calculated using 1-second bins in cleaned event files. If a bin has >2000 counts, and if more than 50% of those come from <1% of pixels, then it is considered to be noise-dominated and hence unusable.
| Quadrant | # 1 sec bins | Bins with >0 counts | Bins with >2000 counts | High rate bins dominated by noise | Noise dominated (total time) | Noise dominated (detector-on time) | Marked lightcurve |
|---|---|---|---|---|---|---|---|
| A | 8292 | 7964 | 1 | 1 | 0.01% | 0.01% | 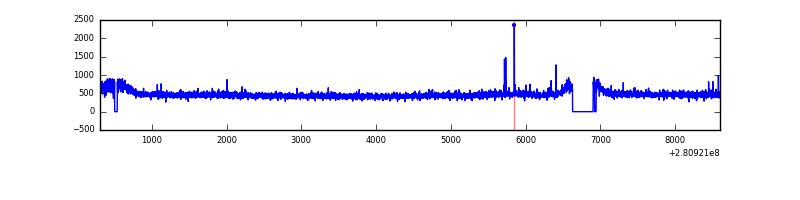 |
| B | 8293 | 7965 | 10 | 10 | 0.12% | 0.13% | 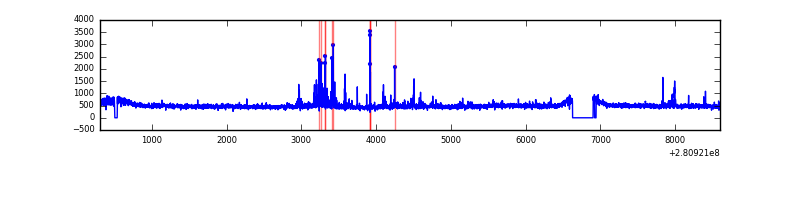 |
| C | 8293 | 7966 | 0 | 0 | 0.00% | 0.00% | 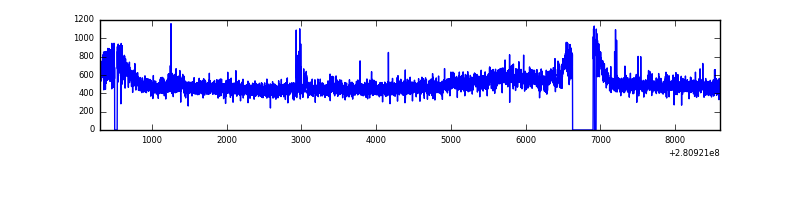 |
| D | 8293 | 7966 | 35 | 35 | 0.42% | 0.44% | 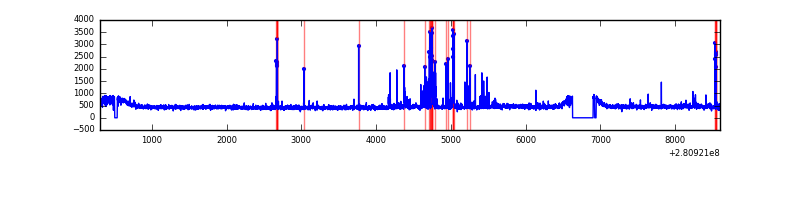 |
Top three noisy pixels from each quadrant. If the there are fewer than three noisy pixels in the level2.evt file, extra rows are filled as -1
| Pixel properties | Quadrant properties | ||||||
|---|---|---|---|---|---|---|---|
| Quadrant | DetID | PixID | Counts | Sigma | Mean | Median | Sigma |
| A | 4 | 2 | 26364 | 129.45 | 966 | 941 | 196.4 |
| A | 0 | 226 | 8442 | 38.19 | 966 | 941 | 196.4 |
| A | 3 | 137 | 7193 | 31.83 | 966 | 941 | 196.4 |
| B | 7 | 220 | 81025 | 430.21 | 962 | 935 | 186.2 |
| B | 0 | 246 | 28571 | 148.45 | 962 | 935 | 186.2 |
| B | 0 | 189 | 26290 | 136.2 | 962 | 935 | 186.2 |
| C | 3 | 233 | 203773 | 931.19 | 925 | 927 | 217.8 |
| C | 14 | 238 | 142676 | 650.72 | 925 | 927 | 217.8 |
| C | 5 | 112 | 15727 | 67.94 | 925 | 927 | 217.8 |
| D | 10 | 70 | 148036 | 641.37 | 941 | 913 | 229.4 |
| D | 5 | 222 | 47661 | 203.8 | 941 | 913 | 229.4 |
| D | 2 | 234 | 31654 | 134.01 | 941 | 913 | 229.4 |
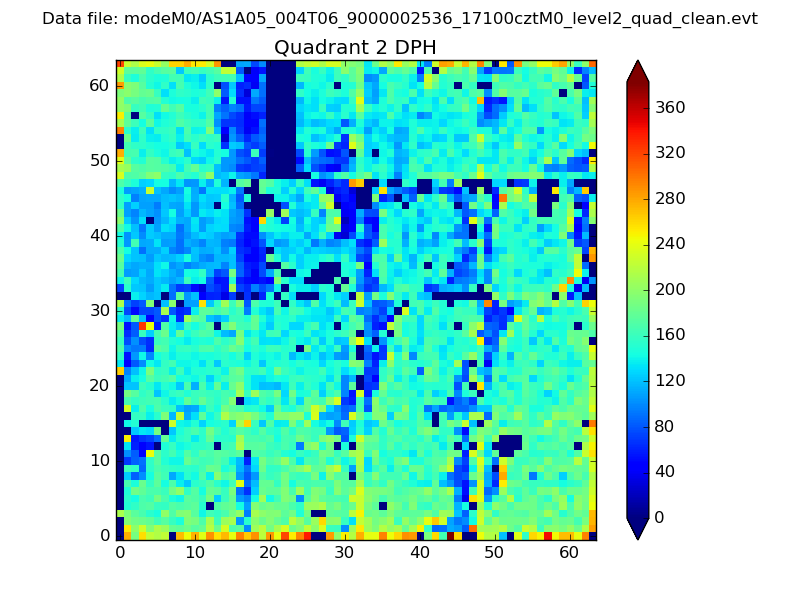
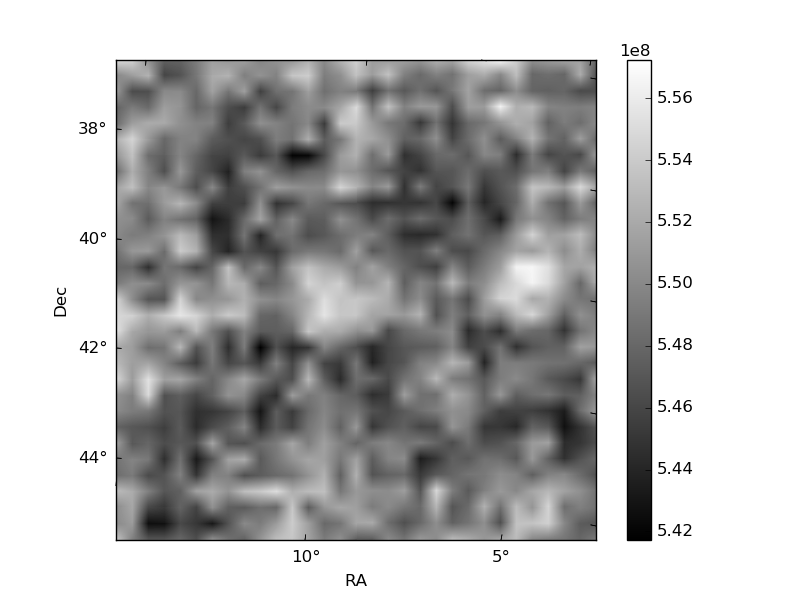
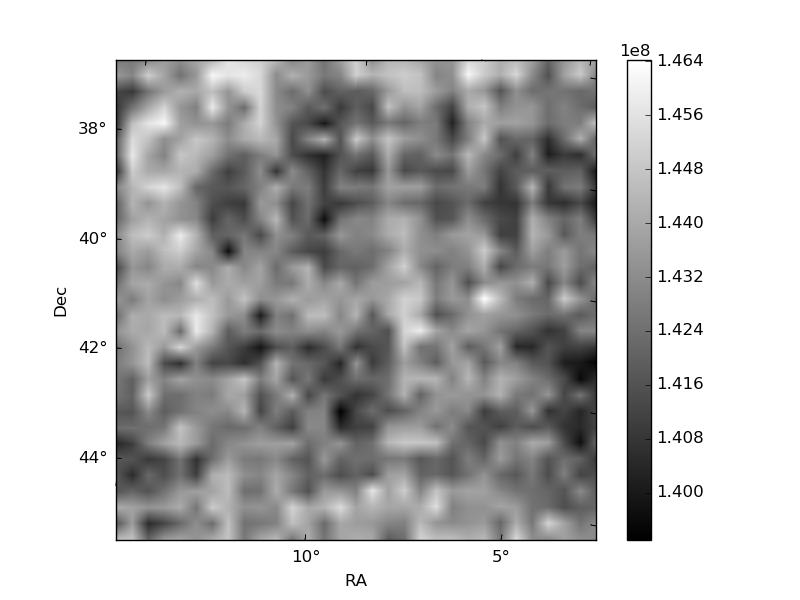
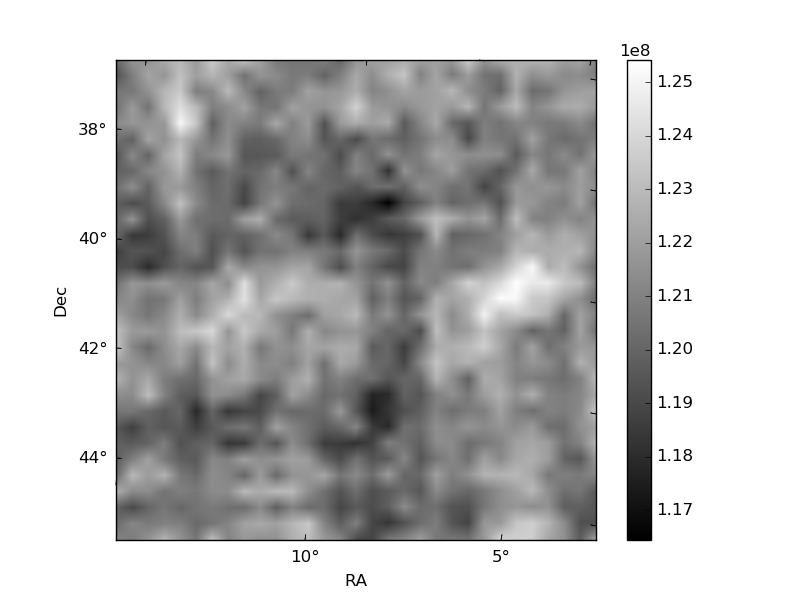
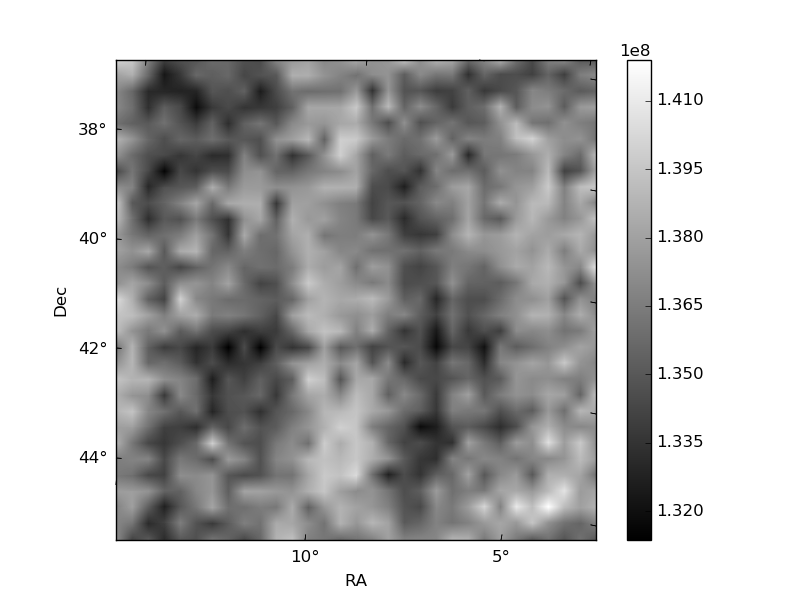
Histogram calculated using DETX and DETY for each event in the final _common_clean file
| Quadrant A | 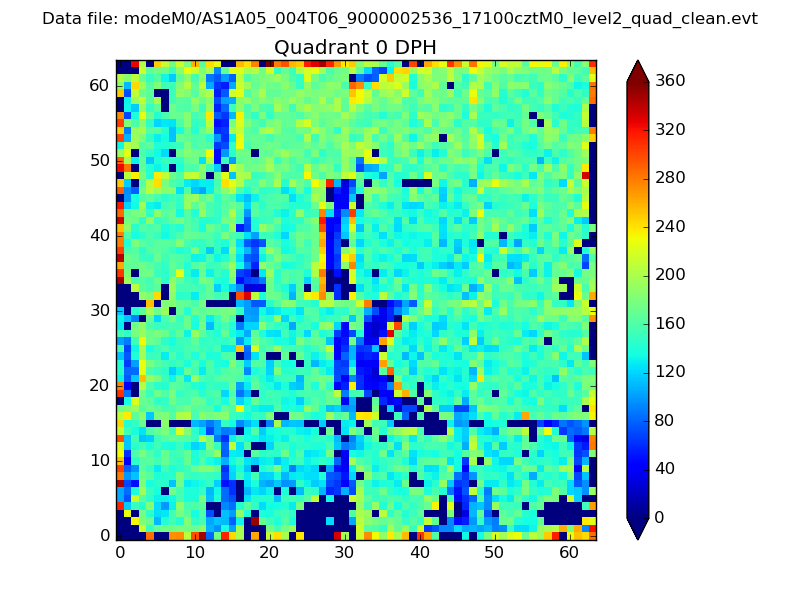 |
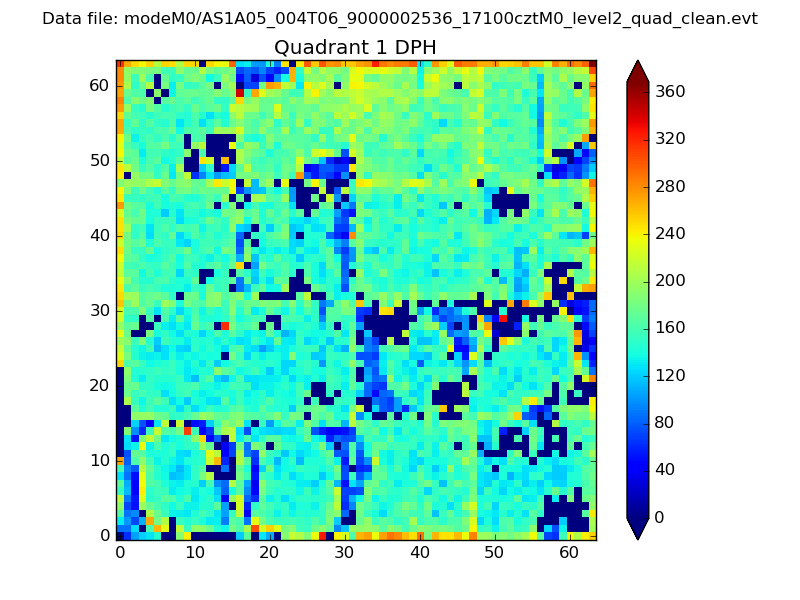 |
Quadrant B |
|---|---|---|---|
| Quadrant D | 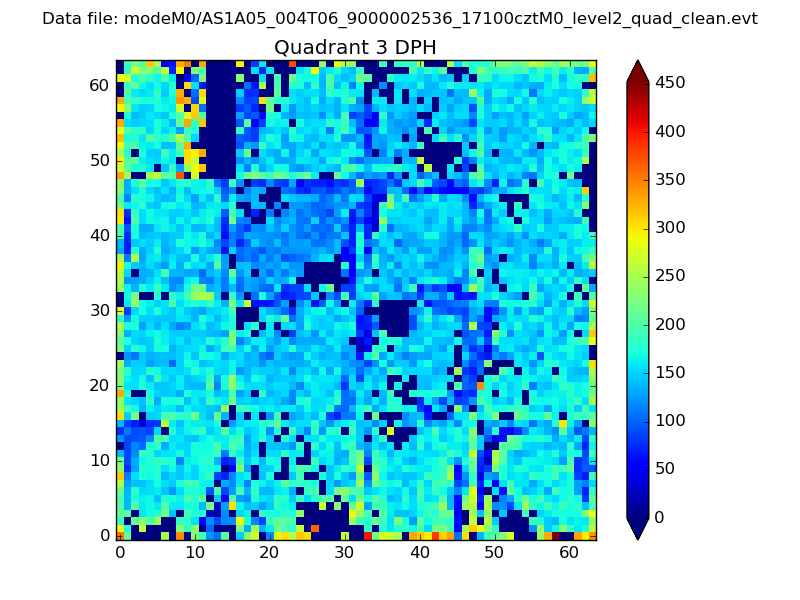 |
 |
Quadrant C |
| Plot type | Count rate plots | Images |
|---|---|---|
| Comparison with Poisson distribution Blue bars denote a histogram of data divided into 1 sec bins. Red curve is a Poisson curve with rate = median count rate of data. |
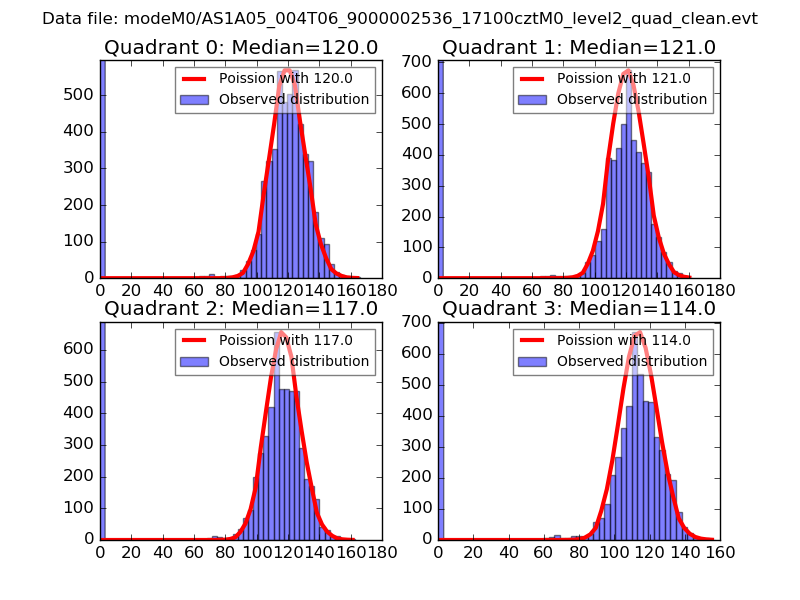 |
 |
| Quadrant-wise count rates Data is divided into 100 sec bins |
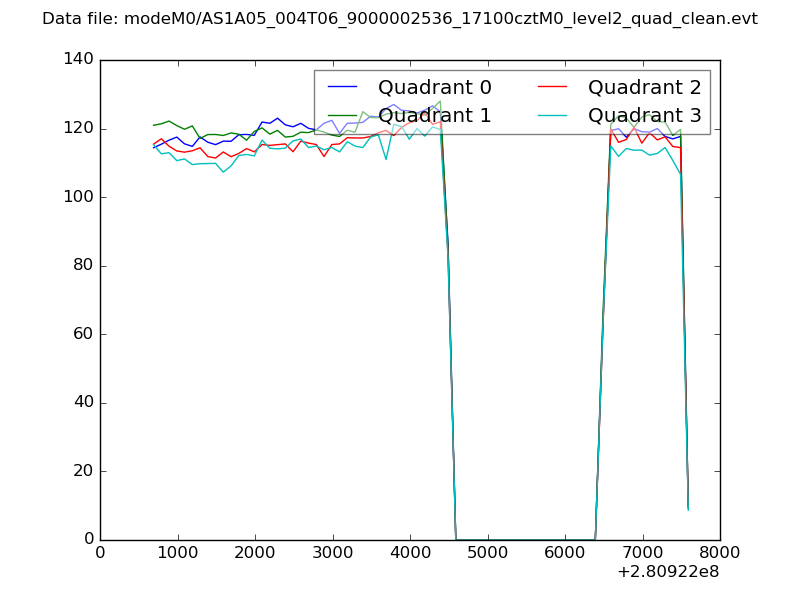 |
|
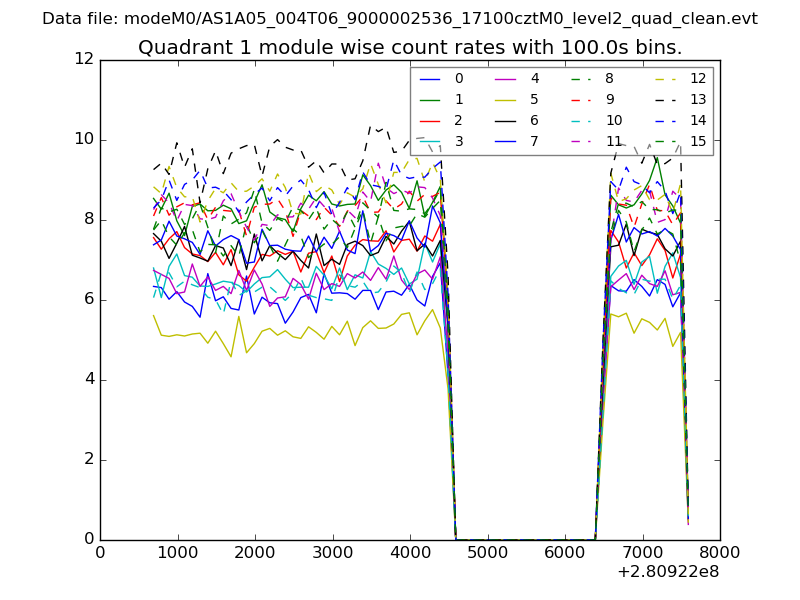
| Module-wise count rates for Quadrant A Data is divided into 100 sec bins |
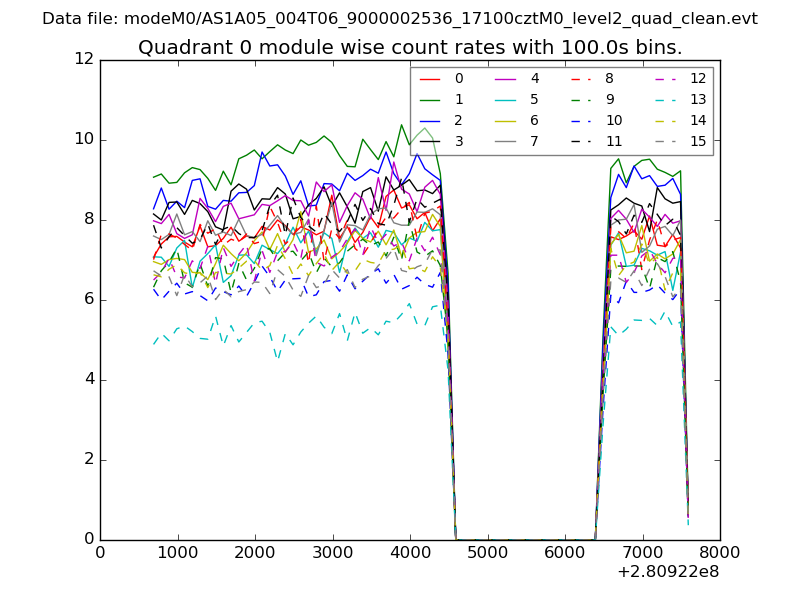 |
 |
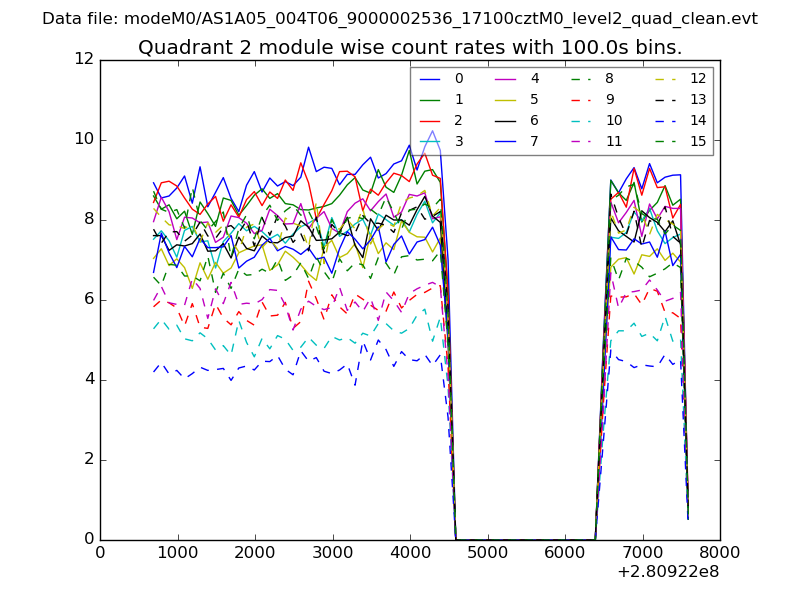
| Module-wise count rates for Quadrant B Data is divided into 100 sec bins |
 |
 |
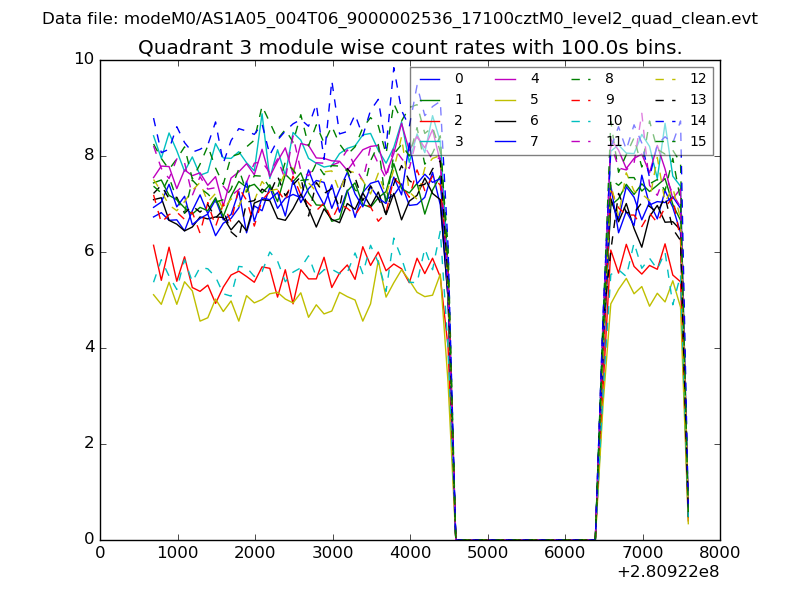
| Module-wise count rates for Quadrant C Data is divided into 100 sec bins |
 |
 |
| Module-wise count rates for Quadrant D Data is divided into 100 sec bins |
 |
 |
| Parameter | Plot |
|---|---|
| CZT HV Monitor | 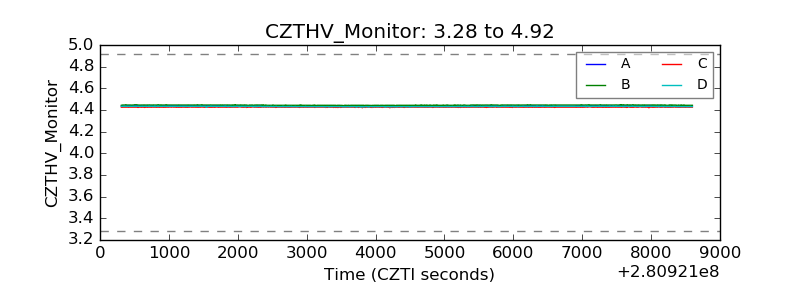 |
| D_VDD | 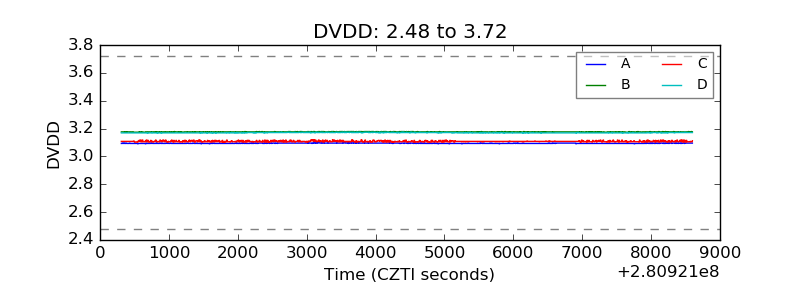 |
| Temperature 1 | 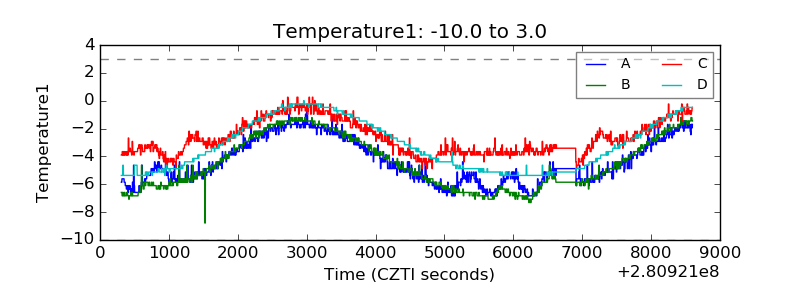 |
| Veto HV Monitor | 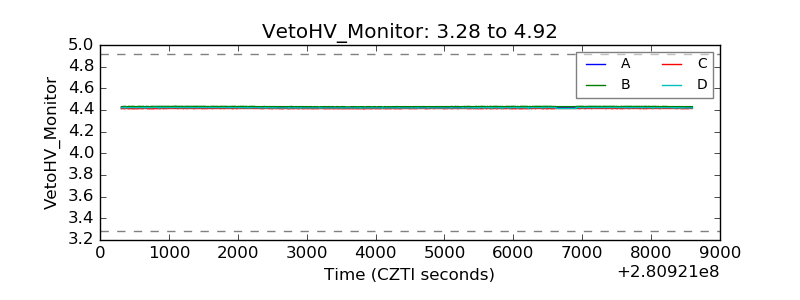 |
| Veto LLD | 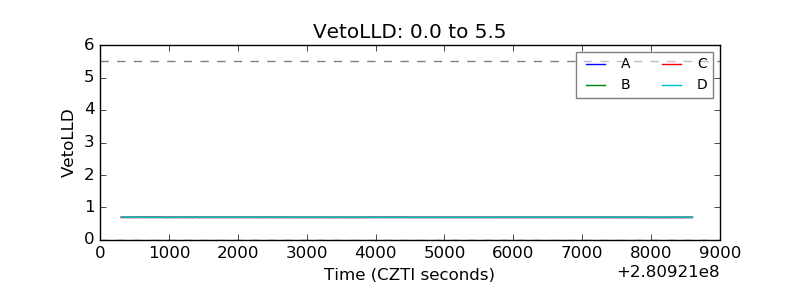 |
| Alpha Counter | 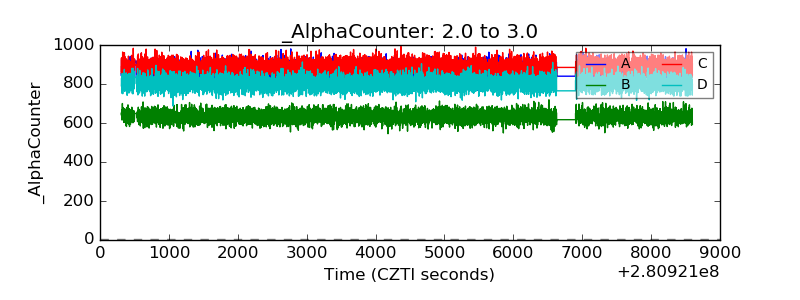 |
| _CPM_Rate | 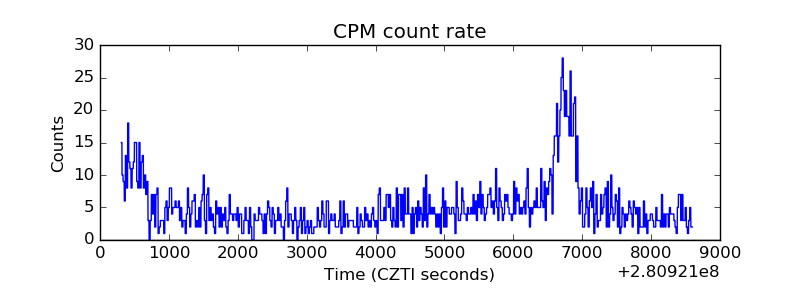 |
| CZT Counter | 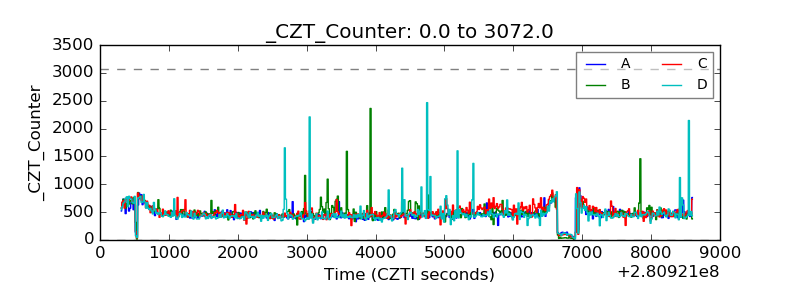 |
| +2.5 Volts monitor |  |
| +5 Volts monitor |  |
| _ROLL_ROT | 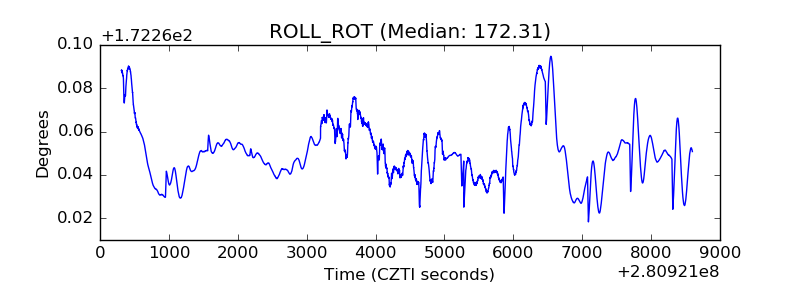 |
| _Roll_DEC | 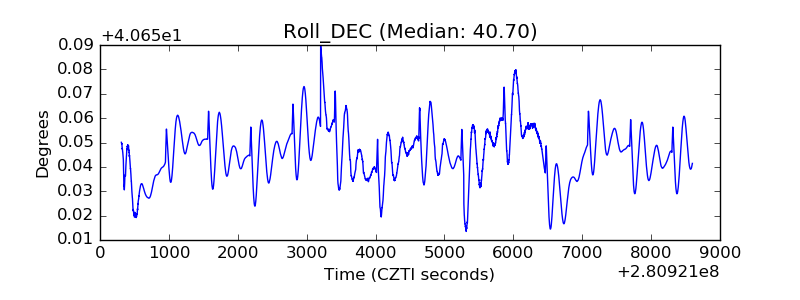 |
| _Roll_RA | 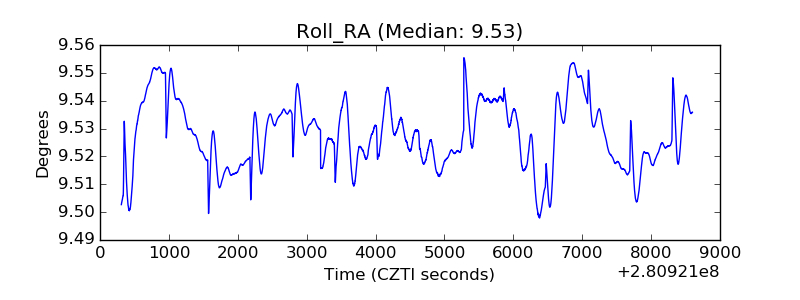 |
| Veto Counter | 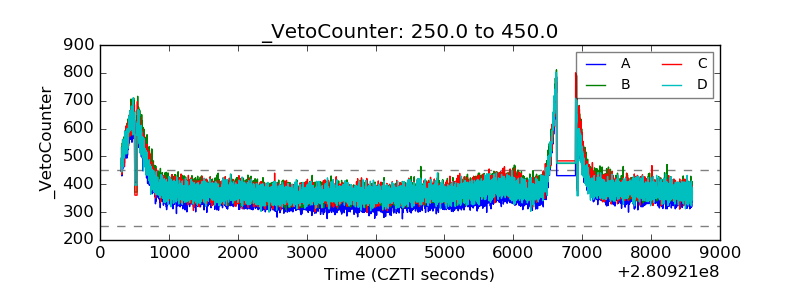 |