| Param | Original file | Final file |
|---|---|---|
| Filename | modeM0/AS1A05_004T06_9000002536_17102cztM0_level2.evt | modeM0/AS1A05_004T06_9000002536_17102cztM0_level2_quad_clean.evt |
| Size (bytes) | 874,200,960 | 174,712,320 |
| Size | 833.7 MB | 166.6 MB |
| Events in quadrant A | 5,943,054 | 1,123,492 |
| Events in quadrant B | 6,523,775 | 1,127,778 |
| Events in quadrant C | 6,232,158 | 1,082,260 |
| Events in quadrant D | 6,898,759 | 1,062,721 |
| Mode SS | |||
|---|---|---|---|
| Quadrant | BADHDUFLAG | Total packets | Discarded packets |
| A | 0 | 262 | 0 |
| B | 0 | 262 | 0 |
| C | 0 | 262 | 0 |
| D | 0 | 262 | 0 |
| Mode M0 | |||
|---|---|---|---|
| Quadrant | BADHDUFLAG | Total packets | Discarded packets |
| A | 0 | 26462 | 2 |
| B | 0 | 27657 | 2 |
| C | 0 | 26655 | 2 |
| D | 0 | 29504 | 2 |
| Mode M9 | |||
|---|---|---|---|
| Quadrant | BADHDUFLAG | Total packets | Discarded packets |
| A | 0 | 13 | 0 |
| B | 0 | 13 | 0 |
| C | 0 | 13 | 0 |
| D | 0 | 14 | 0 |
| Quadrant | Total seconds | Saturated seconds | Saturation percentage |
|---|---|---|---|
| A | 12961 | 130 | 1.003009% |
| B | 12961 | 159 | 1.226757% |
| C | 12961 | 154 | 1.188180% |
| D | 12961 | 232 | 1.789985% |
Noise dominated data is calculated using 1-second bins in cleaned event files. If a bin has >2000 counts, and if more than 50% of those come from <1% of pixels, then it is considered to be noise-dominated and hence unusable.
| Quadrant | # 1 sec bins | Bins with >0 counts | Bins with >2000 counts | High rate bins dominated by noise | Noise dominated (total time) | Noise dominated (detector-on time) | Marked lightcurve |
|---|---|---|---|---|---|---|---|
| A | 14221 | 12963 | 1 | 1 | 0.01% | 0.01% | 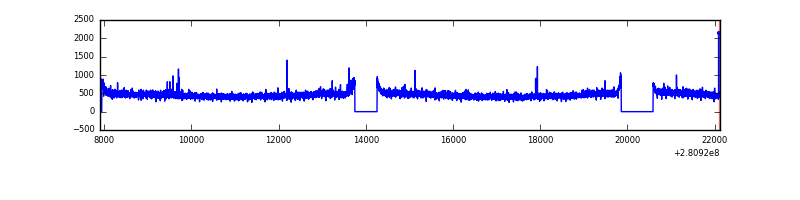 |
| B | 14221 | 12964 | 11 | 11 | 0.08% | 0.08% | 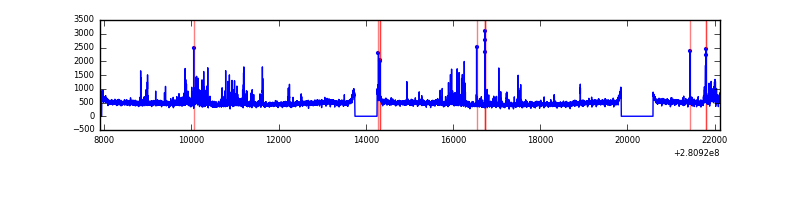 |
| C | 14221 | 12964 | 0 | 0 | 0.00% | 0.00% | 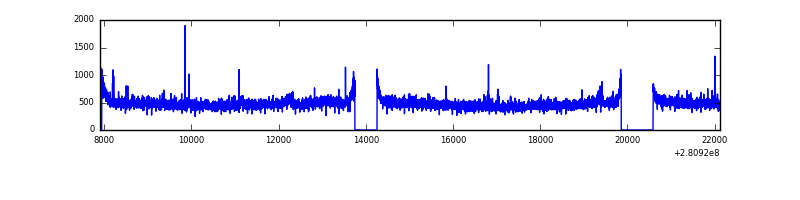 |
| D | 14221 | 12963 | 88 | 88 | 0.62% | 0.68% | 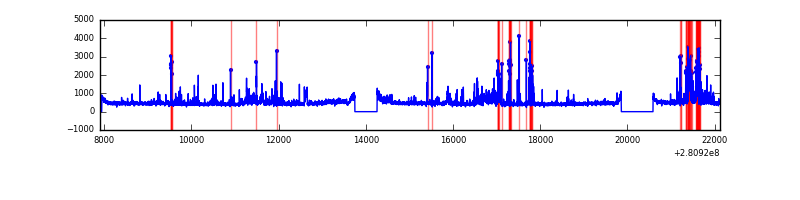 |
Top three noisy pixels from each quadrant. If the there are fewer than three noisy pixels in the level2.evt file, extra rows are filled as -1
| Pixel properties | Quadrant properties | ||||||
|---|---|---|---|---|---|---|---|
| Quadrant | DetID | PixID | Counts | Sigma | Mean | Median | Sigma |
| A | 4 | 2 | 30015 | 91.49 | 1536 | 1499 | 311.7 |
| A | 0 | 226 | 13589 | 38.79 | 1536 | 1499 | 311.7 |
| A | 12 | 194 | 11351 | 31.61 | 1536 | 1499 | 311.7 |
| B | 7 | 220 | 183986 | 618.64 | 1528 | 1485 | 295.0 |
| B | 4 | 216 | 89849 | 299.54 | 1528 | 1485 | 295.0 |
| B | 15 | 32 | 63243 | 209.35 | 1528 | 1485 | 295.0 |
| C | 14 | 238 | 224911 | 645.78 | 1473 | 1480 | 346.0 |
| C | 3 | 233 | 176421 | 505.63 | 1473 | 1480 | 346.0 |
| C | 7 | 247 | 28680 | 78.62 | 1473 | 1480 | 346.0 |
| D | 5 | 222 | 326552 | 900.86 | 1490 | 1445 | 360.9 |
| D | 1 | 52 | 303020 | 835.66 | 1490 | 1445 | 360.9 |
| D | 10 | 70 | 229894 | 633.03 | 1490 | 1445 | 360.9 |
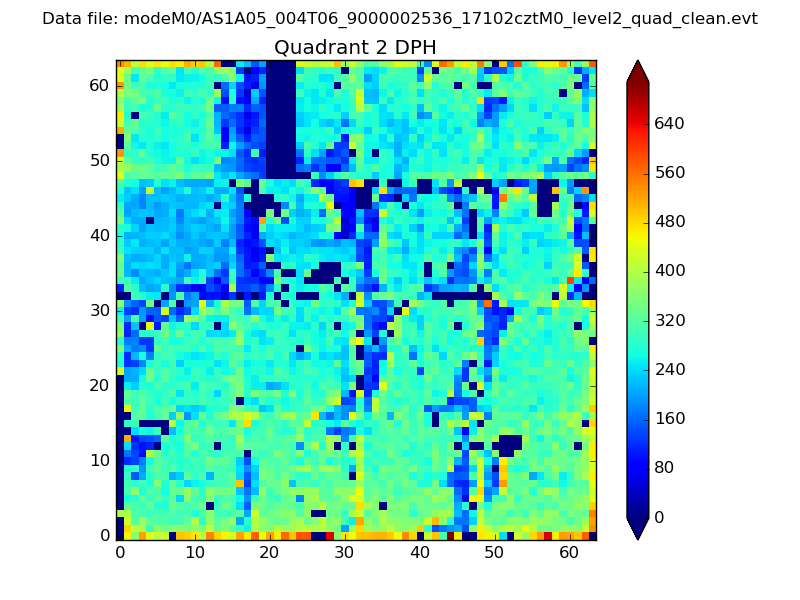
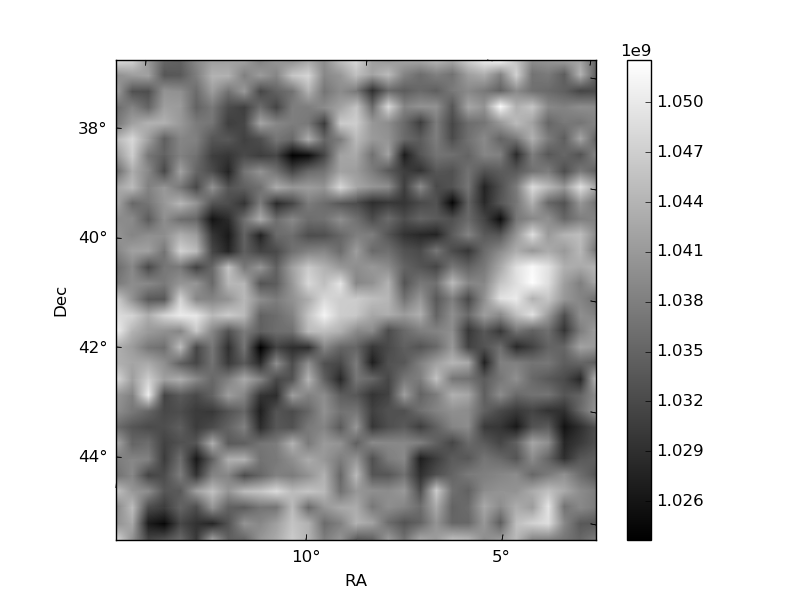
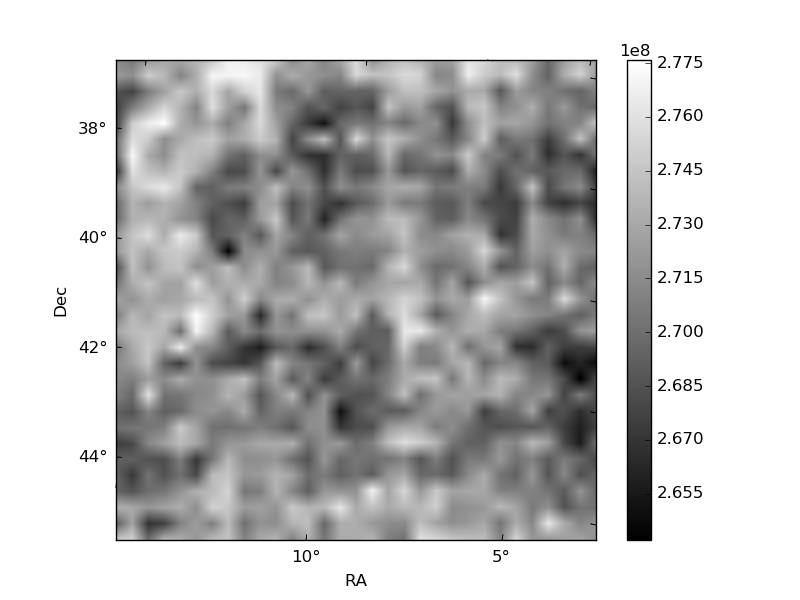
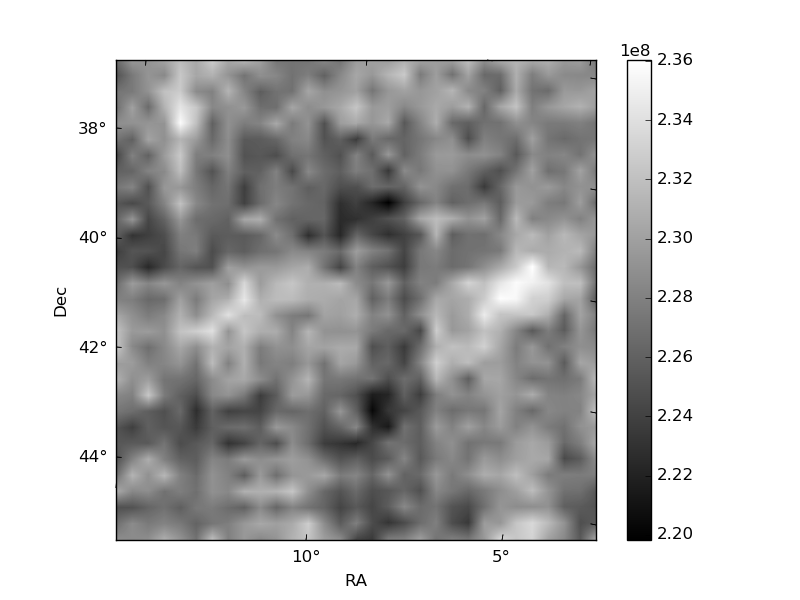
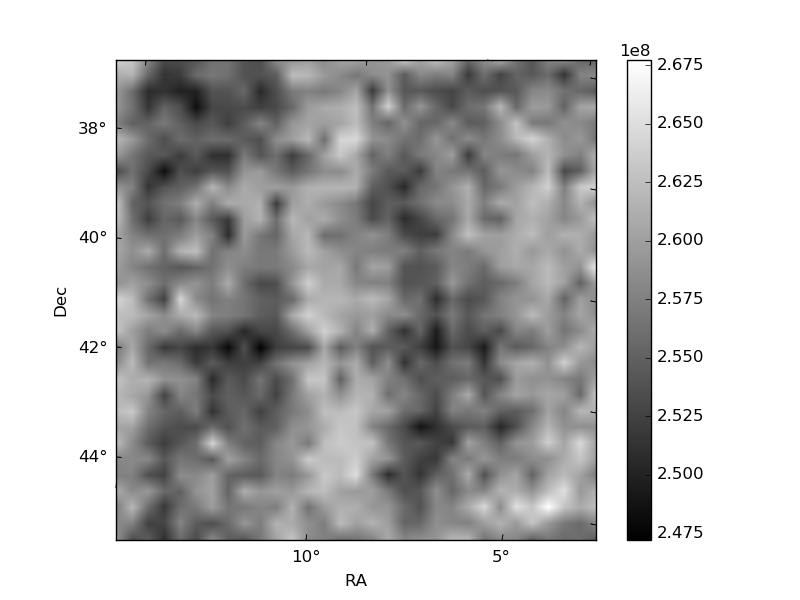
Histogram calculated using DETX and DETY for each event in the final _common_clean file
| Quadrant A | 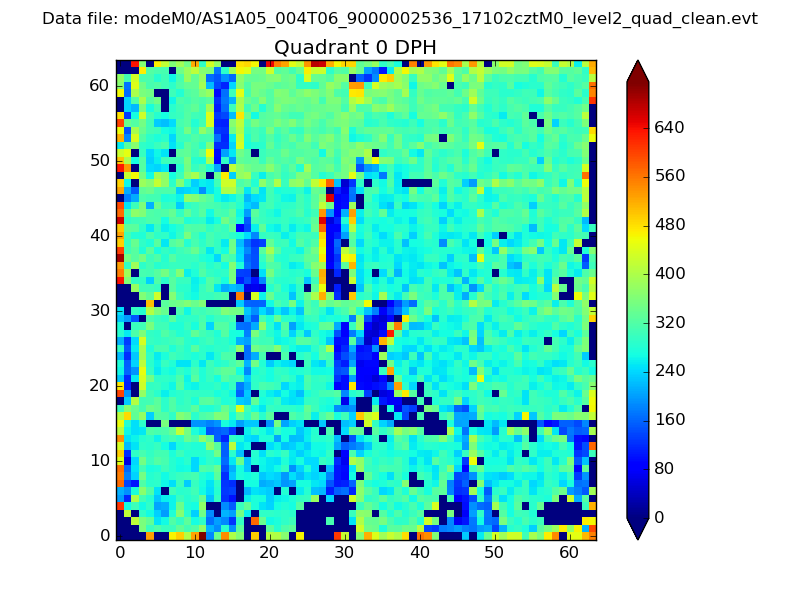 |
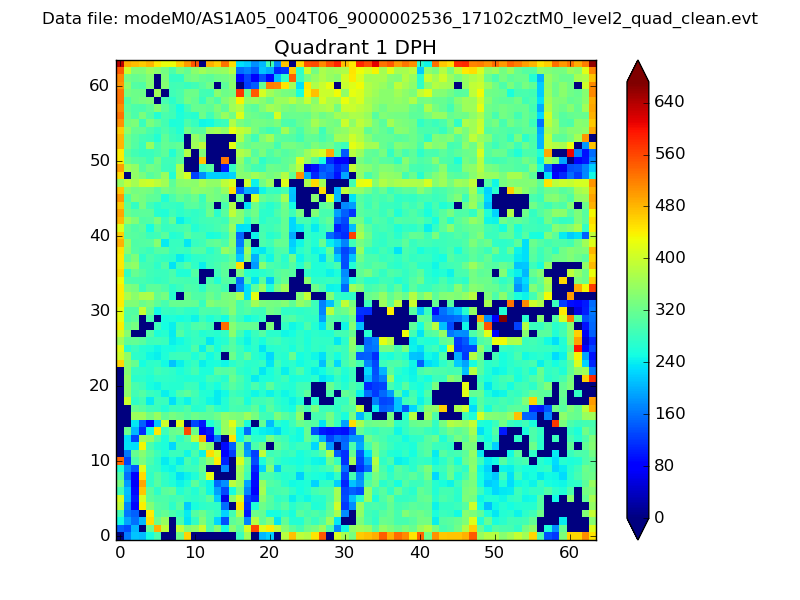 |
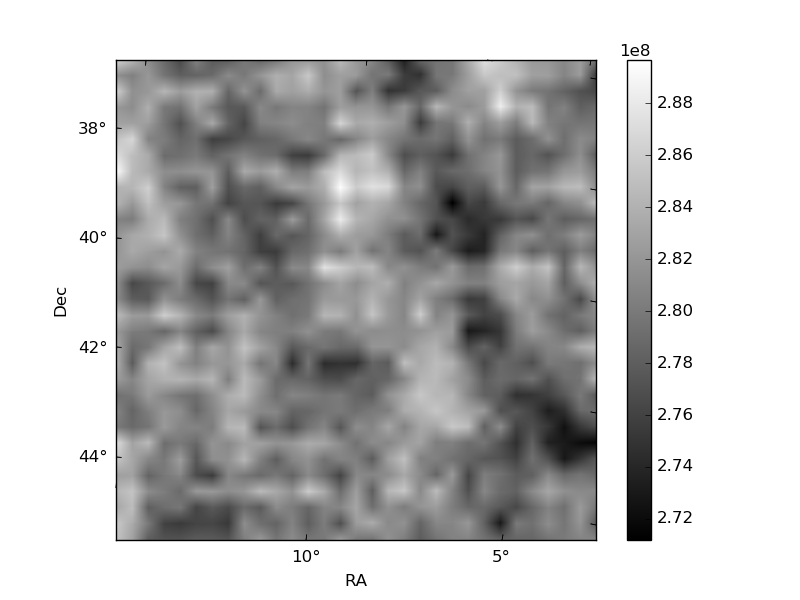
Quadrant B |
|---|---|---|---|
| Quadrant D | 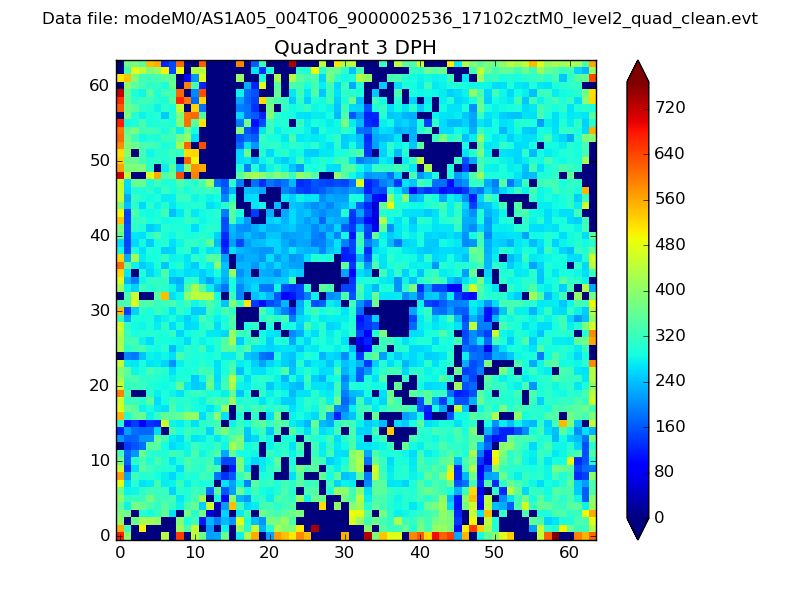 |
 |
Quadrant C |
| Plot type | Count rate plots | Images |
|---|---|---|
| Comparison with Poisson distribution Blue bars denote a histogram of data divided into 1 sec bins. Red curve is a Poisson curve with rate = median count rate of data. |
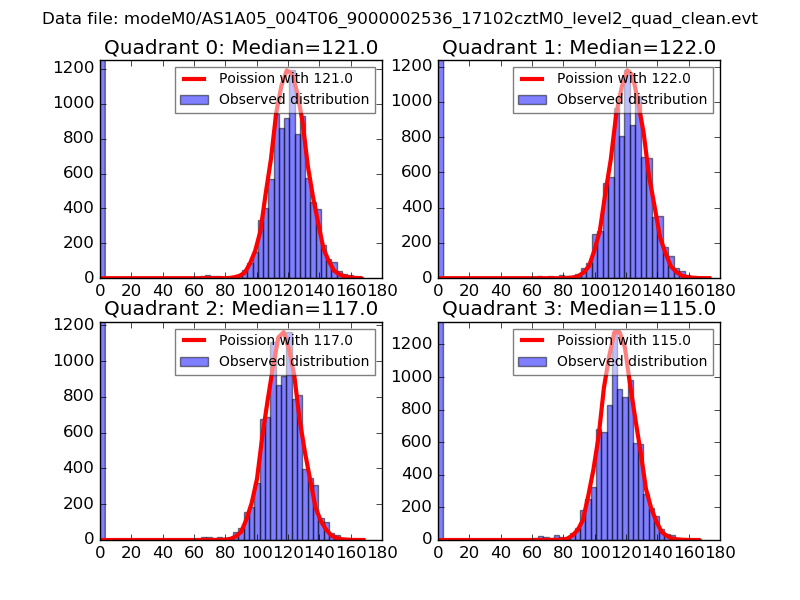 |
 |
| Quadrant-wise count rates Data is divided into 100 sec bins |
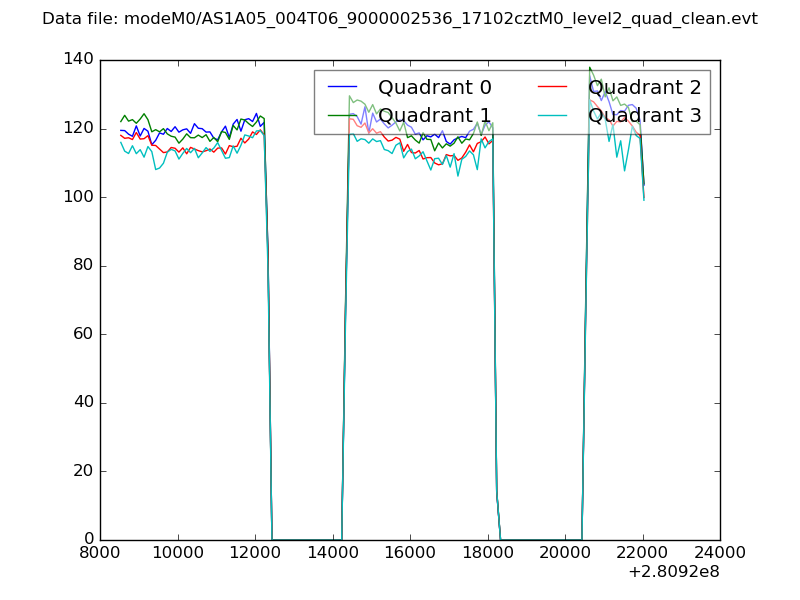 |
|
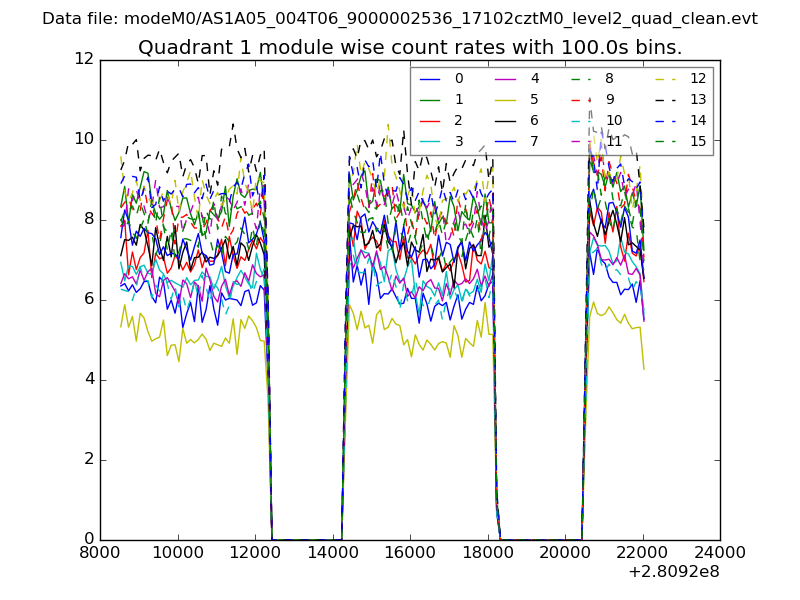
| Module-wise count rates for Quadrant A Data is divided into 100 sec bins |
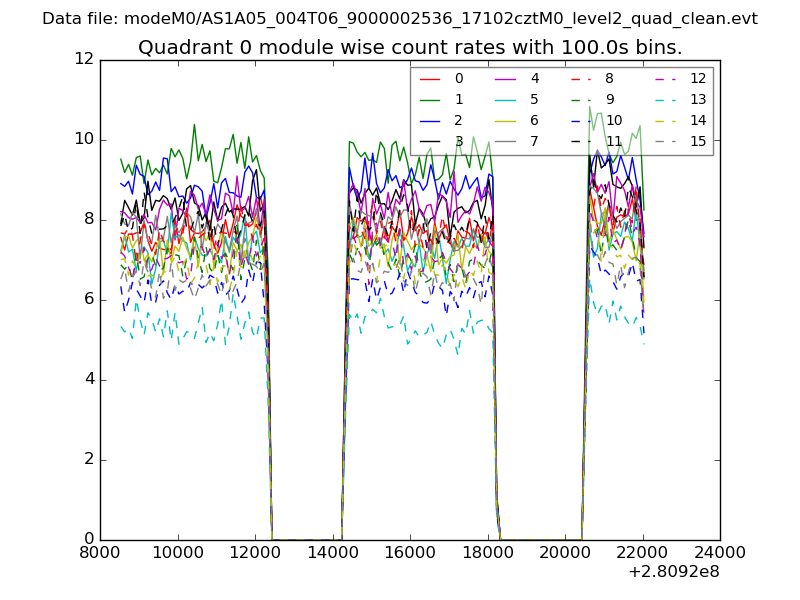 |
 |
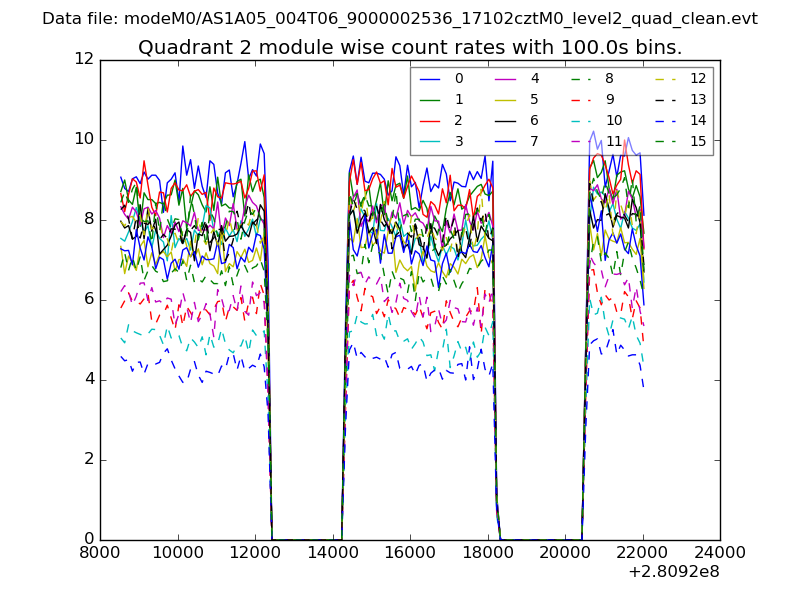
| Module-wise count rates for Quadrant B Data is divided into 100 sec bins |
 |
 |
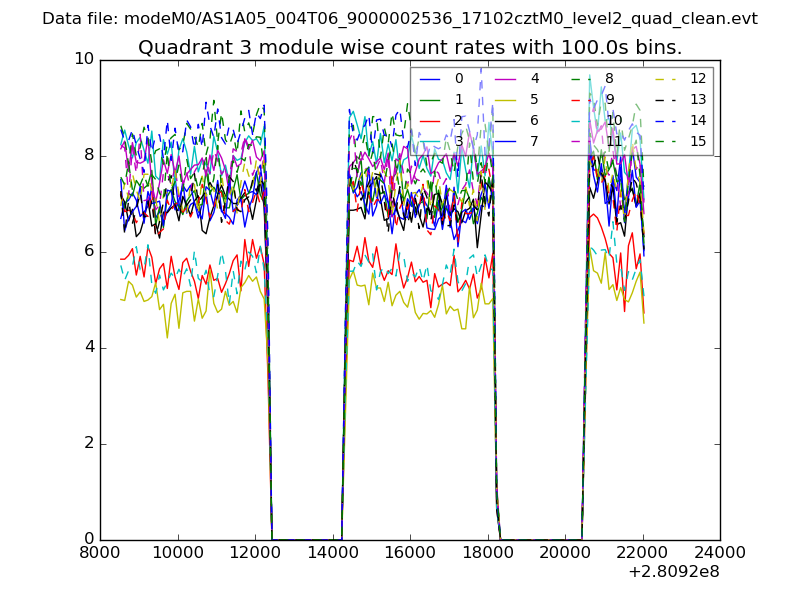
| Module-wise count rates for Quadrant C Data is divided into 100 sec bins |
 |
 |
| Module-wise count rates for Quadrant D Data is divided into 100 sec bins |
 |
 |
| Parameter | Plot |
|---|---|
| CZT HV Monitor | 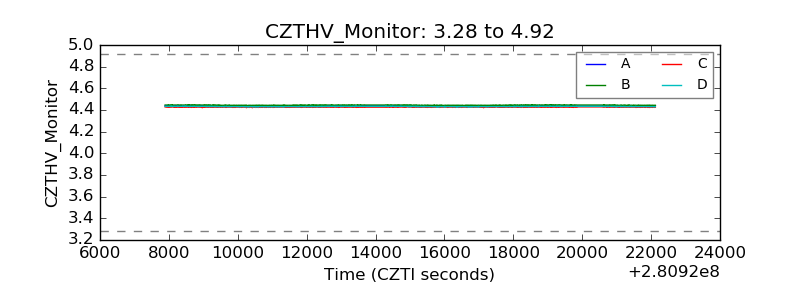 |
| D_VDD |  |
| Temperature 1 | 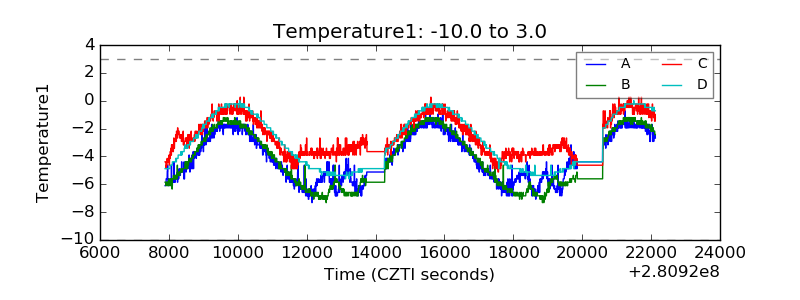 |
| Veto HV Monitor | 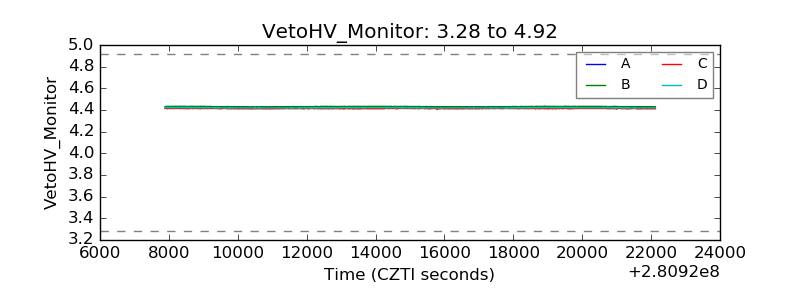 |
| Veto LLD | 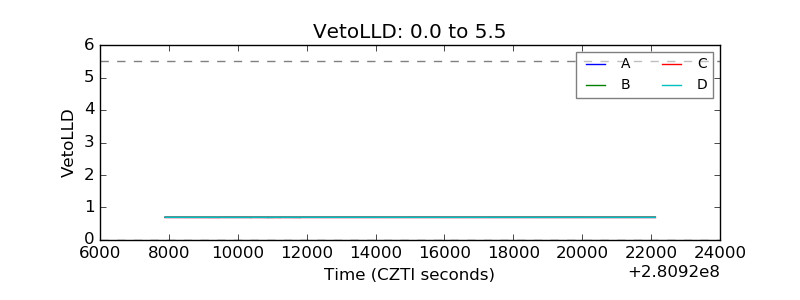 |
| Alpha Counter |  |
| _CPM_Rate | 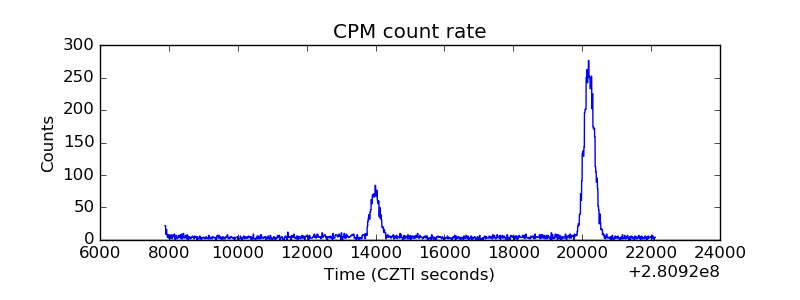 |
| CZT Counter | 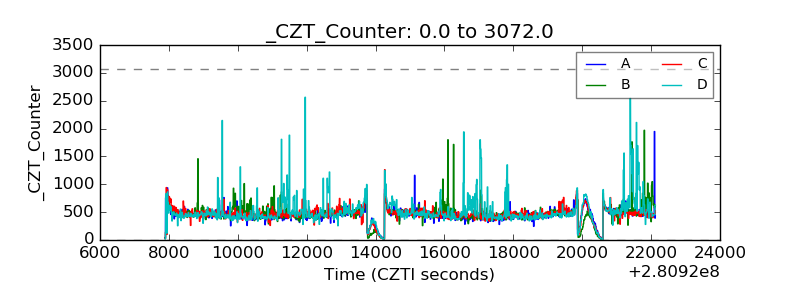 |
| +2.5 Volts monitor | 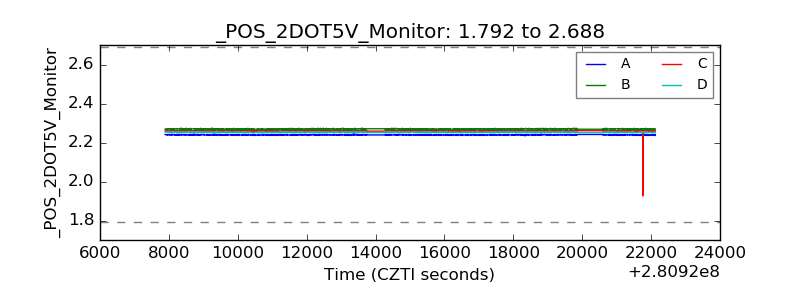 |
| +5 Volts monitor |  |
| _ROLL_ROT | 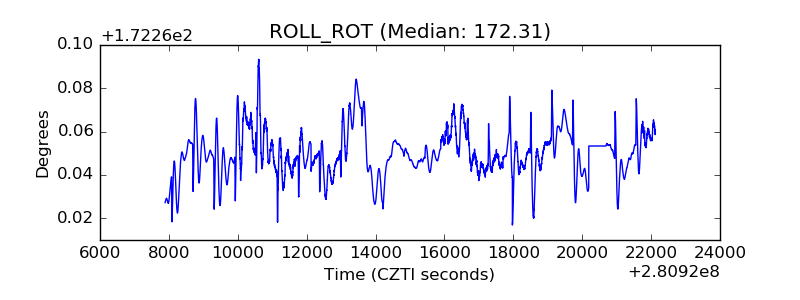 |
| _Roll_DEC | 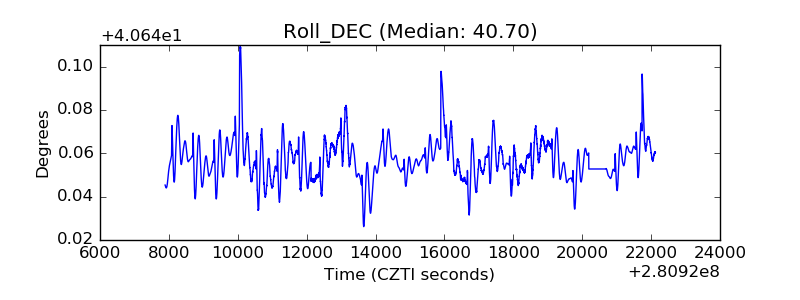 |
| _Roll_RA | 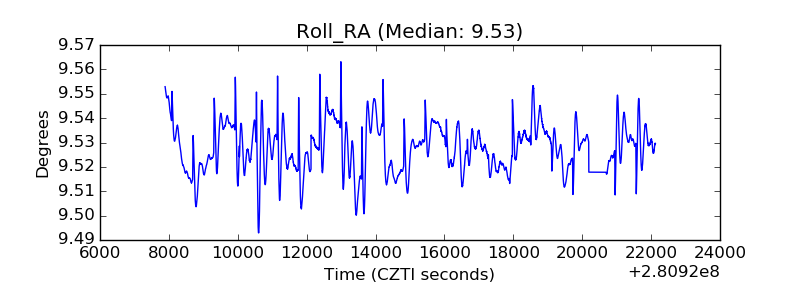 |
| Veto Counter | 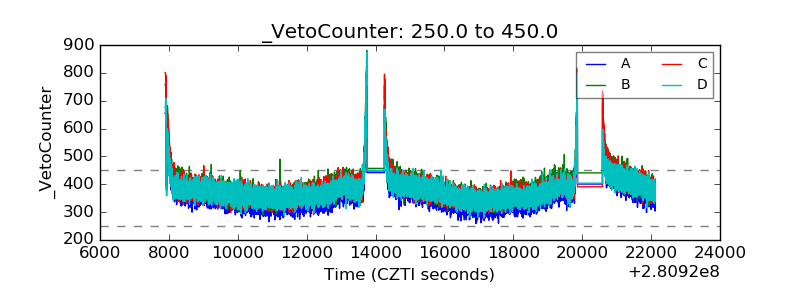 |