| Param | Original file | Final file |
|---|---|---|
| Filename | modeM0/AS1A05_004T06_9000002536_17103cztM0_level2.evt | modeM0/AS1A05_004T06_9000002536_17103cztM0_level2_quad_clean.evt |
| Size (bytes) | 190,290,240 | 49,173,120 |
| Size | 181.5 MB | 46.9 MB |
| Events in quadrant A | 1,200,783 | 331,255 |
| Events in quadrant B | 1,372,752 | 331,930 |
| Events in quadrant C | 1,243,091 | 319,062 |
| Events in quadrant D | 1,758,925 | 311,688 |
| Mode SS | |||
|---|---|---|---|
| Quadrant | BADHDUFLAG | Total packets | Discarded packets |
| A | 0 | 56 | 0 |
| B | 0 | 56 | 0 |
| C | 0 | 56 | 0 |
| D | 0 | 56 | 0 |
| Mode M0 | |||
|---|---|---|---|
| Quadrant | BADHDUFLAG | Total packets | Discarded packets |
| A | 0 | 5496 | 24 |
| B | 0 | 5943 | 16 |
| C | 0 | 5513 | 24 |
| D | 0 | 7152 | 43 |
| Quadrant | Total seconds | Saturated seconds | Saturation percentage |
|---|---|---|---|
| A | 2717 | 4 | 0.147221% |
| B | 2721 | 8 | 0.294010% |
| C | 2717 | 11 | 0.404858% |
| D | 2718 | 111 | 4.083885% |
Noise dominated data is calculated using 1-second bins in cleaned event files. If a bin has >2000 counts, and if more than 50% of those come from <1% of pixels, then it is considered to be noise-dominated and hence unusable.
| Quadrant | # 1 sec bins | Bins with >0 counts | Bins with >2000 counts | High rate bins dominated by noise | Noise dominated (total time) | Noise dominated (detector-on time) | Marked lightcurve |
|---|---|---|---|---|---|---|---|
| A | 2728 | 2726 | 1 | 1 | 0.04% | 0.04% | 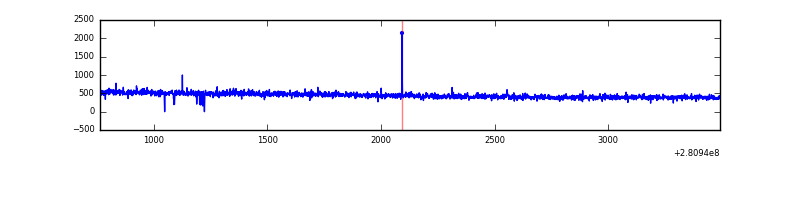 |
| B | 2729 | 2728 | 4 | 4 | 0.15% | 0.15% | 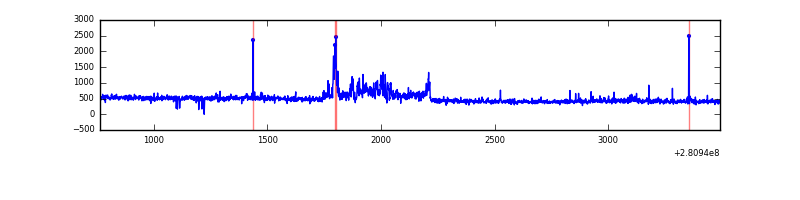 |
| C | 2729 | 2729 | 0 | 0 | 0.00% | 0.00% | 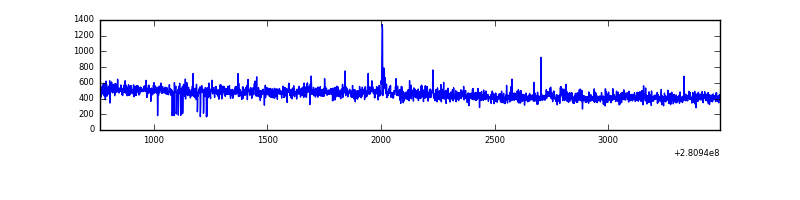 |
| D | 2729 | 2729 | 83 | 83 | 3.04% | 3.04% | 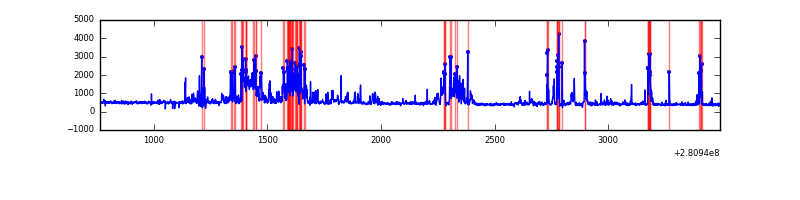 |
Top three noisy pixels from each quadrant. If the there are fewer than three noisy pixels in the level2.evt file, extra rows are filled as -1
| Pixel properties | Quadrant properties | ||||||
|---|---|---|---|---|---|---|---|
| Quadrant | DetID | PixID | Counts | Sigma | Mean | Median | Sigma |
| A | 4 | 2 | 5333 | 77.55 | 310 | 303 | 64.9 |
| A | 0 | 226 | 2895 | 39.96 | 310 | 303 | 64.9 |
| A | 12 | 194 | 2353 | 31.6 | 310 | 303 | 64.9 |
| B | 4 | 216 | 93581 | 1531.72 | 306 | 298 | 60.9 |
| B | 7 | 220 | 34949 | 568.97 | 306 | 298 | 60.9 |
| B | 0 | 189 | 11571 | 185.1 | 306 | 298 | 60.9 |
| C | 14 | 238 | 45616 | 646.73 | 296 | 298 | 70.1 |
| C | 3 | 233 | 21902 | 308.31 | 296 | 298 | 70.1 |
| C | 9 | 54 | 11126 | 154.53 | 296 | 298 | 70.1 |
| D | 5 | 222 | 462659 | 6298.4 | 301 | 292 | 73.4 |
| D | 10 | 70 | 109842 | 1492.3 | 301 | 292 | 73.4 |
| D | 12 | 110 | 16892 | 226.13 | 301 | 292 | 73.4 |
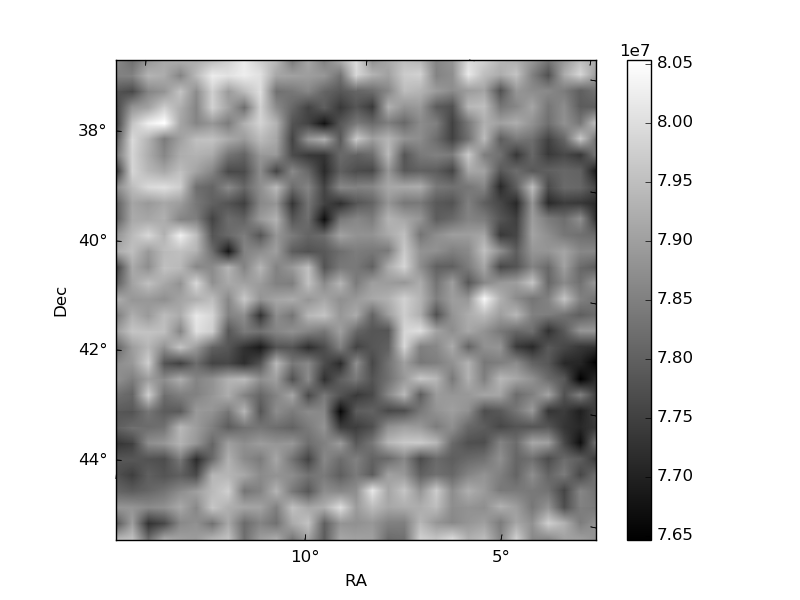
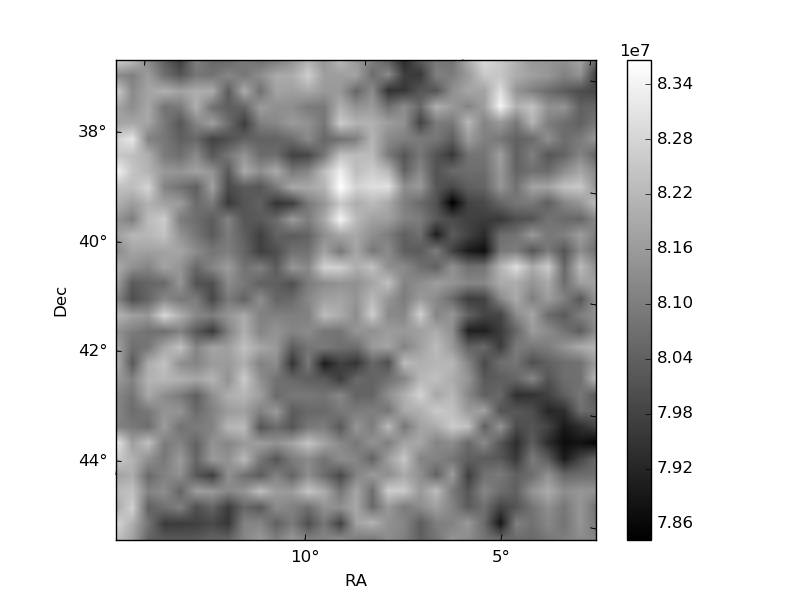
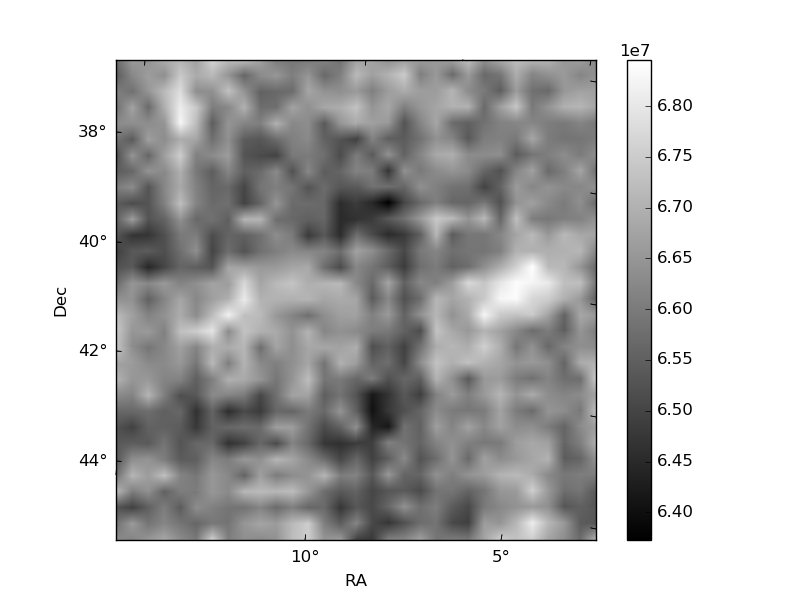
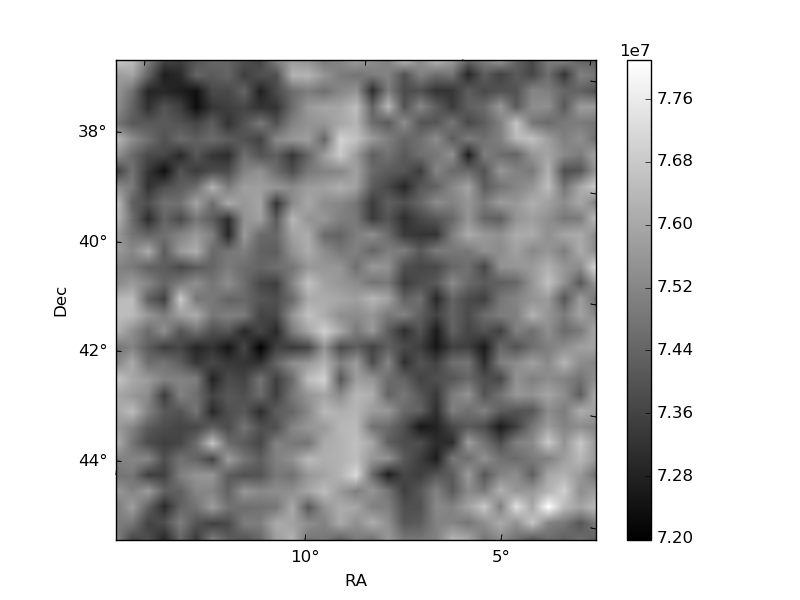
Histogram calculated using DETX and DETY for each event in the final _common_clean file
| Quadrant A | 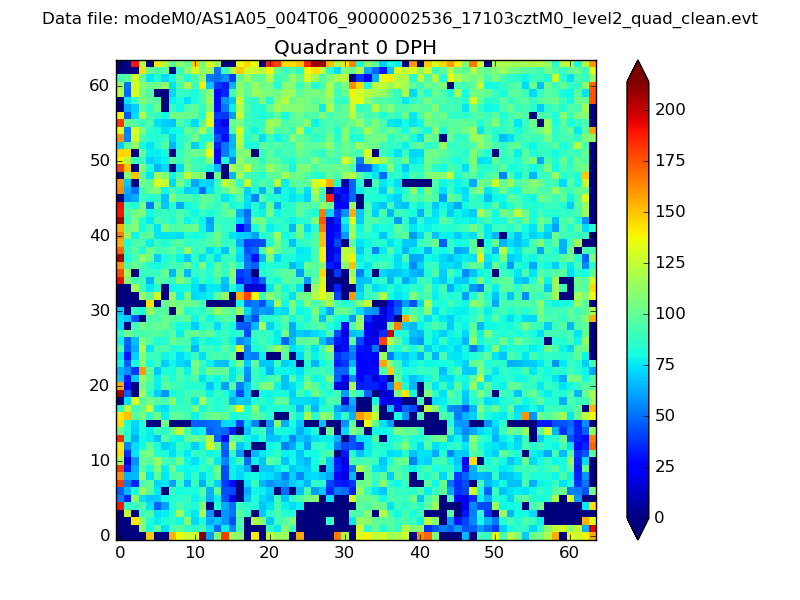 |
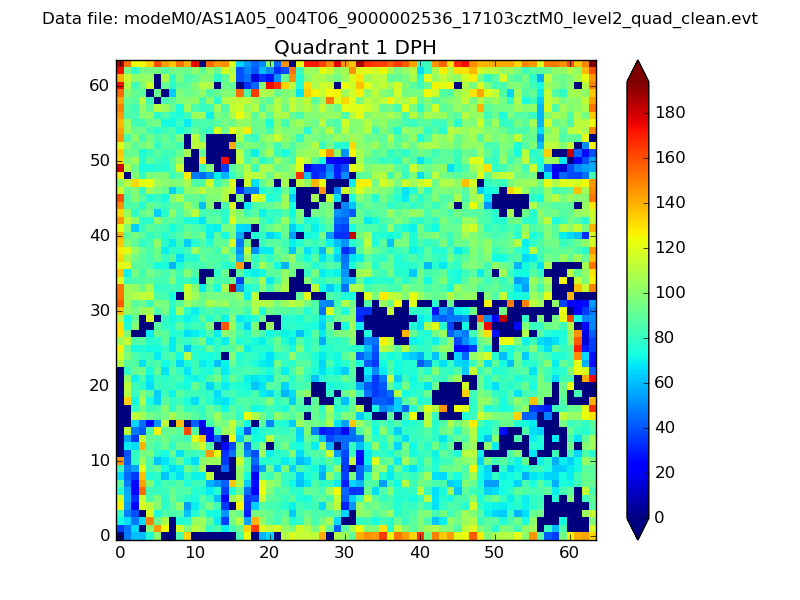 |
Quadrant B |
|---|---|---|---|
| Quadrant D | 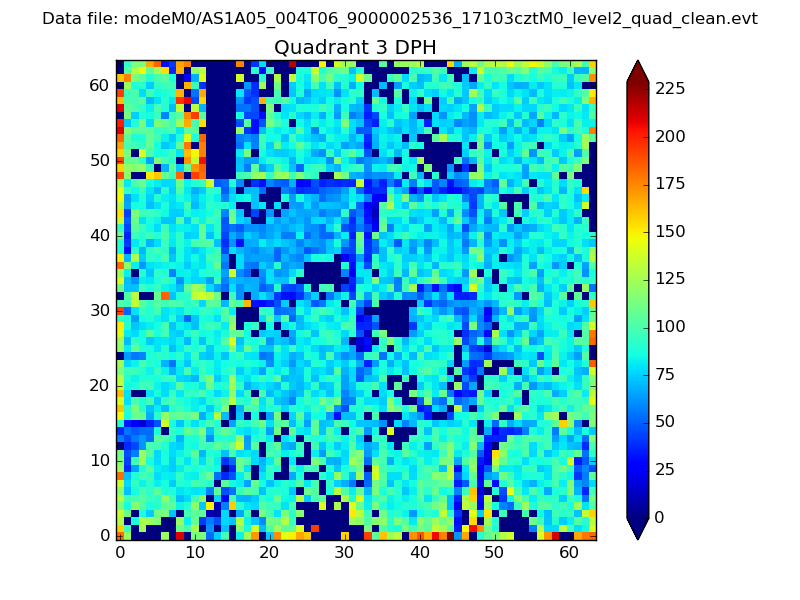 |
 |
Quadrant C |
| Plot type | Count rate plots | Images |
|---|---|---|
| Comparison with Poisson distribution Blue bars denote a histogram of data divided into 1 sec bins. Red curve is a Poisson curve with rate = median count rate of data. |
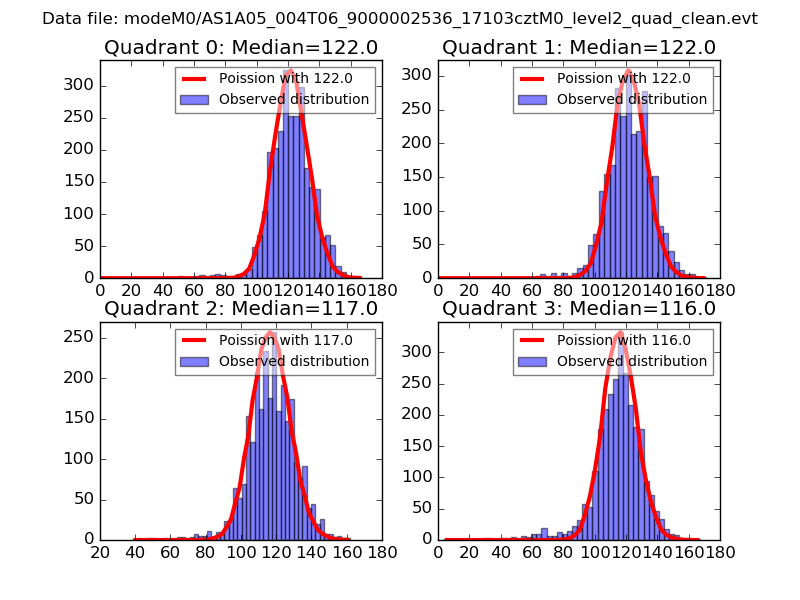 |
 |
| Quadrant-wise count rates Data is divided into 100 sec bins |
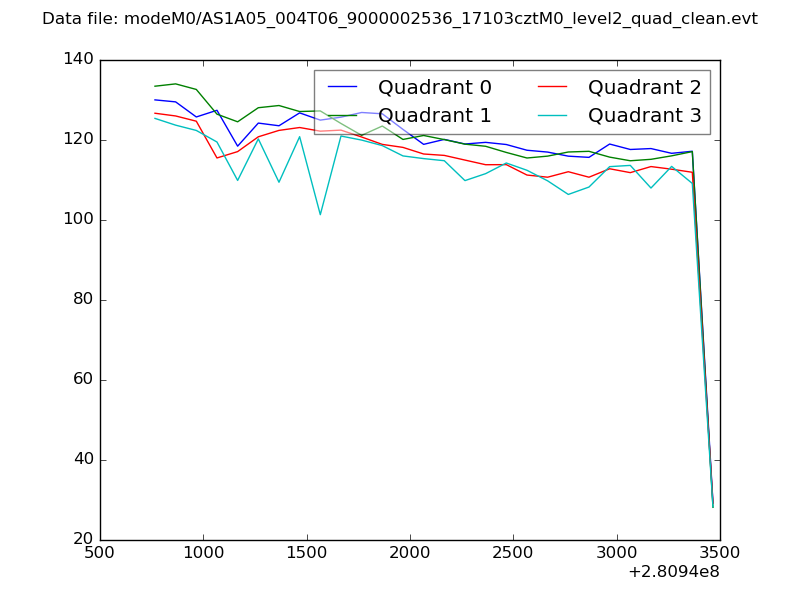 |
|
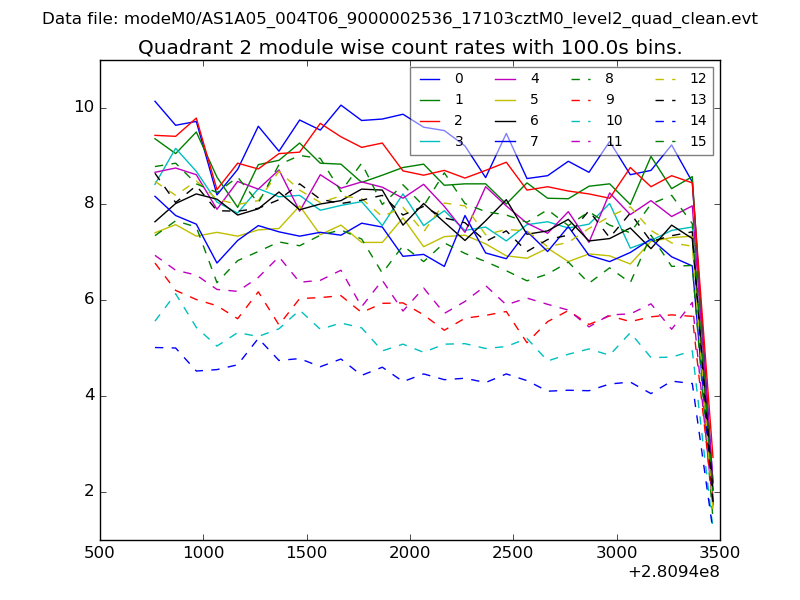
| Module-wise count rates for Quadrant A Data is divided into 100 sec bins |
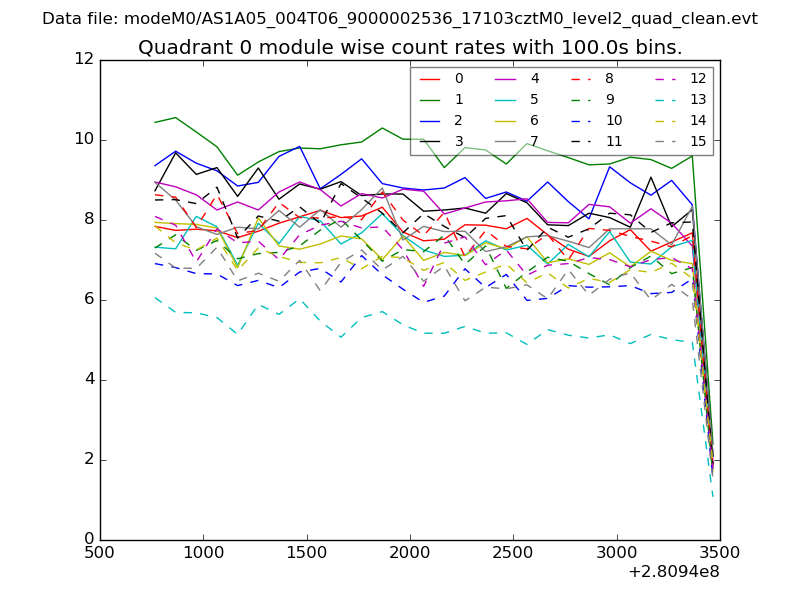 |
 |
| Module-wise count rates for Quadrant B Data is divided into 100 sec bins |
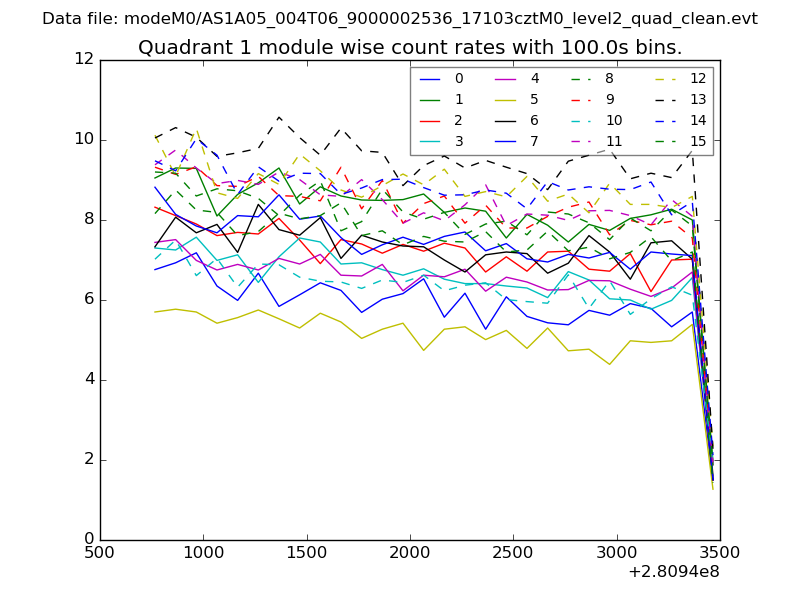 |
 |
| Module-wise count rates for Quadrant C Data is divided into 100 sec bins |
 |
 |
| Module-wise count rates for Quadrant D Data is divided into 100 sec bins |
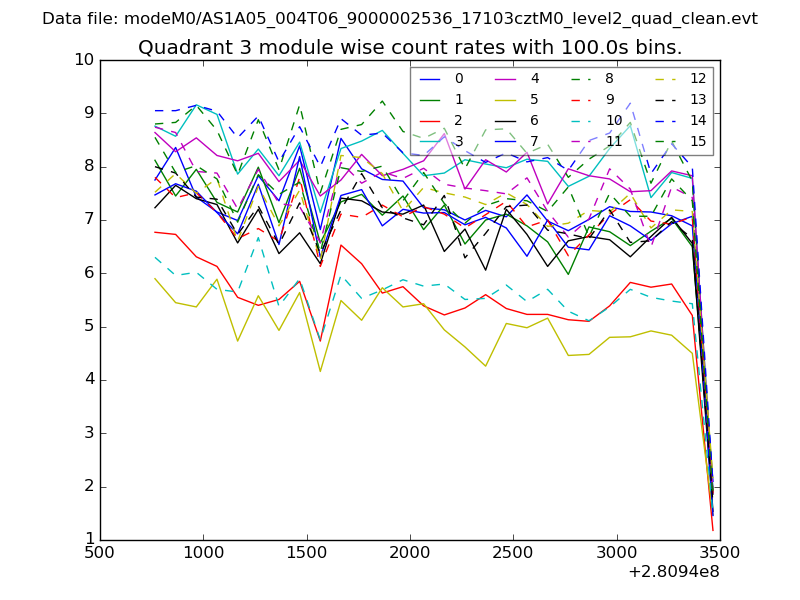 |
 |
| Parameter | Plot |
|---|---|
| CZT HV Monitor | 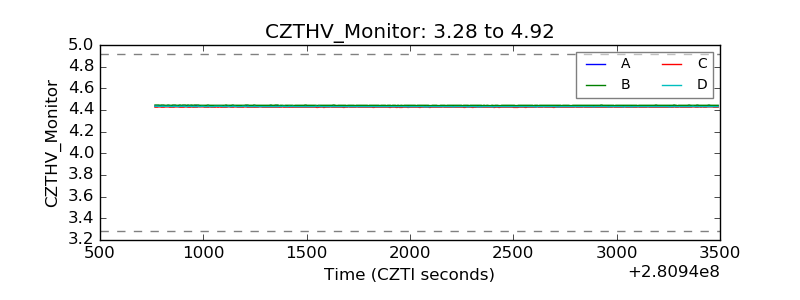 |
| D_VDD | 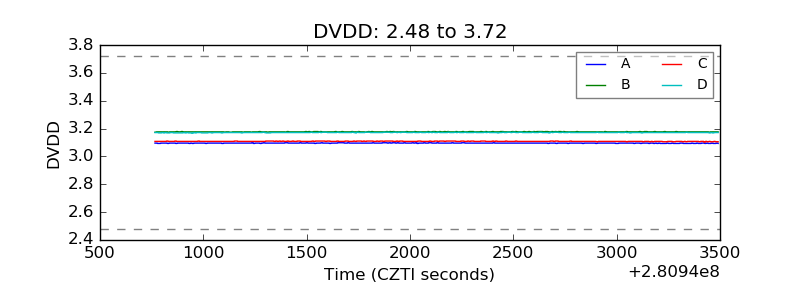 |
| Temperature 1 | 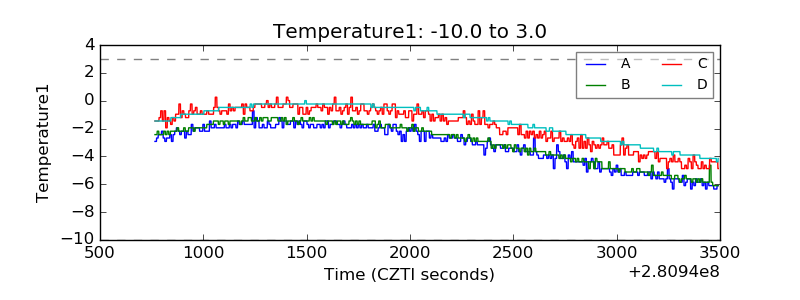 |
| Veto HV Monitor | 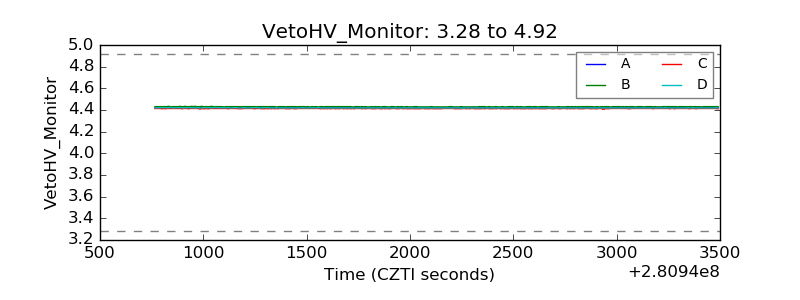 |
| Veto LLD | 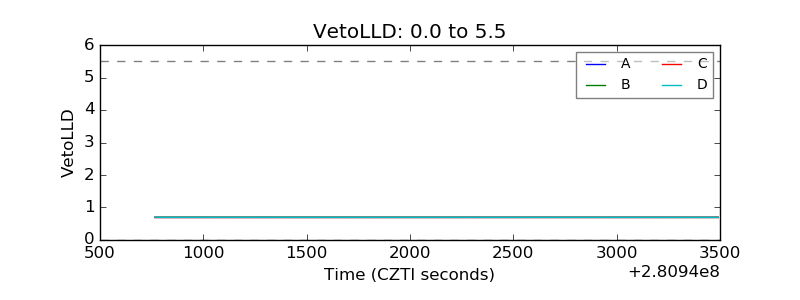 |
| Alpha Counter | 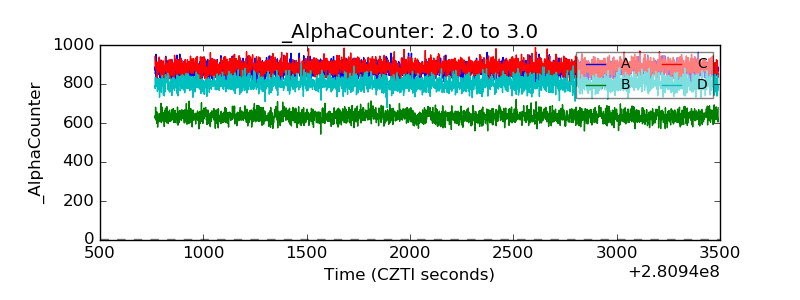 |
| _CPM_Rate | 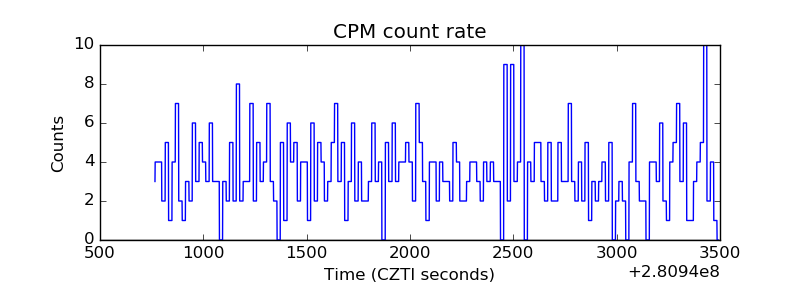 |
| CZT Counter | 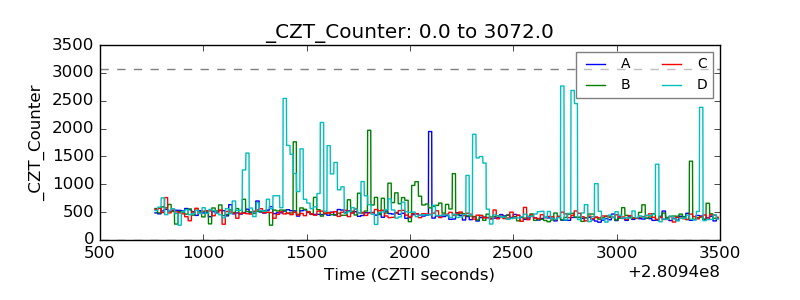 |
| +2.5 Volts monitor | 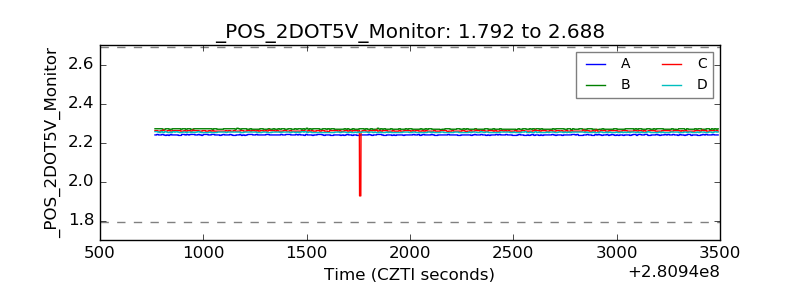 |
| +5 Volts monitor |  |
| _ROLL_ROT | 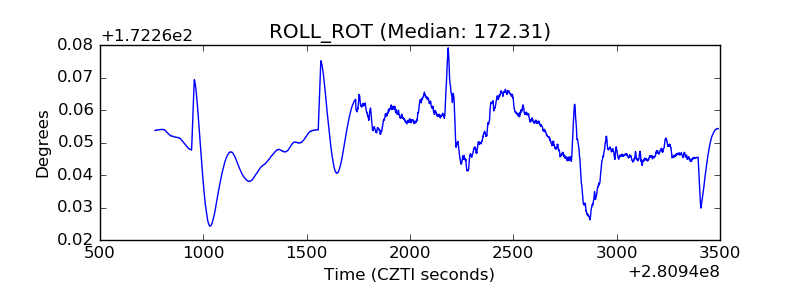 |
| _Roll_DEC | 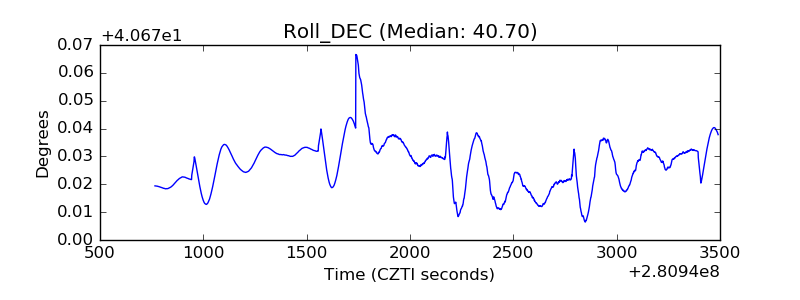 |
| _Roll_RA | 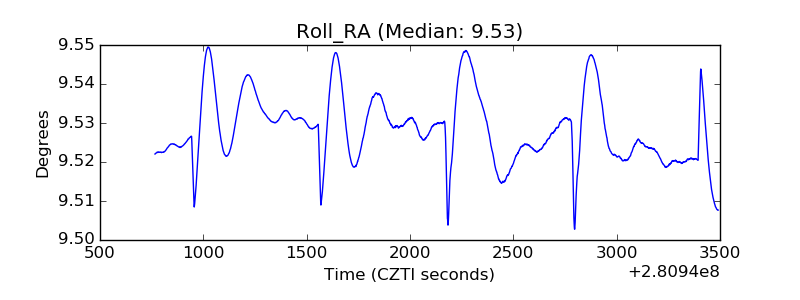 |
| Veto Counter | 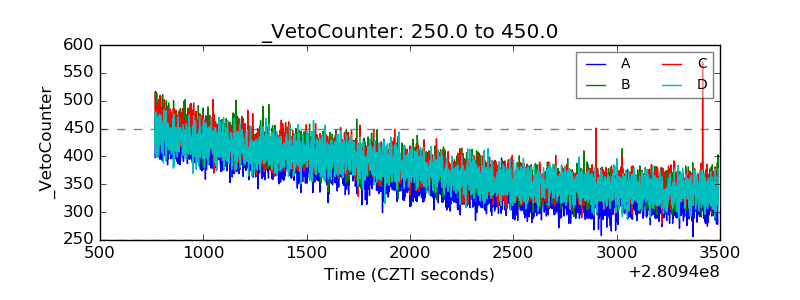 |