| Param | Original file | Final file |
|---|---|---|
| Filename | modeM0/AS1A05_004T06_9000002536_17104cztM0_level2.evt | modeM0/AS1A05_004T06_9000002536_17104cztM0_level2_quad_clean.evt |
| Size (bytes) | 131,541,120 | 34,623,360 |
| Size | 125.4 MB | 33.0 MB |
| Events in quadrant A | 810,299 | 232,939 |
| Events in quadrant B | 970,734 | 231,160 |
| Events in quadrant C | 859,223 | 223,236 |
| Events in quadrant D | 1,208,232 | 218,822 |
| Mode SS | |||
|---|---|---|---|
| Quadrant | BADHDUFLAG | Total packets | Discarded packets |
| A | 0 | 40 | 0 |
| B | 0 | 40 | 0 |
| C | 0 | 40 | 0 |
| D | 0 | 40 | 0 |
| Mode M0 | |||
|---|---|---|---|
| Quadrant | BADHDUFLAG | Total packets | Discarded packets |
| A | 0 | 3904 | 0 |
| B | 0 | 4330 | 0 |
| C | 0 | 3924 | 0 |
| D | 0 | 4998 | 0 |
| Quadrant | Total seconds | Saturated seconds | Saturation percentage |
|---|---|---|---|
| A | 1946 | 0 | 0.000000% |
| B | 1946 | 6 | 0.308325% |
| C | 1946 | 6 | 0.308325% |
| D | 1946 | 74 | 3.802672% |
Noise dominated data is calculated using 1-second bins in cleaned event files. If a bin has >2000 counts, and if more than 50% of those come from <1% of pixels, then it is considered to be noise-dominated and hence unusable.
| Quadrant | # 1 sec bins | Bins with >0 counts | Bins with >2000 counts | High rate bins dominated by noise | Noise dominated (total time) | Noise dominated (detector-on time) | Marked lightcurve |
|---|---|---|---|---|---|---|---|
| A | 1946 | 1946 | 1 | 1 | 0.05% | 0.05% | 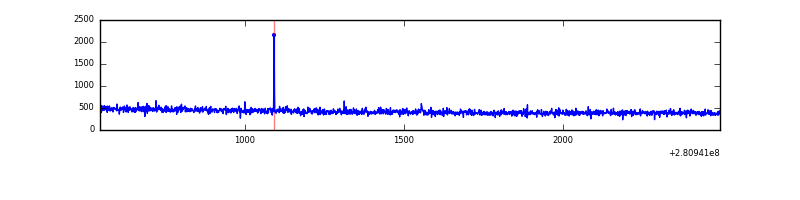 |
| B | 1946 | 1946 | 3 | 3 | 0.15% | 0.15% | 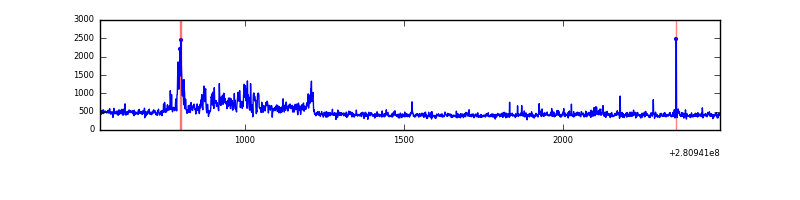 |
| C | 1946 | 1946 | 0 | 0 | 0.00% | 0.00% | 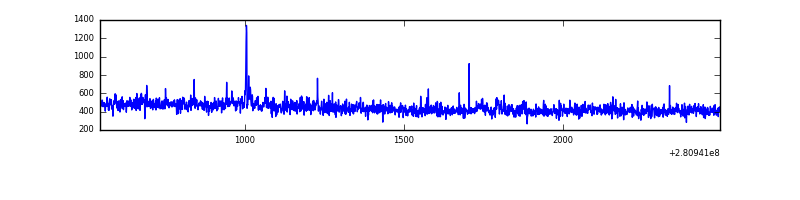 |
| D | 1946 | 1946 | 64 | 64 | 3.29% | 3.29% | 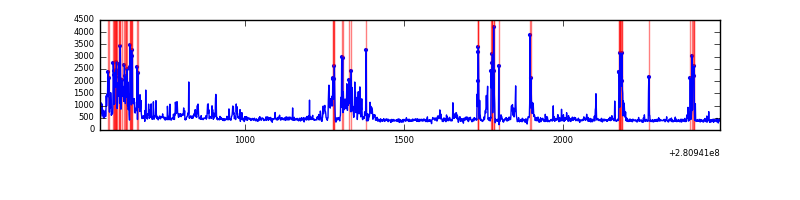 |
Top three noisy pixels from each quadrant. If the there are fewer than three noisy pixels in the level2.evt file, extra rows are filled as -1
| Pixel properties | Quadrant properties | ||||||
|---|---|---|---|---|---|---|---|
| Quadrant | DetID | PixID | Counts | Sigma | Mean | Median | Sigma |
| A | 4 | 2 | 4912 | 105.11 | 209 | 204 | 44.8 |
| A | 0 | 226 | 1896 | 37.77 | 209 | 204 | 44.8 |
| A | 12 | 194 | 1661 | 32.53 | 209 | 204 | 44.8 |
| B | 4 | 216 | 91981 | 2199.77 | 207 | 201 | 41.7 |
| B | 7 | 220 | 34844 | 830.32 | 207 | 201 | 41.7 |
| B | 0 | 189 | 9433 | 221.27 | 207 | 201 | 41.7 |
| C | 14 | 238 | 31116 | 632.7 | 203 | 203 | 48.9 |
| C | 3 | 233 | 19433 | 393.58 | 203 | 203 | 48.9 |
| C | 9 | 54 | 9806 | 196.54 | 203 | 203 | 48.9 |
| D | 5 | 222 | 330003 | 6489.69 | 204 | 198 | 50.8 |
| D | 10 | 70 | 65211 | 1279.28 | 204 | 198 | 50.8 |
| D | 12 | 110 | 16633 | 323.4 | 204 | 198 | 50.8 |
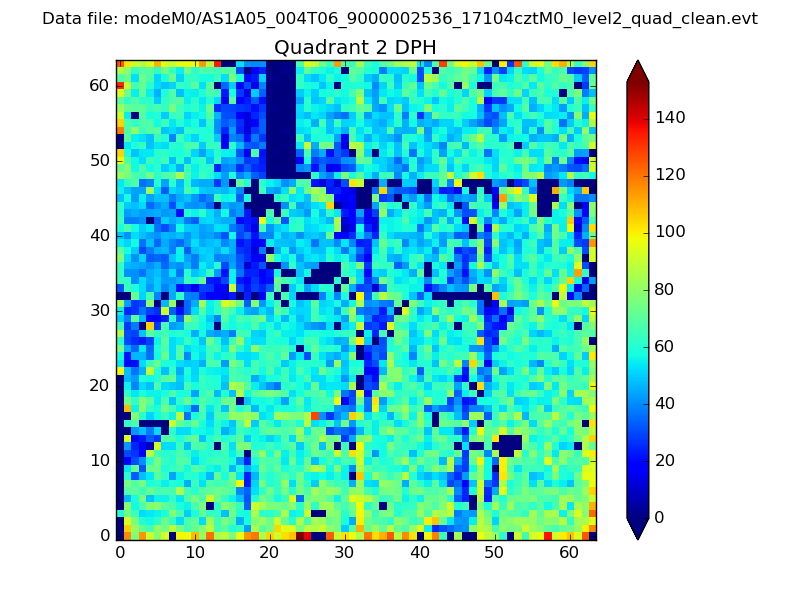
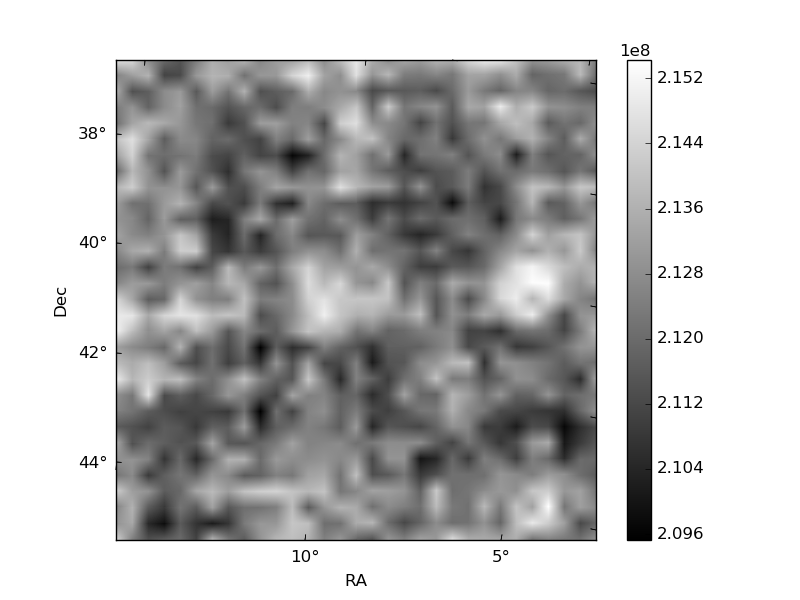
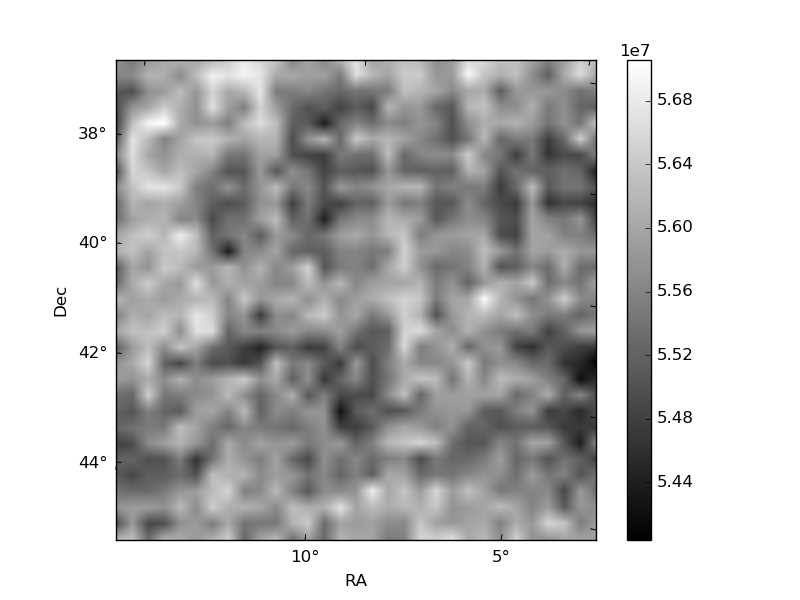
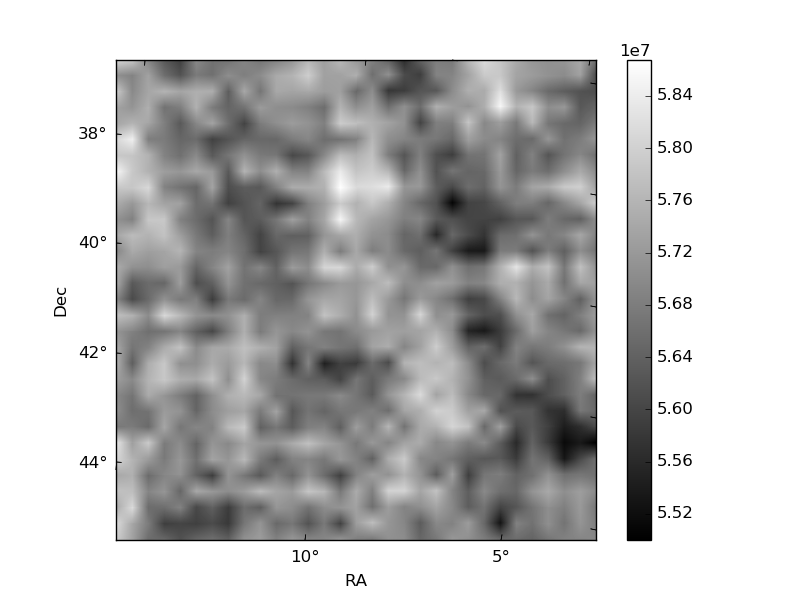
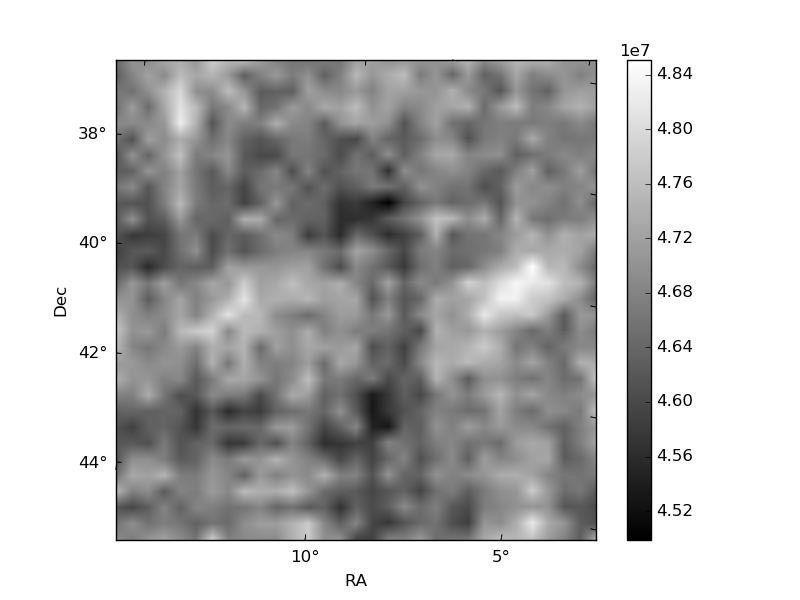
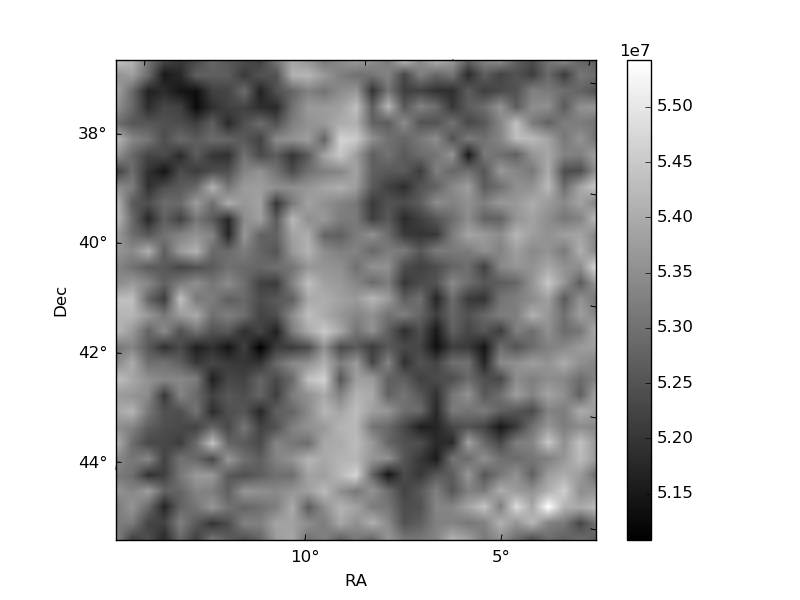
Histogram calculated using DETX and DETY for each event in the final _common_clean file
| Quadrant A | 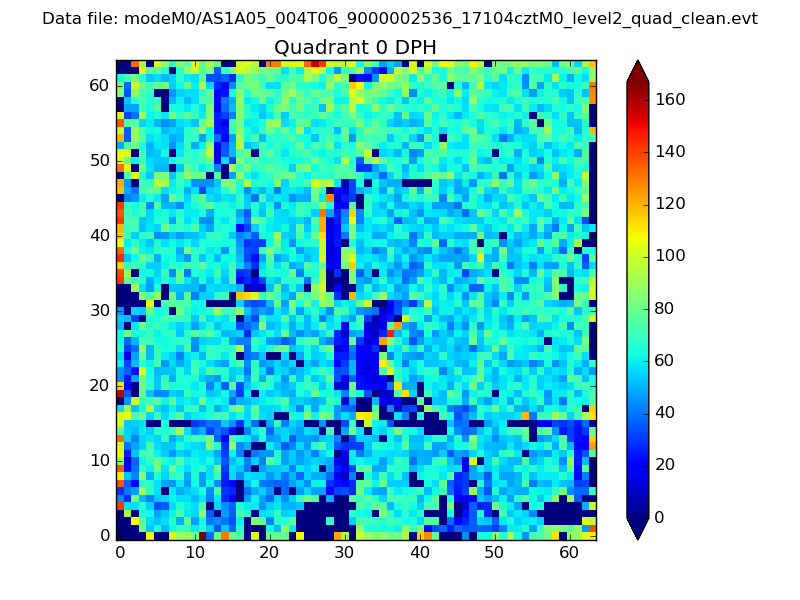 |
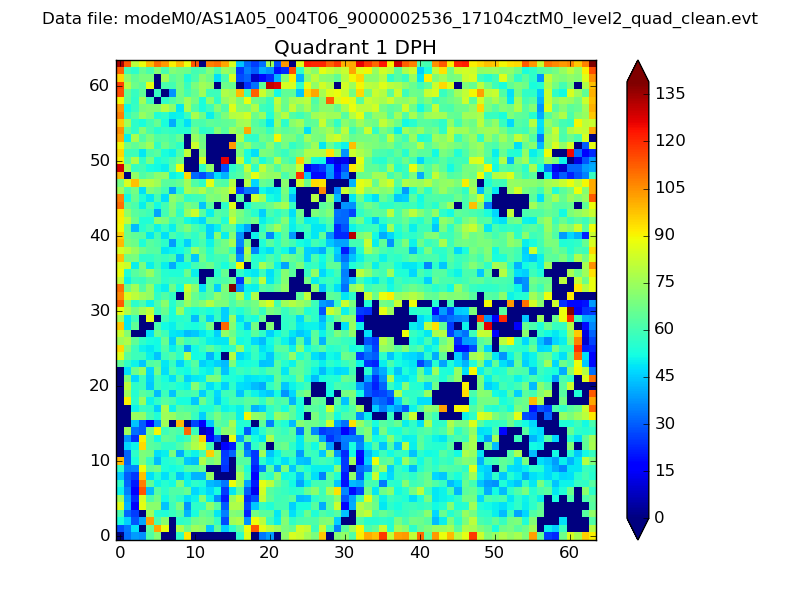 |
Quadrant B |
|---|---|---|---|
| Quadrant D | 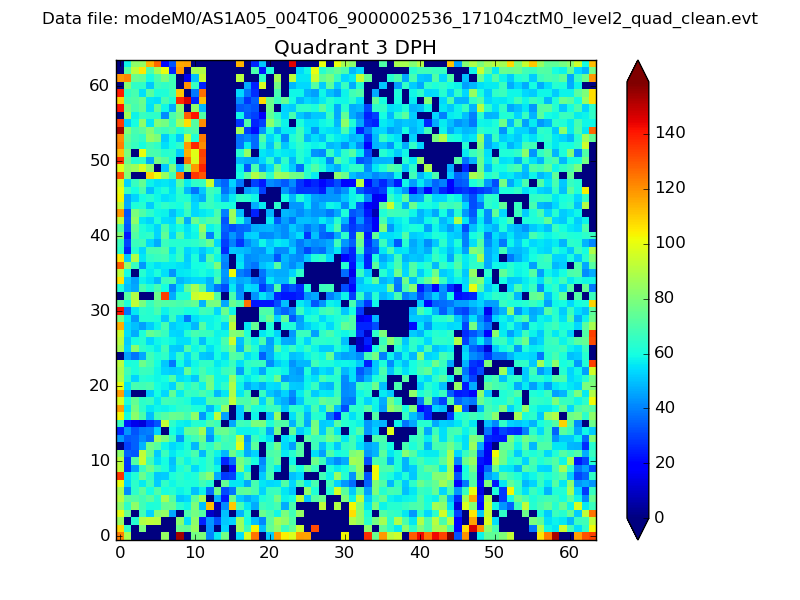 |
 |
Quadrant C |
| Plot type | Count rate plots | Images |
|---|---|---|
| Comparison with Poisson distribution Blue bars denote a histogram of data divided into 1 sec bins. Red curve is a Poisson curve with rate = median count rate of data. |
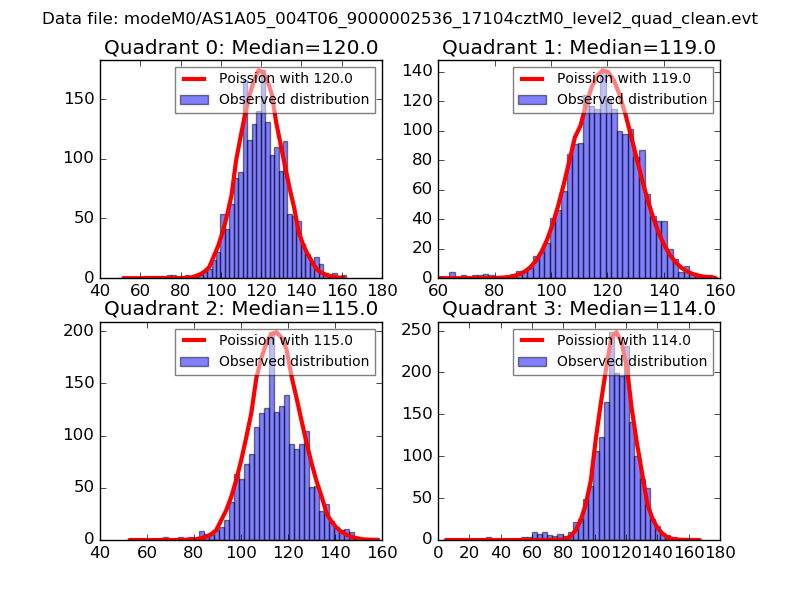 |
 |
| Quadrant-wise count rates Data is divided into 100 sec bins |
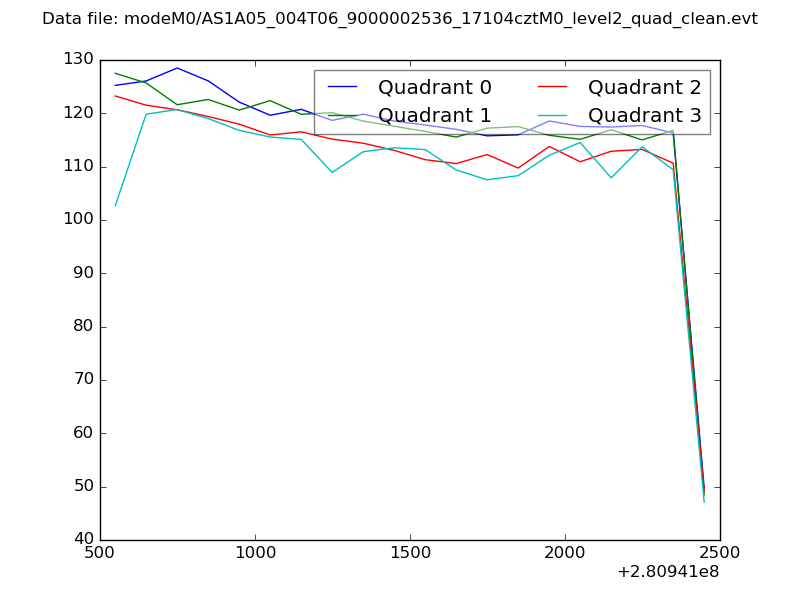 |
|
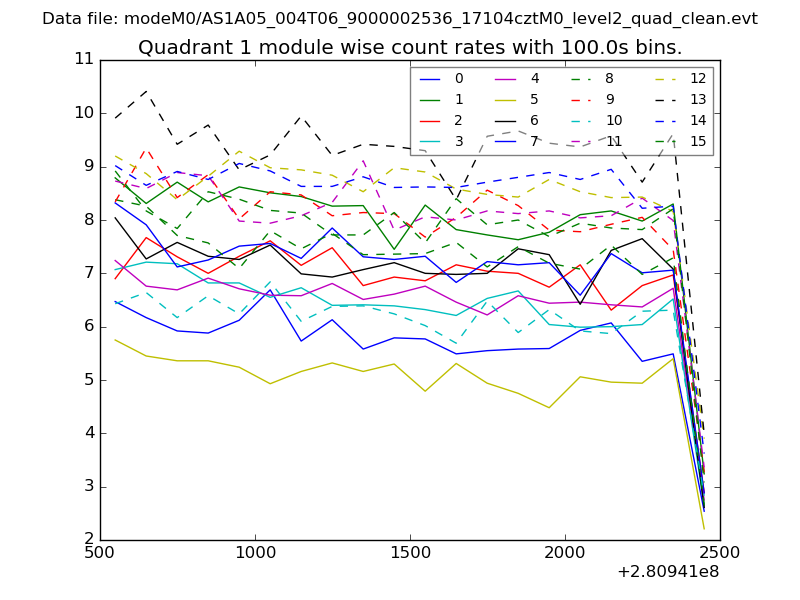
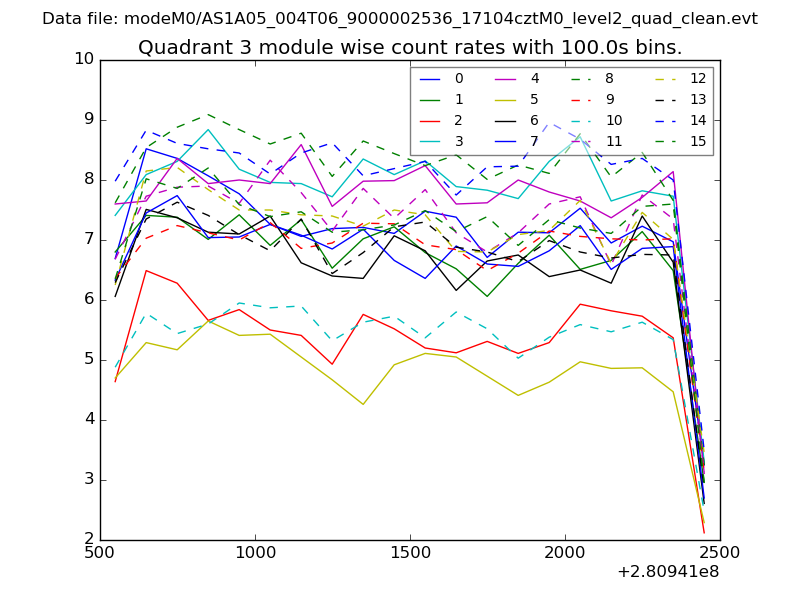
| Module-wise count rates for Quadrant A Data is divided into 100 sec bins |
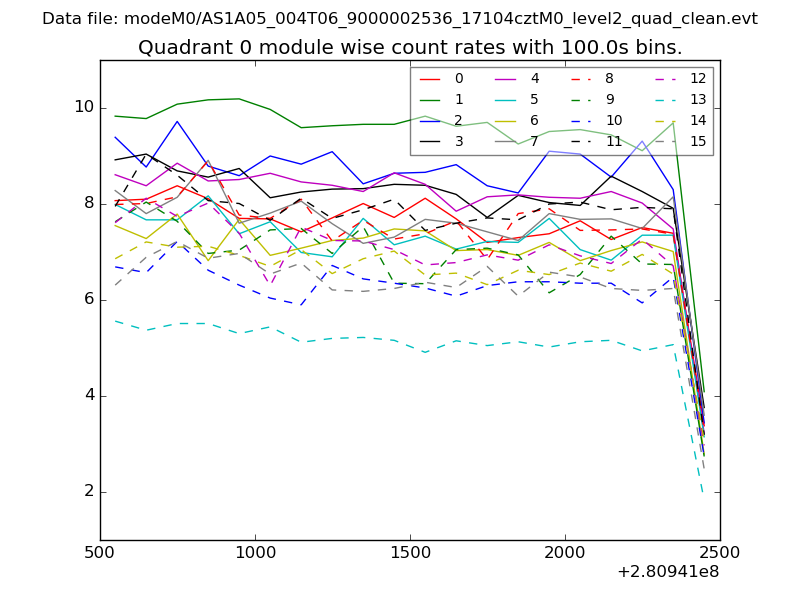 |
 |
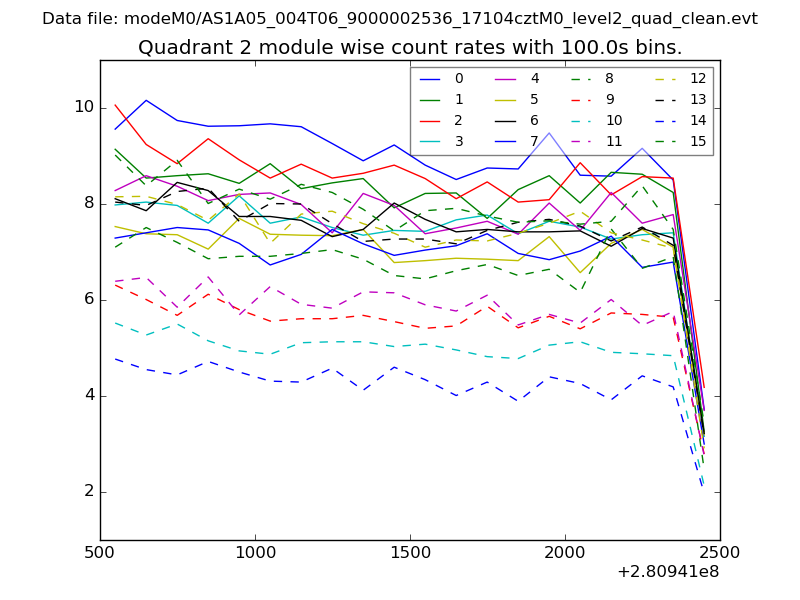
| Module-wise count rates for Quadrant B Data is divided into 100 sec bins |
 |
 |
| Module-wise count rates for Quadrant C Data is divided into 100 sec bins |
 |
 |
| Module-wise count rates for Quadrant D Data is divided into 100 sec bins |
 |
 |
| Parameter | Plot |
|---|---|
| CZT HV Monitor | 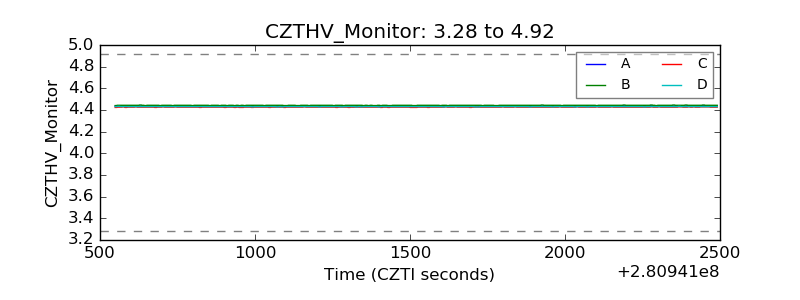 |
| D_VDD | 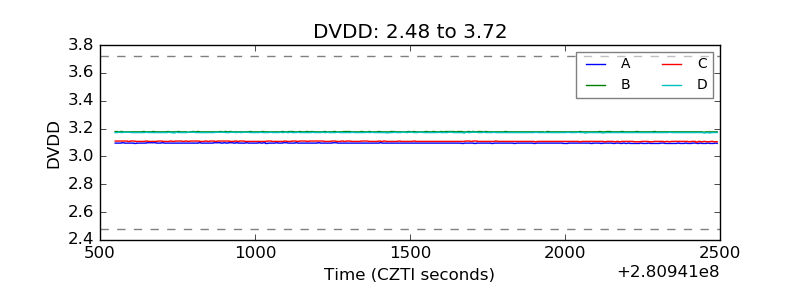 |
| Temperature 1 | 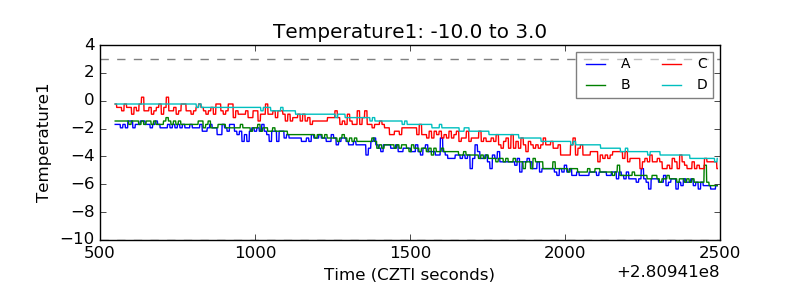 |
| Veto HV Monitor | 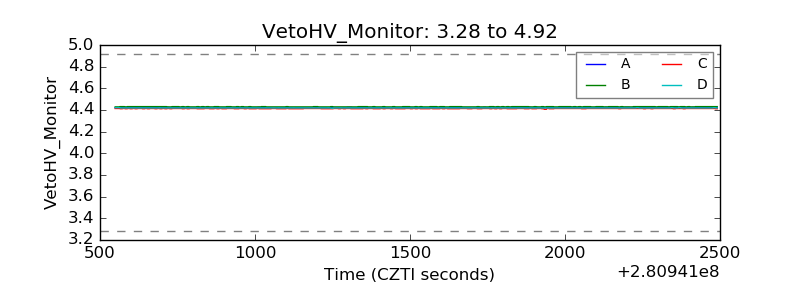 |
| Veto LLD | 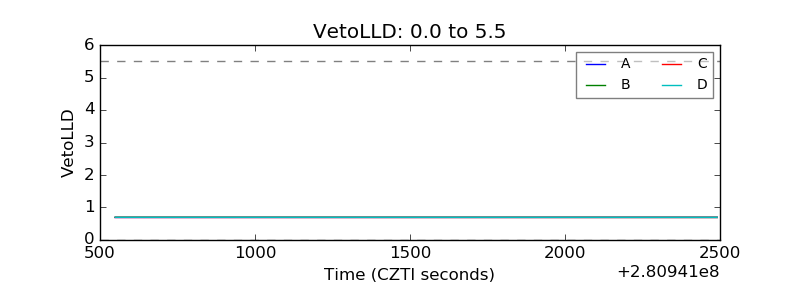 |
| Alpha Counter | 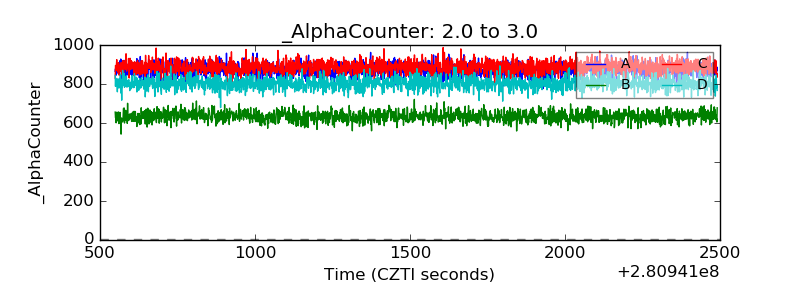 |
| _CPM_Rate | 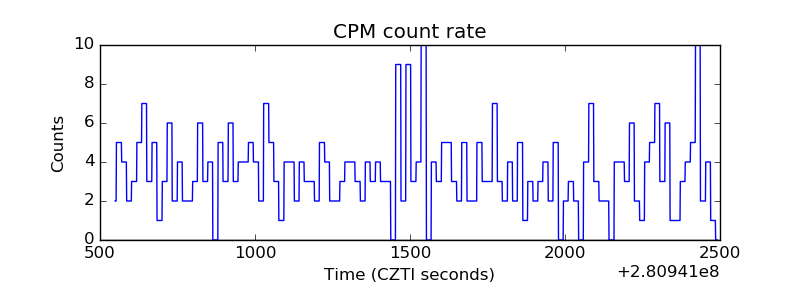 |
| CZT Counter | 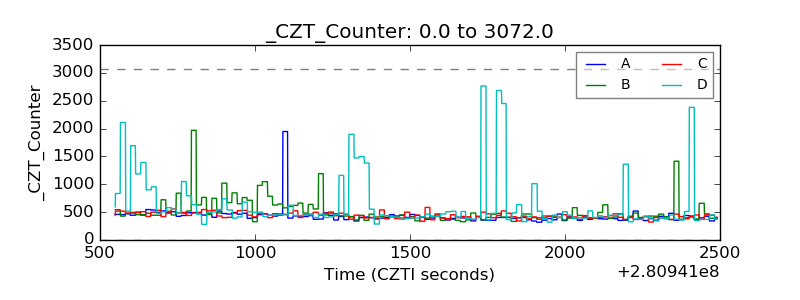 |
| +2.5 Volts monitor |  |
| +5 Volts monitor |  |
| _ROLL_ROT | 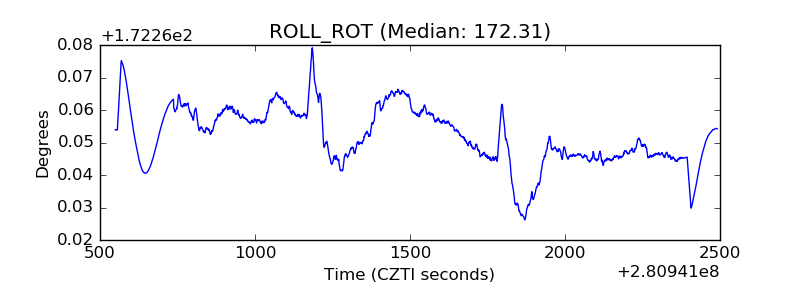 |
| _Roll_DEC | 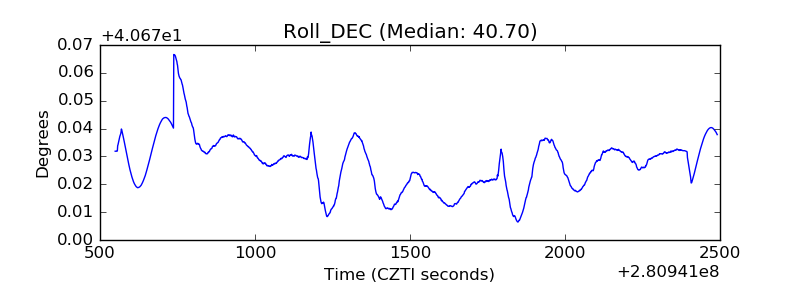 |
| _Roll_RA | 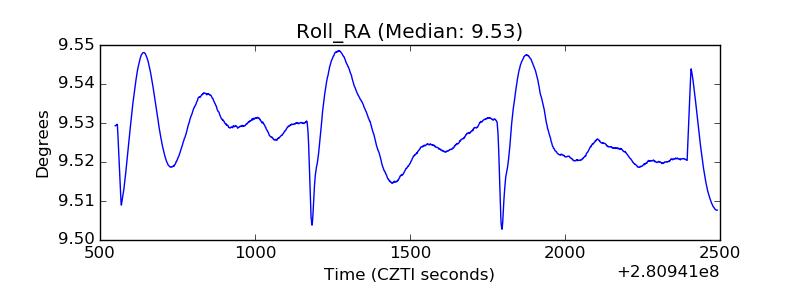 |
| Veto Counter | 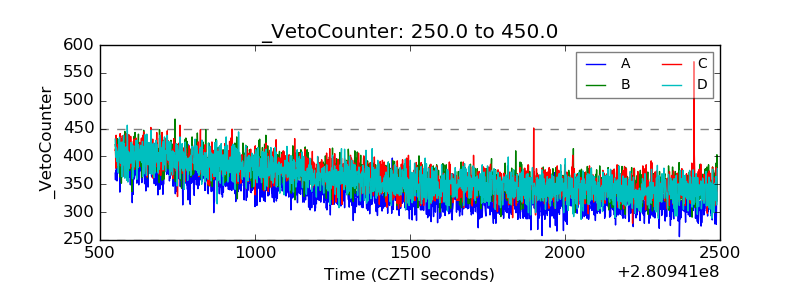 |