| Param | Original file | Final file |
|---|---|---|
| Filename | modeM0/AS1A05_004T03_9000002538cztM0_level2.fits | modeM0/AS1A05_004T03_9000002538cztM0_level2_quad_clean.evt |
| Size (bytes) | 670,852,800 | 595,733,760 |
| Size | 639.8 MB | 568.1 MB |
| Events in quadrant A | 4,109,918 | 3,471,891 |
| Events in quadrant B | 3,961,558 | 3,476,581 |
| Events in quadrant C | 3,990,626 | 3,283,852 |
| Events in quadrant D | 3,444,414 | 2,998,758 |
| Mode SS | |||
|---|---|---|---|
| Quadrant | BADHDUFLAG | Total packets | Discarded packets |
| A | 0 | 1434 | 0 |
| B | 0 | 1434 | 0 |
| C | 0 | 1434 | 0 |
| D | 0 | 1434 | 0 |
| Mode M0 | |||
|---|---|---|---|
| Quadrant | BADHDUFLAG | Total packets | Discarded packets |
| A | 0 | 144306 | 0 |
| B | 0 | 148151 | 0 |
| C | 0 | 151131 | 0 |
| D | 0 | 165777 | 0 |
| Mode M9 | |||
|---|---|---|---|
| Quadrant | BADHDUFLAG | Total packets | Discarded packets |
| A | 0 | 112 | 0 |
| B | 0 | 112 | 0 |
| C | 0 | 112 | 0 |
| D | 0 | 112 | 0 |
| Quadrant | Total seconds | Saturated seconds | Saturation percentage |
|---|---|---|---|
| A | 70132 | 751 | 1.070838% |
| B | 70132 | 920 | 1.311812% |
| C | 70131 | 1170 | 1.668306% |
| D | 70132 | 1802 | 2.569440% |
Noise dominated data is calculated using 1-second bins in cleaned event files. If a bin has >2000 counts, and if more than 50% of those come from <1% of pixels, then it is considered to be noise-dominated and hence unusable.
| Quadrant | # 1 sec bins | Bins with >0 counts | Bins with >2000 counts | High rate bins dominated by noise | Noise dominated (total time) | Noise dominated (detector-on time) | Marked lightcurve |
|---|---|---|---|---|---|---|---|
| A | 81502 | 70126 | 0 | 0 | 0.00% | 0.00% |  |
| B | 81502 | 70126 | 0 | 0 | 0.00% | 0.00% |  |
| C | 81502 | 70131 | 0 | 0 | 0.00% | 0.00% |  |
| D | 81502 | 70082 | 0 | 0 | 0.00% | 0.00% |  |
Top three noisy pixels from each quadrant. If the there are fewer than three noisy pixels in the level2.evt file, extra rows are filled as -1
| Pixel properties | Quadrant properties | ||||||
|---|---|---|---|---|---|---|---|
| Quadrant | DetID | PixID | Counts | Sigma | Mean | Median | Sigma |
| A | 0 | 29 | 3926 | 11.13 | 1067 | 1003 | 262.5 |
| A | 7 | 110 | 3288 | 8.7 | 1067 | 1003 | 262.5 |
| A | 0 | 30 | 3099 | 7.98 | 1067 | 1003 | 262.5 |
| B | 2 | 9 | 3194 | 10.58 | 1049 | 1001 | 207.4 |
| B | 2 | 8 | 2746 | 8.42 | 1049 | 1001 | 207.4 |
| B | 5 | 128 | 2632 | 7.87 | 1049 | 1001 | 207.4 |
| C | 1 | 81 | 2984 | 7.37 | 1053 | 984 | 271.3 |
| C | 1 | 80 | 2971 | 7.32 | 1053 | 984 | 271.3 |
| C | 12 | 241 | 2822 | 6.77 | 1053 | 984 | 271.3 |
| D | 3 | 14 | 2597 | 6.53 | 982 | 892 | 261.1 |
| D | 6 | 231 | 2508 | 6.19 | 982 | 892 | 261.1 |
| D | 7 | 3 | 2490 | 6.12 | 982 | 892 | 261.1 |
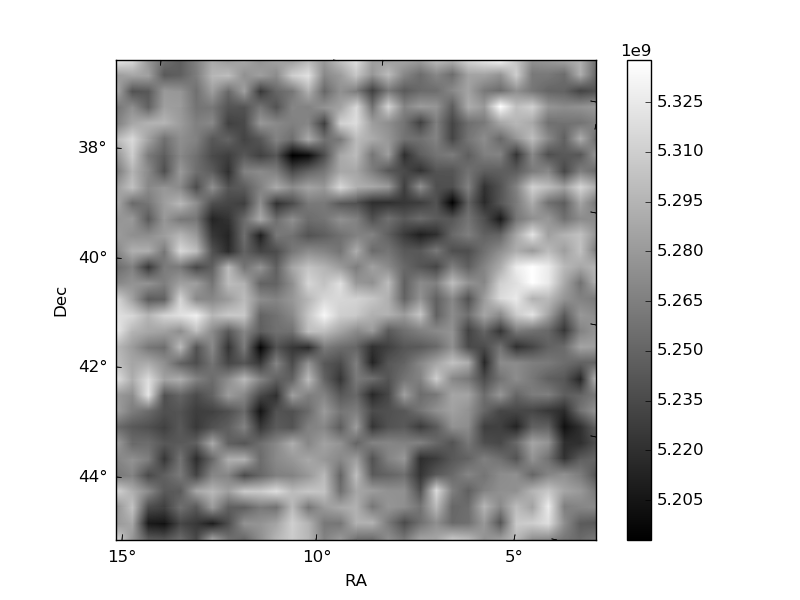
Histogram calculated using DETX and DETY for each event in the final _common_clean file
| Quadrant A |  |
 |
Quadrant B |
|---|---|---|---|
| Quadrant D |  |
 |
Quadrant C |
| Plot type | Count rate plots | Images |
|---|---|---|
| Comparison with Poisson distribution Blue bars denote a histogram of data divided into 1 sec bins. Red curve is a Poisson curve with rate = median count rate of data. |
 |
 |
| Quadrant-wise count rates Data is divided into 100 sec bins |
 |
|
| Module-wise count rates for Quadrant A Data is divided into 100 sec bins |
 |
 |
| Module-wise count rates for Quadrant B Data is divided into 100 sec bins |
 |
 |
| Module-wise count rates for Quadrant C Data is divided into 100 sec bins |
 |
 |
| Module-wise count rates for Quadrant D Data is divided into 100 sec bins |
 |
 |
| Parameter | Plot |
|---|---|
| CZT HV Monitor | 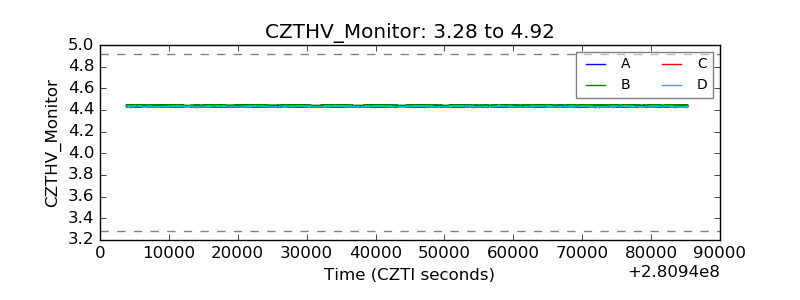 |
| D_VDD |  |
| Temperature 1 |  |
| Veto HV Monitor |  |
| Veto LLD | 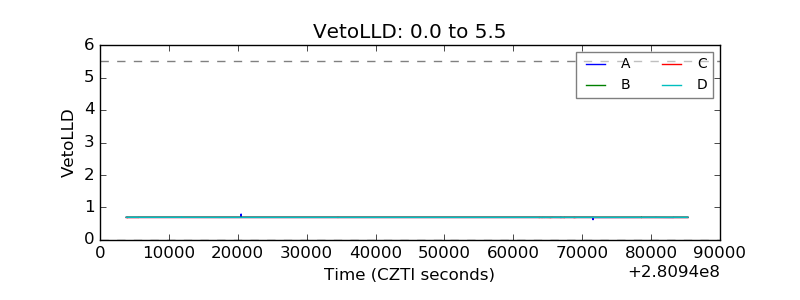 |
| Alpha Counter |  |
| _CPM_Rate |  |
| CZT Counter | 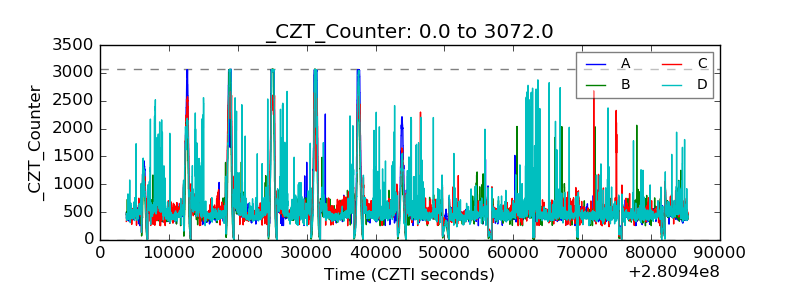 |
| +2.5 Volts monitor |  |
| +5 Volts monitor |  |
| _ROLL_ROT |  |
| _Roll_DEC |  |
| _Roll_RA | 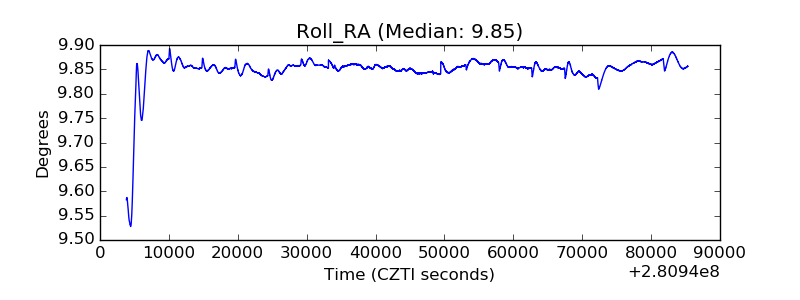 |
| Veto Counter |  |