| Param | Original file | Final file |
|---|---|---|
| Filename | modeM0/AS1A05_004T03_9000002538_17103cztM0_level2.evt | modeM0/AS1A05_004T03_9000002538_17103cztM0_level2_quad_clean.evt |
| Size (bytes) | 262,160,640 | 37,889,280 |
| Size | 250.0 MB | 36.1 MB |
| Events in quadrant A | 1,723,582 | 228,011 |
| Events in quadrant B | 1,808,414 | 230,249 |
| Events in quadrant C | 1,779,212 | 221,057 |
| Events in quadrant D | 2,380,223 | 210,841 |
| Mode SS | |||
|---|---|---|---|
| Quadrant | BADHDUFLAG | Total packets | Discarded packets |
| A | 0 | 74 | 0 |
| B | 0 | 74 | 0 |
| C | 0 | 74 | 0 |
| D | 0 | 74 | 0 |
| Mode M0 | |||
|---|---|---|---|
| Quadrant | BADHDUFLAG | Total packets | Discarded packets |
| A | 0 | 7484 | 1 |
| B | 0 | 7653 | 1 |
| C | 0 | 7490 | 2 |
| D | 0 | 9483 | 1 |
| Mode M9 | |||
|---|---|---|---|
| Quadrant | BADHDUFLAG | Total packets | Discarded packets |
| A | 0 | 9 | 0 |
| B | 0 | 9 | 0 |
| C | 0 | 9 | 0 |
| D | 0 | 9 | 0 |
| Quadrant | Total seconds | Saturated seconds | Saturation percentage |
|---|---|---|---|
| A | 3629 | 39 | 1.074676% |
| B | 3629 | 45 | 1.240011% |
| C | 3628 | 60 | 1.653804% |
| D | 3628 | 159 | 4.382580% |
Noise dominated data is calculated using 1-second bins in cleaned event files. If a bin has >2000 counts, and if more than 50% of those come from <1% of pixels, then it is considered to be noise-dominated and hence unusable.
| Quadrant | # 1 sec bins | Bins with >0 counts | Bins with >2000 counts | High rate bins dominated by noise | Noise dominated (total time) | Noise dominated (detector-on time) | Marked lightcurve |
|---|---|---|---|---|---|---|---|
| A | 4534 | 3630 | 0 | 0 | 0.00% | 0.00% | 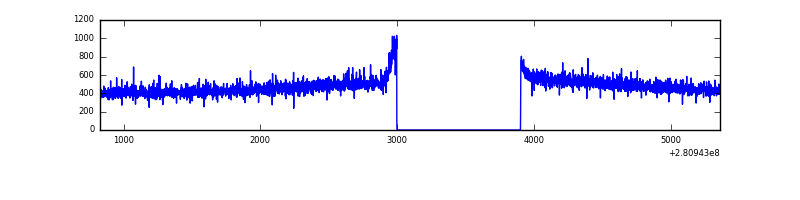 |
| B | 4534 | 3630 | 3 | 3 | 0.07% | 0.08% | 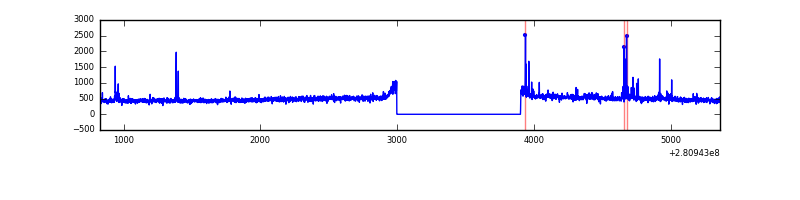 |
| C | 4533 | 3629 | 0 | 0 | 0.00% | 0.00% | 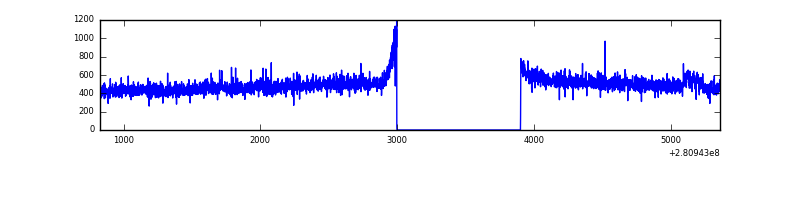 |
| D | 4533 | 3629 | 103 | 103 | 2.27% | 2.84% | 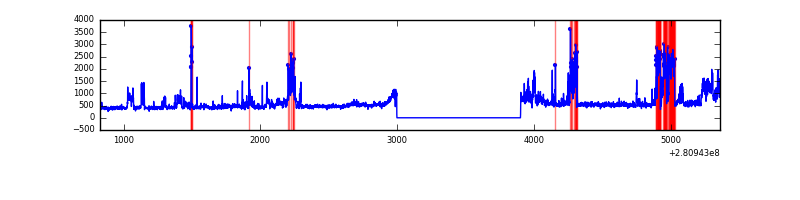 |
Top three noisy pixels from each quadrant. If the there are fewer than three noisy pixels in the level2.evt file, extra rows are filled as -1
| Pixel properties | Quadrant properties | ||||||
|---|---|---|---|---|---|---|---|
| Quadrant | DetID | PixID | Counts | Sigma | Mean | Median | Sigma |
| A | 0 | 226 | 3993 | 38.35 | 447 | 437 | 92.7 |
| A | 12 | 194 | 3428 | 32.26 | 447 | 437 | 92.7 |
| A | 4 | 2 | 3370 | 31.63 | 447 | 437 | 92.7 |
| B | 0 | 197 | 21767 | 244.39 | 446 | 434 | 87.3 |
| B | 12 | 111 | 10082 | 110.53 | 446 | 434 | 87.3 |
| B | 0 | 244 | 9533 | 104.24 | 446 | 434 | 87.3 |
| C | 14 | 238 | 64631 | 625.83 | 430 | 432 | 102.6 |
| C | 3 | 233 | 35503 | 341.88 | 430 | 432 | 102.6 |
| C | 13 | 61 | 3114 | 26.14 | 430 | 432 | 102.6 |
| D | 5 | 222 | 410219 | 3839.9 | 432 | 420 | 106.7 |
| D | 15 | 0 | 209219 | 1956.49 | 432 | 420 | 106.7 |
| D | 10 | 70 | 87501 | 815.97 | 432 | 420 | 106.7 |
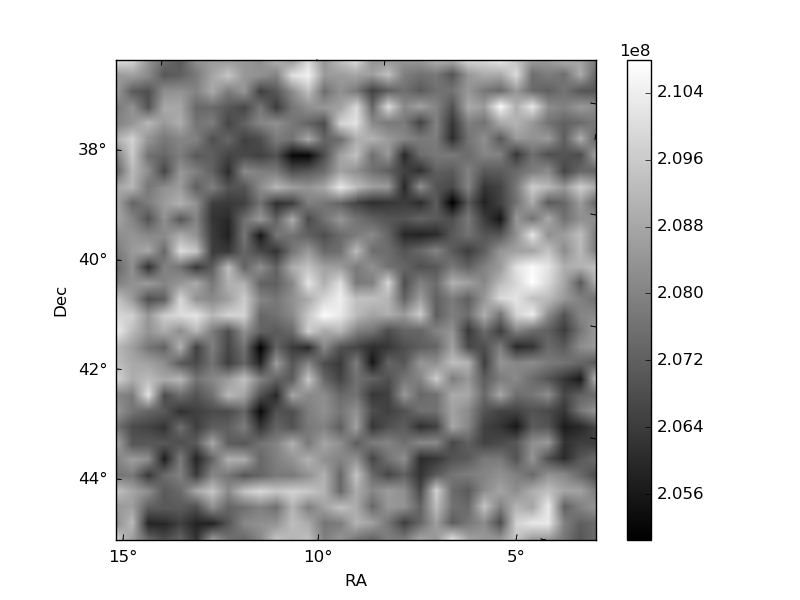
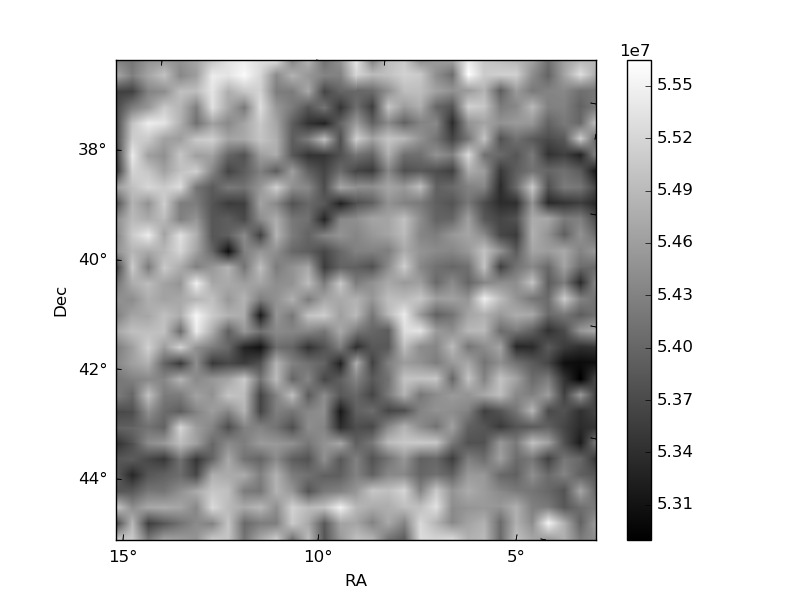
Histogram calculated using DETX and DETY for each event in the final _common_clean file
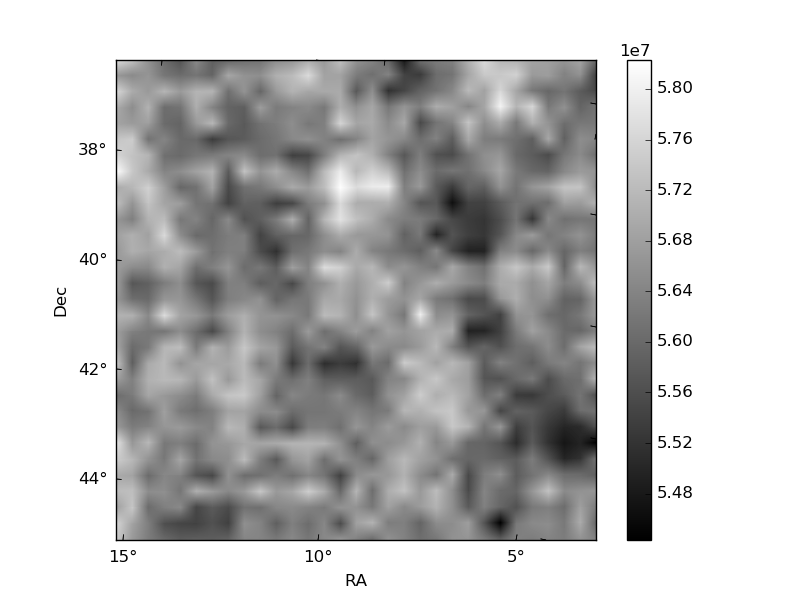
| Quadrant A | 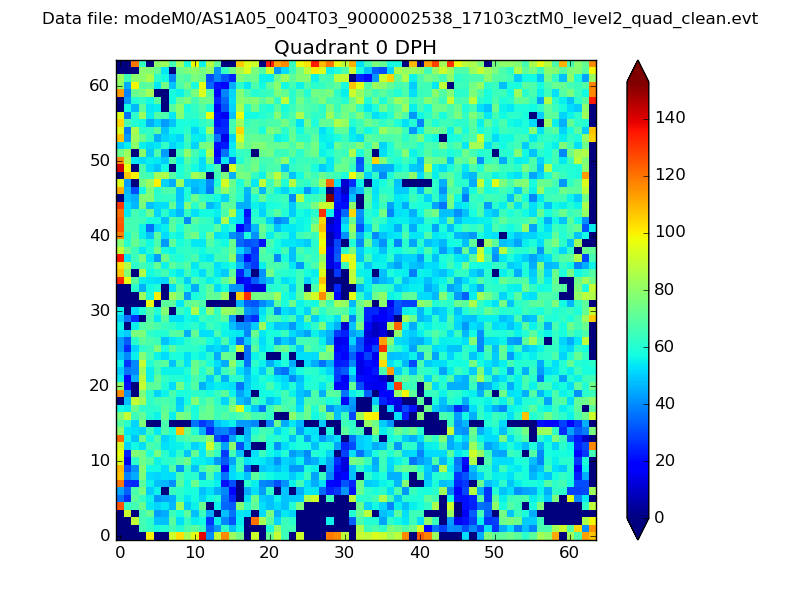 |
 |
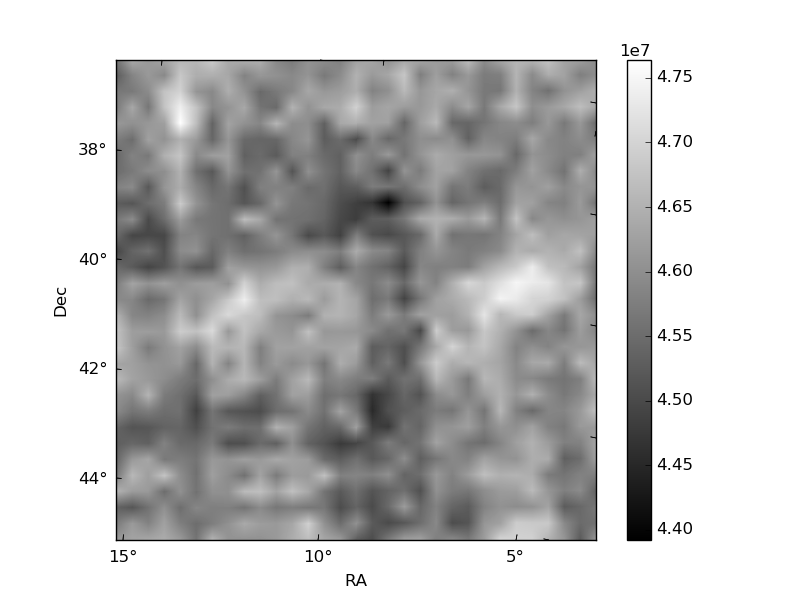
Quadrant B |
|---|---|---|---|
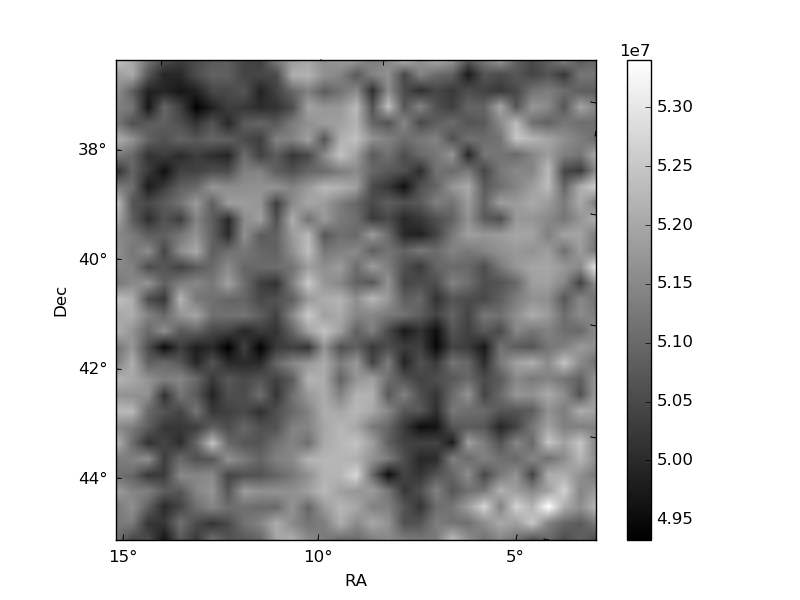
| Quadrant D | 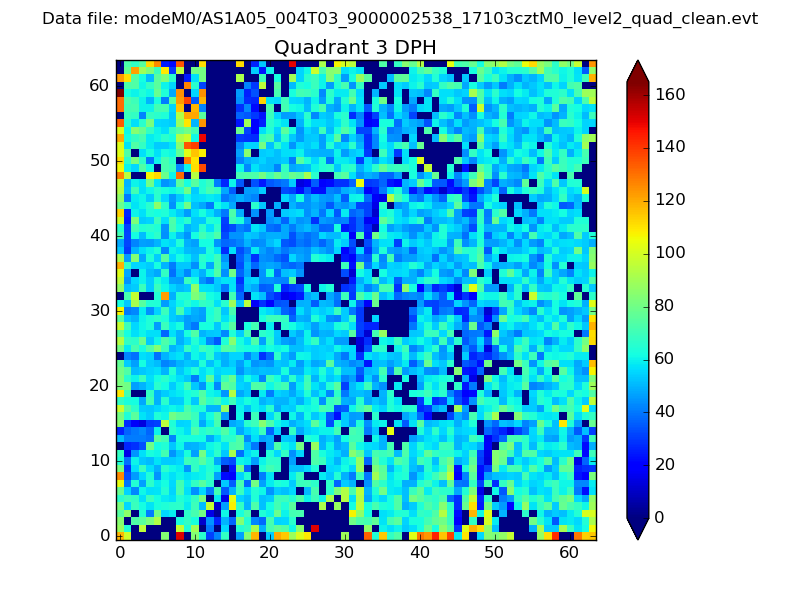 |
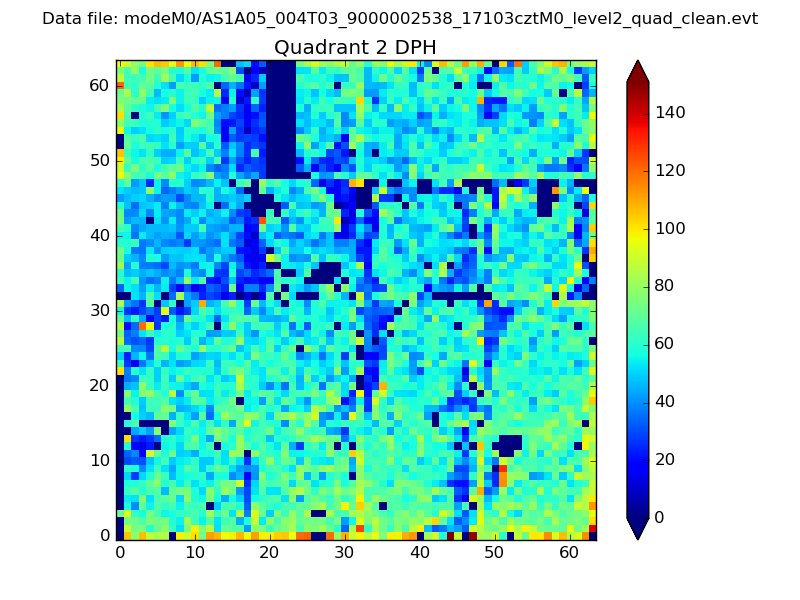 |
Quadrant C |
| Plot type | Count rate plots | Images |
|---|---|---|
| Comparison with Poisson distribution Blue bars denote a histogram of data divided into 1 sec bins. Red curve is a Poisson curve with rate = median count rate of data. |
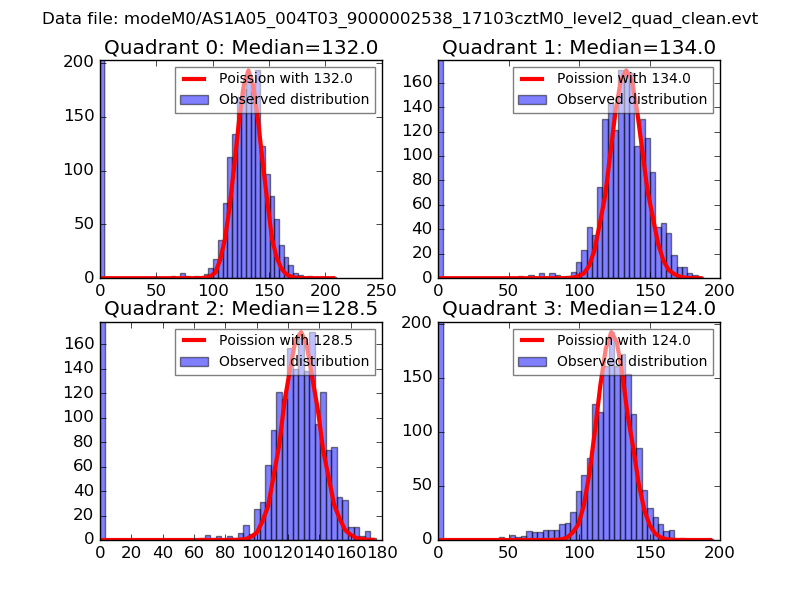 |
 |
| Quadrant-wise count rates Data is divided into 100 sec bins |
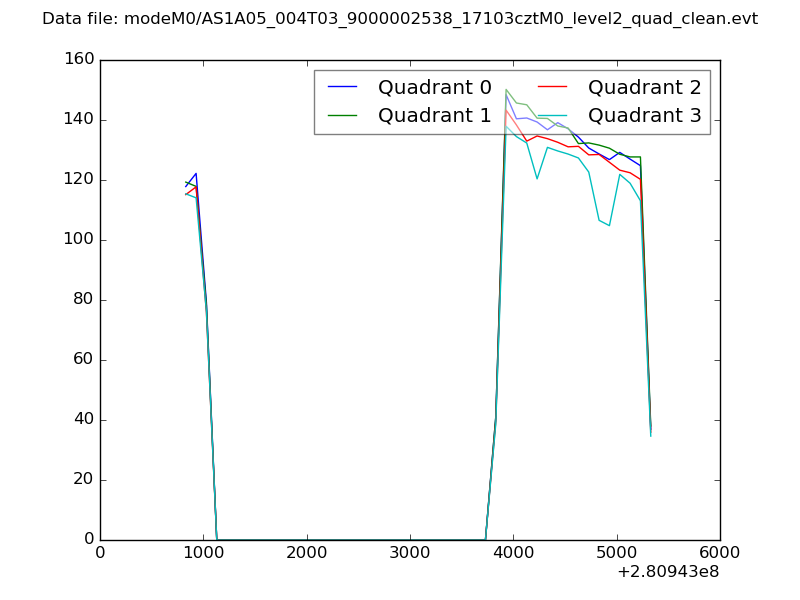 |
|
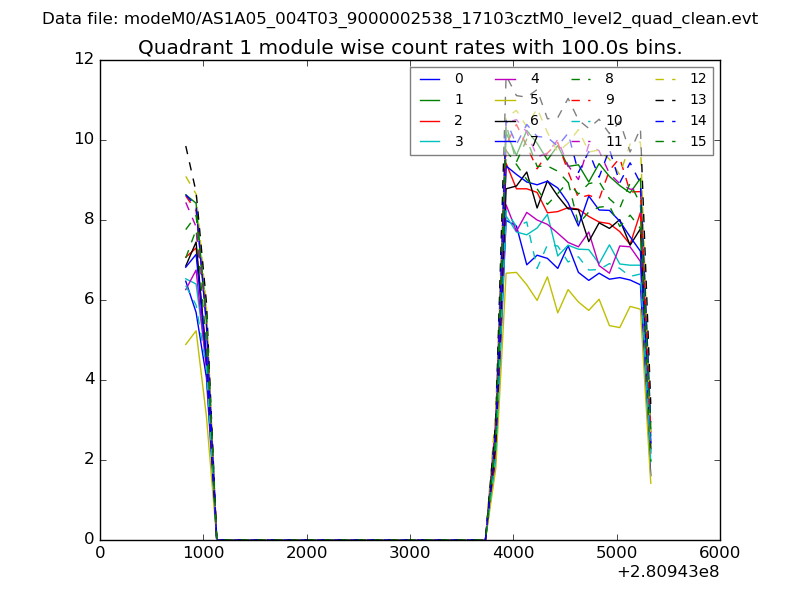
| Module-wise count rates for Quadrant A Data is divided into 100 sec bins |
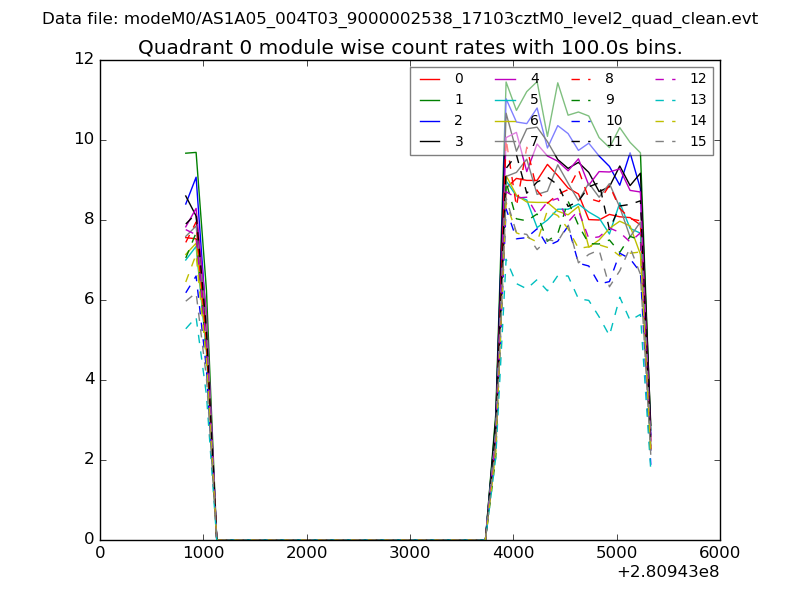 |
 |
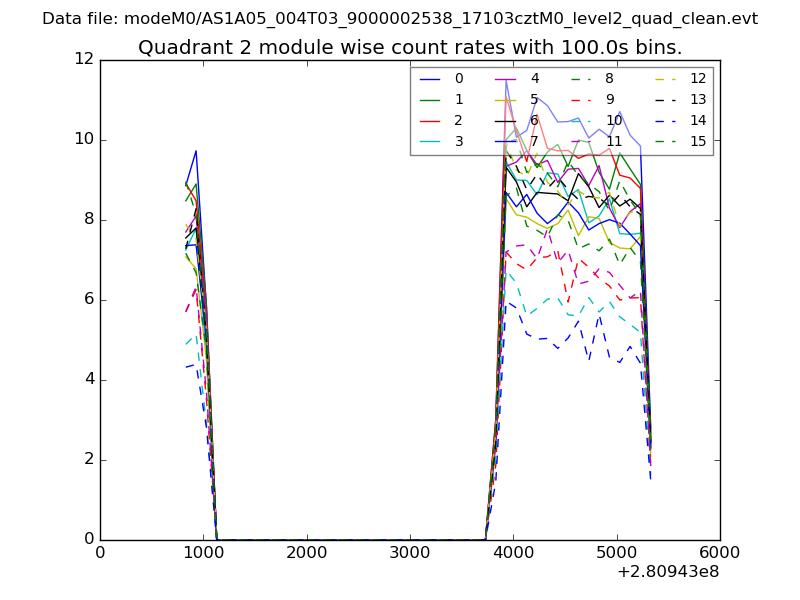
| Module-wise count rates for Quadrant B Data is divided into 100 sec bins |
 |
 |
| Module-wise count rates for Quadrant C Data is divided into 100 sec bins |
 |
 |
| Module-wise count rates for Quadrant D Data is divided into 100 sec bins |
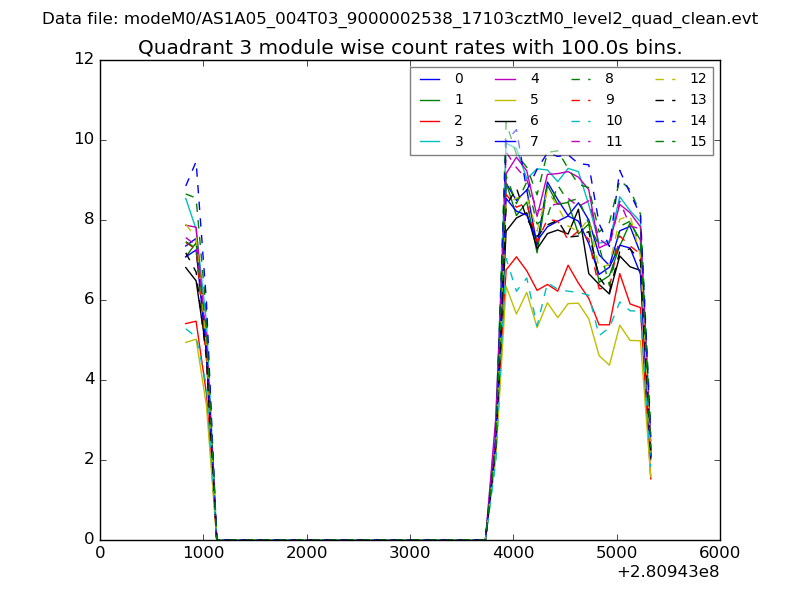 |
 |
| Parameter | Plot |
|---|---|
| CZT HV Monitor | 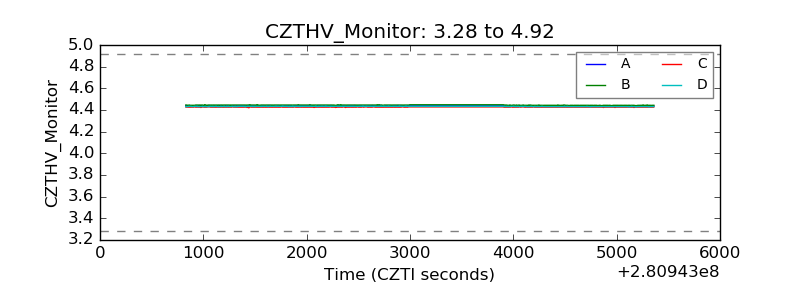 |
| D_VDD | 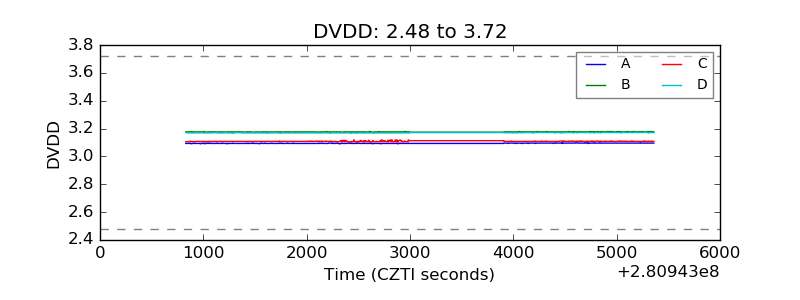 |
| Temperature 1 | 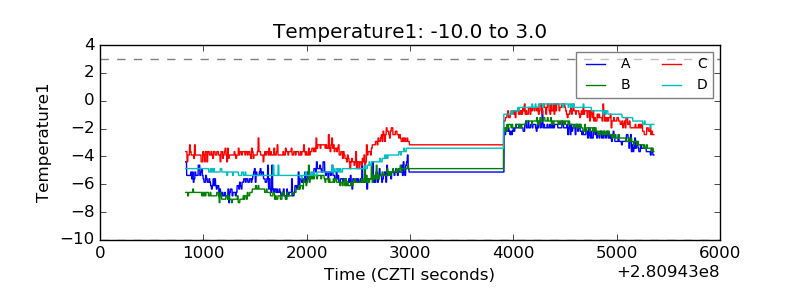 |
| Veto HV Monitor | 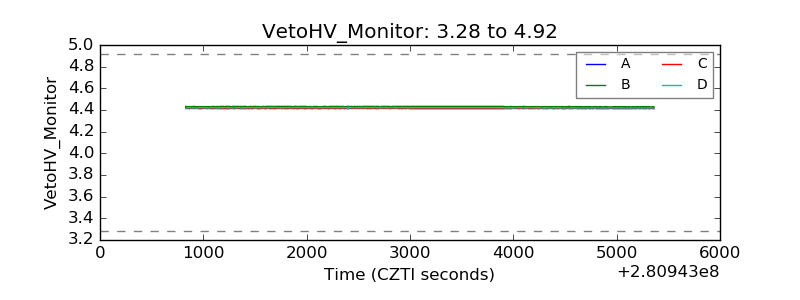 |
| Veto LLD | 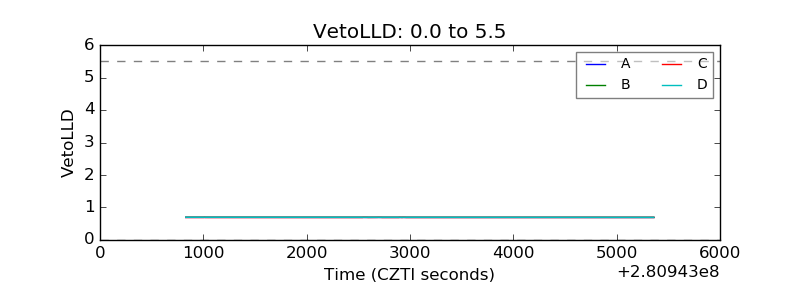 |
| Alpha Counter | 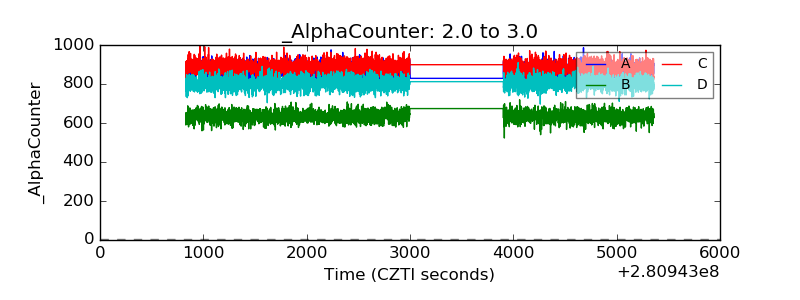 |
| _CPM_Rate | 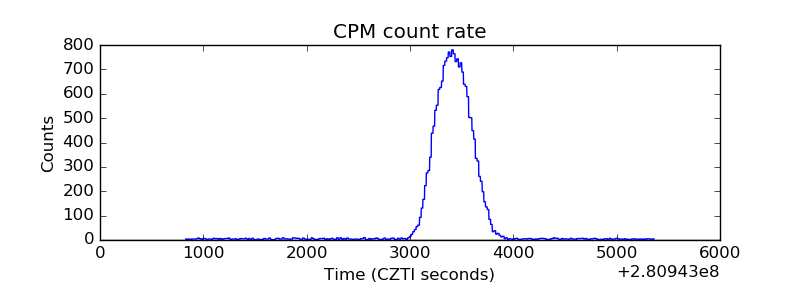 |
| CZT Counter |  |
| +2.5 Volts monitor |  |
| +5 Volts monitor | 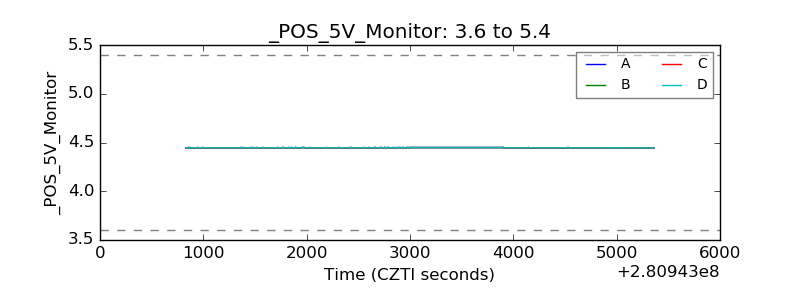 |
| _ROLL_ROT | 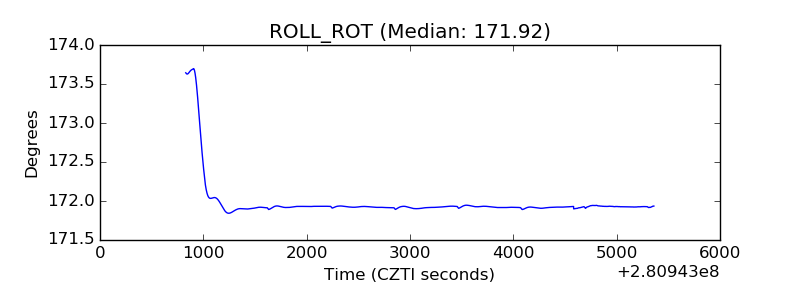 |
| _Roll_DEC | 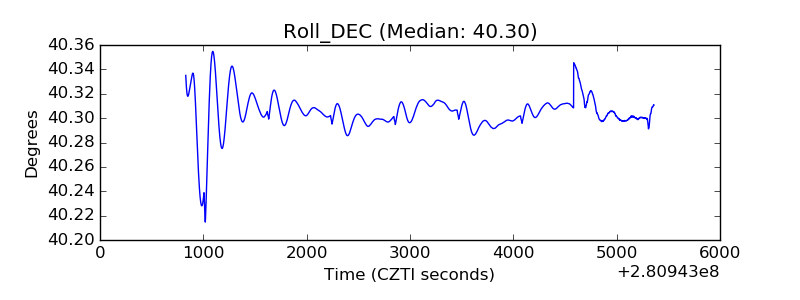 |
| _Roll_RA | 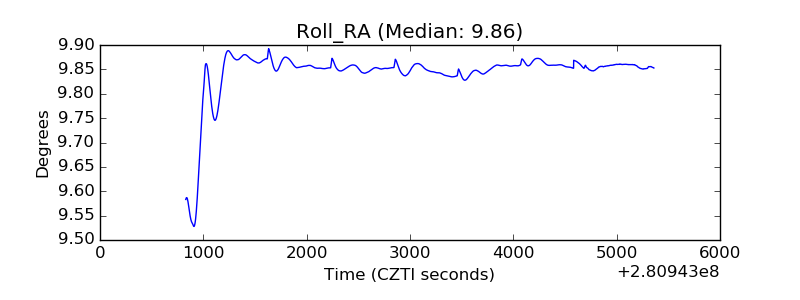 |
| Veto Counter | 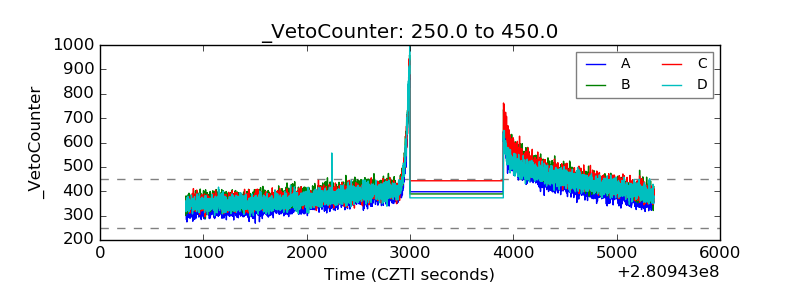 |