| Param | Original file | Final file |
|---|---|---|
| Filename | modeM0/AS1A05_004T03_9000002538_17104cztM0_level2.evt | modeM0/AS1A05_004T03_9000002538_17104cztM0_level2_quad_clean.evt |
| Size (bytes) | 638,544,960 | 104,160,960 |
| Size | 609.0 MB | 99.3 MB |
| Events in quadrant A | 4,105,604 | 652,193 |
| Events in quadrant B | 4,293,922 | 655,328 |
| Events in quadrant C | 4,453,520 | 628,467 |
| Events in quadrant D | 5,886,056 | 604,625 |
| Mode SS | |||
|---|---|---|---|
| Quadrant | BADHDUFLAG | Total packets | Discarded packets |
| A | 0 | 182 | 0 |
| B | 0 | 182 | 0 |
| C | 0 | 182 | 0 |
| D | 0 | 182 | 0 |
| Mode M0 | |||
|---|---|---|---|
| Quadrant | BADHDUFLAG | Total packets | Discarded packets |
| A | 0 | 18243 | 2 |
| B | 0 | 18531 | 2 |
| C | 0 | 18657 | 4 |
| D | 0 | 23526 | 2 |
| Mode M9 | |||
|---|---|---|---|
| Quadrant | BADHDUFLAG | Total packets | Discarded packets |
| A | 0 | 19 | 0 |
| B | 0 | 19 | 0 |
| C | 0 | 19 | 0 |
| D | 0 | 19 | 0 |
| Quadrant | Total seconds | Saturated seconds | Saturation percentage |
|---|---|---|---|
| A | 8838 | 76 | 0.859923% |
| B | 8838 | 89 | 1.007015% |
| C | 8836 | 118 | 1.335446% |
| D | 8837 | 302 | 3.417449% |
Noise dominated data is calculated using 1-second bins in cleaned event files. If a bin has >2000 counts, and if more than 50% of those come from <1% of pixels, then it is considered to be noise-dominated and hence unusable.
| Quadrant | # 1 sec bins | Bins with >0 counts | Bins with >2000 counts | High rate bins dominated by noise | Noise dominated (total time) | Noise dominated (detector-on time) | Marked lightcurve |
|---|---|---|---|---|---|---|---|
| A | 10788 | 8840 | 0 | 0 | 0.00% | 0.00% | 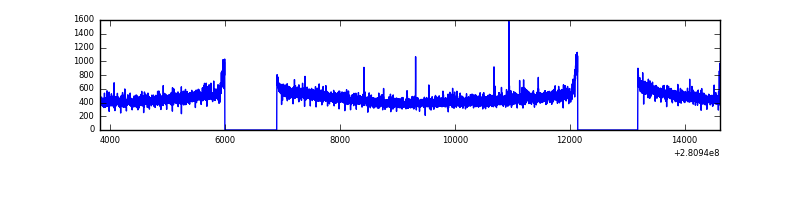 |
| B | 10788 | 8839 | 5 | 5 | 0.05% | 0.06% | 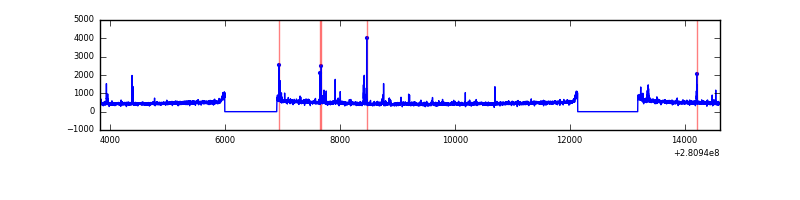 |
| C | 10787 | 8838 | 0 | 0 | 0.00% | 0.00% | 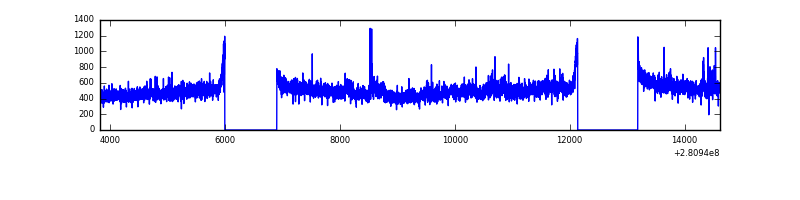 |
| D | 10787 | 8838 | 203 | 203 | 1.88% | 2.30% | 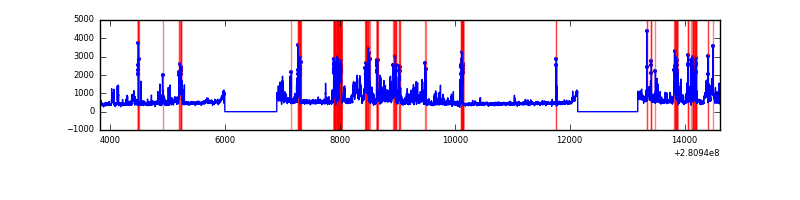 |
Top three noisy pixels from each quadrant. If the there are fewer than three noisy pixels in the level2.evt file, extra rows are filled as -1
| Pixel properties | Quadrant properties | ||||||
|---|---|---|---|---|---|---|---|
| Quadrant | DetID | PixID | Counts | Sigma | Mean | Median | Sigma |
| A | 4 | 2 | 13914 | 59.71 | 1063 | 1038 | 215.6 |
| A | 0 | 226 | 9397 | 38.76 | 1063 | 1038 | 215.6 |
| A | 12 | 189 | 8042 | 32.48 | 1063 | 1038 | 215.6 |
| B | 0 | 197 | 72632 | 352.7 | 1061 | 1036 | 203.0 |
| B | 12 | 111 | 23375 | 110.05 | 1061 | 1036 | 203.0 |
| B | 11 | 111 | 20313 | 94.96 | 1061 | 1036 | 203.0 |
| C | 3 | 233 | 271320 | 1125.14 | 1024 | 1030 | 240.2 |
| C | 14 | 238 | 155350 | 642.39 | 1024 | 1030 | 240.2 |
| C | 9 | 54 | 20128 | 79.5 | 1024 | 1030 | 240.2 |
| D | 5 | 222 | 1301190 | 5191.26 | 1029 | 998 | 250.5 |
| D | 15 | 0 | 244712 | 973.07 | 1029 | 998 | 250.5 |
| D | 10 | 70 | 182370 | 724.16 | 1029 | 998 | 250.5 |
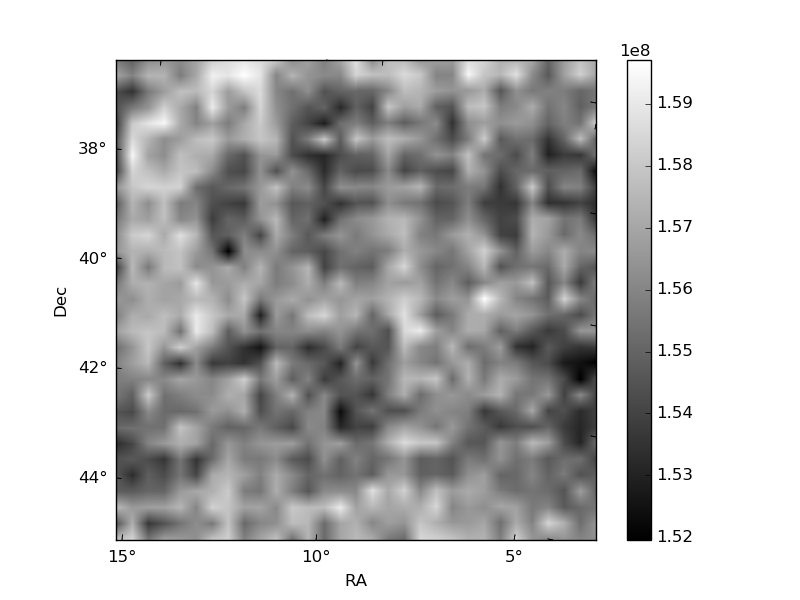
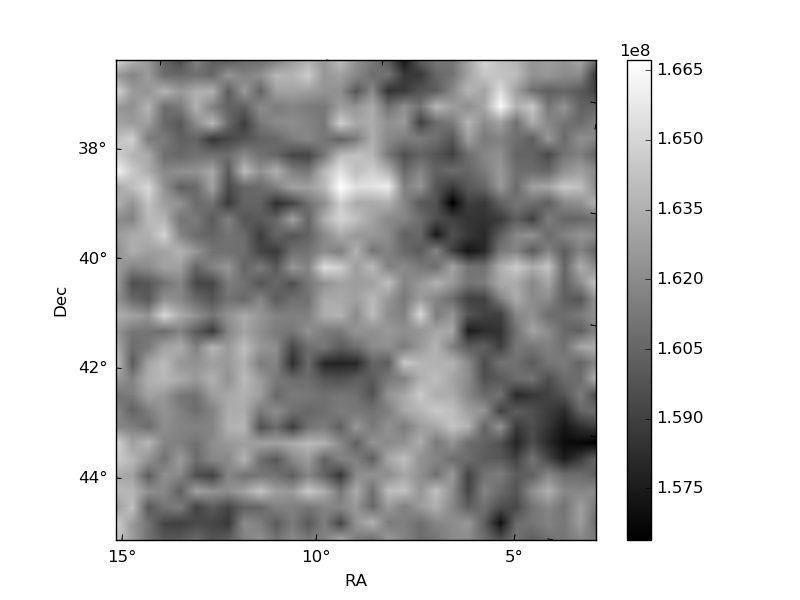
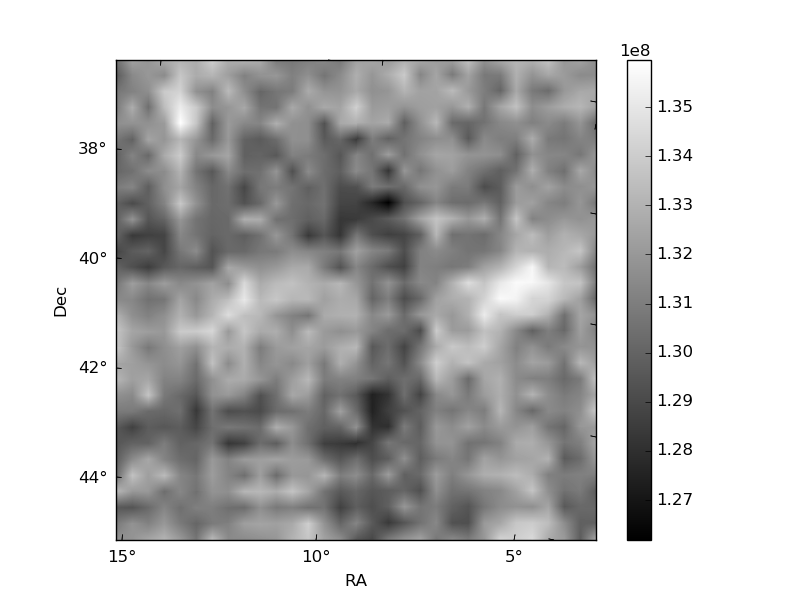
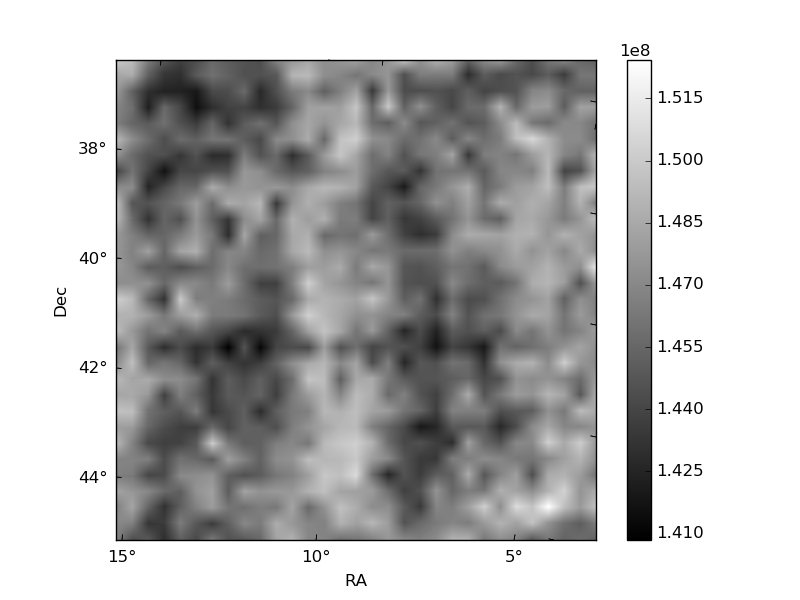
Histogram calculated using DETX and DETY for each event in the final _common_clean file
| Quadrant A | 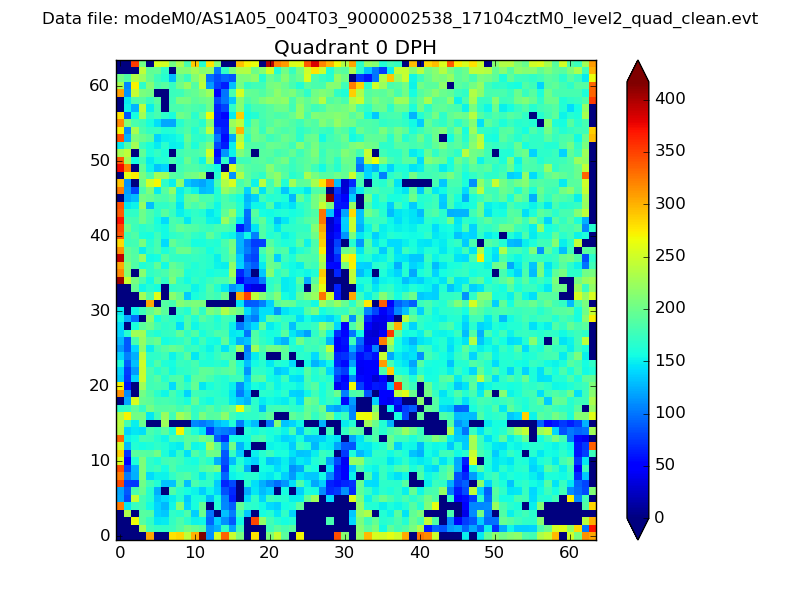 |
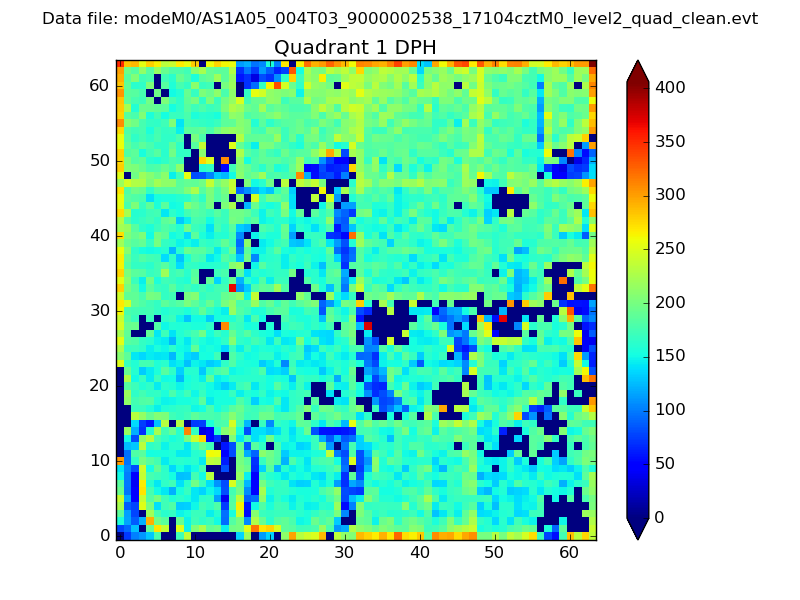 |
Quadrant B |
|---|---|---|---|
| Quadrant D |  |
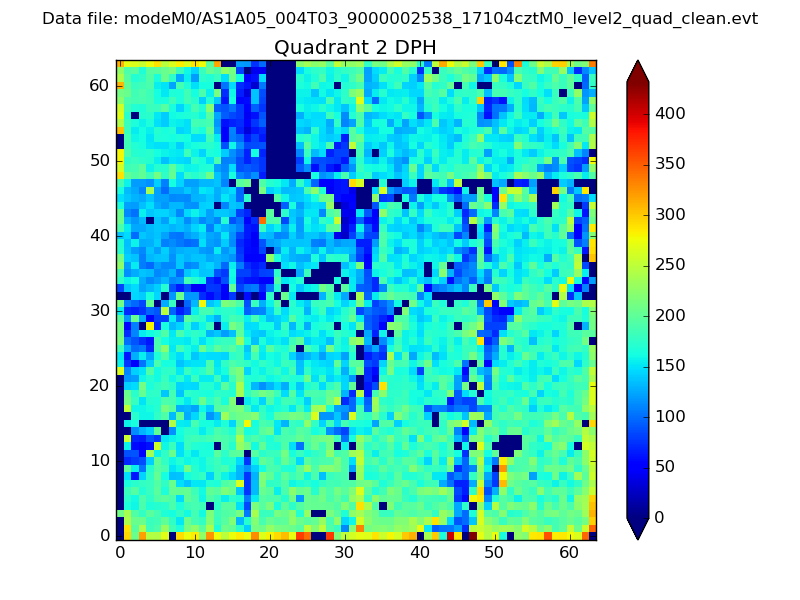 |
Quadrant C |
| Plot type | Count rate plots | Images |
|---|---|---|
| Comparison with Poisson distribution Blue bars denote a histogram of data divided into 1 sec bins. Red curve is a Poisson curve with rate = median count rate of data. |
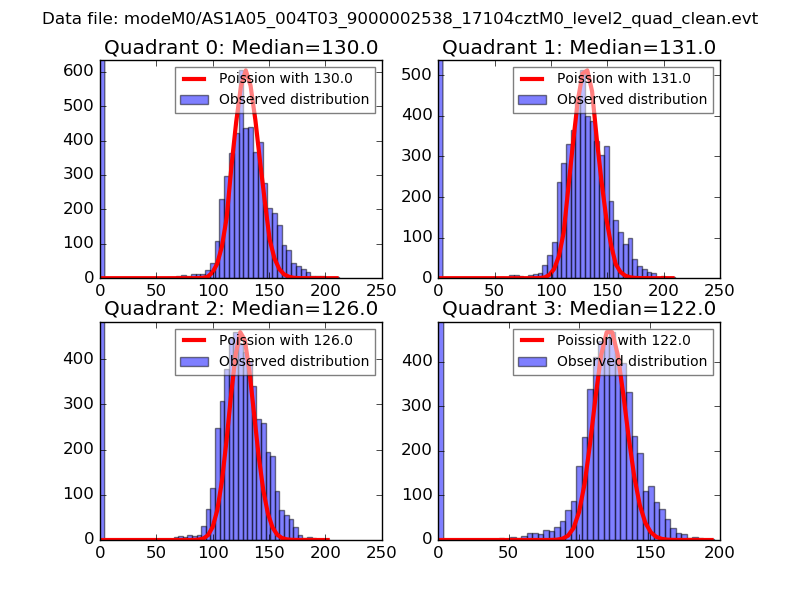 |
 |
| Quadrant-wise count rates Data is divided into 100 sec bins |
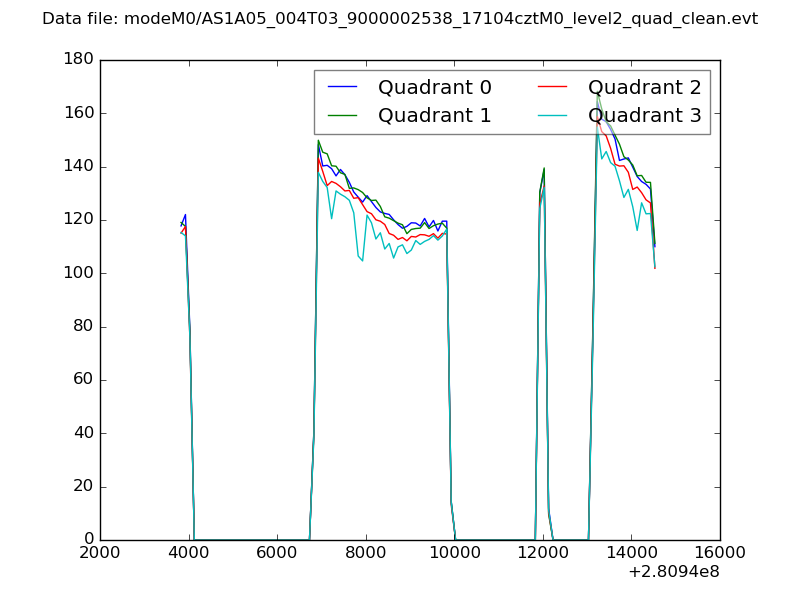 |
|
| Module-wise count rates for Quadrant A Data is divided into 100 sec bins |
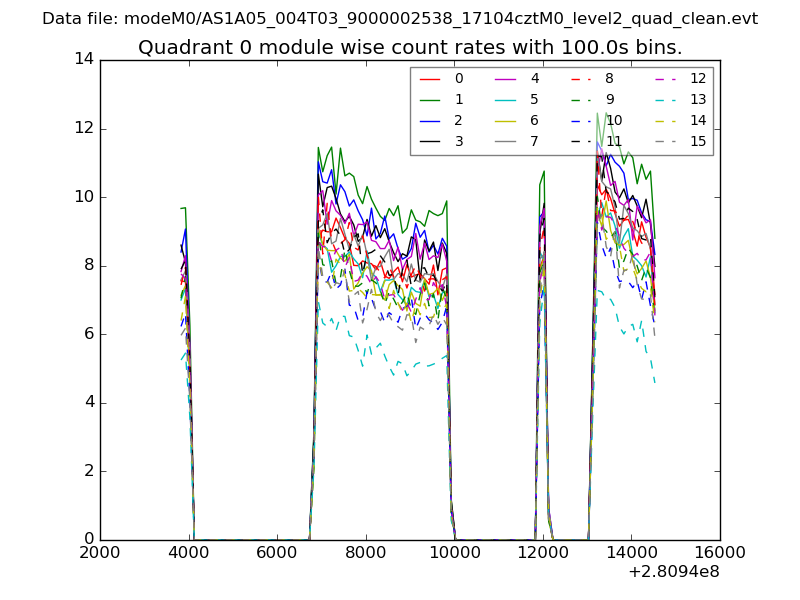 |
 |
| Module-wise count rates for Quadrant B Data is divided into 100 sec bins |
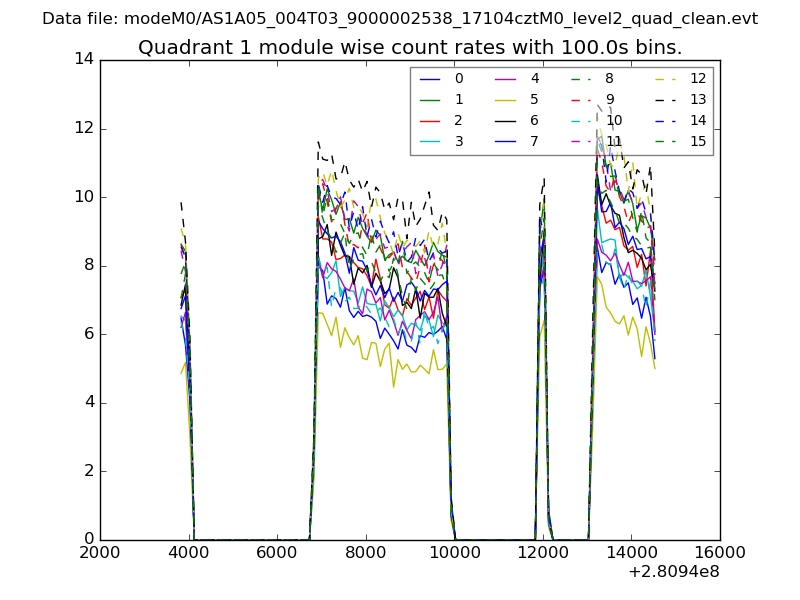 |
 |
| Module-wise count rates for Quadrant C Data is divided into 100 sec bins |
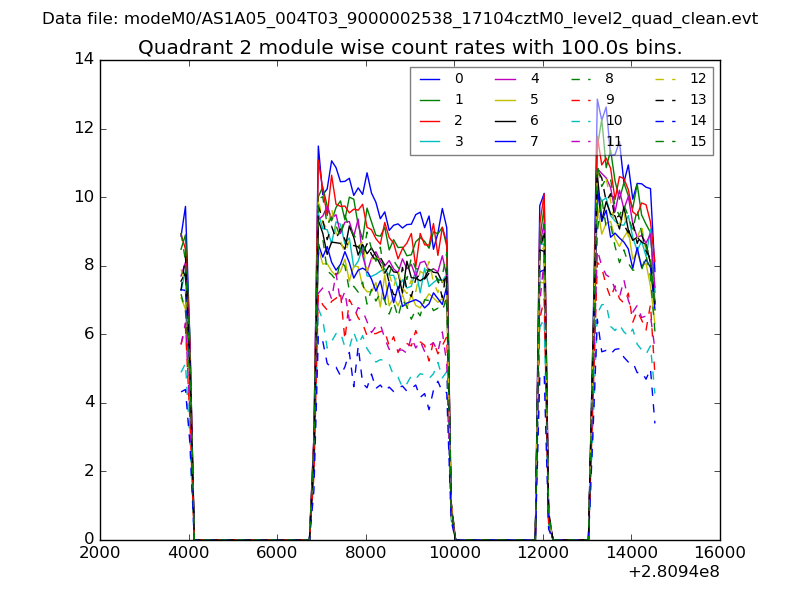 |
 |
| Module-wise count rates for Quadrant D Data is divided into 100 sec bins |
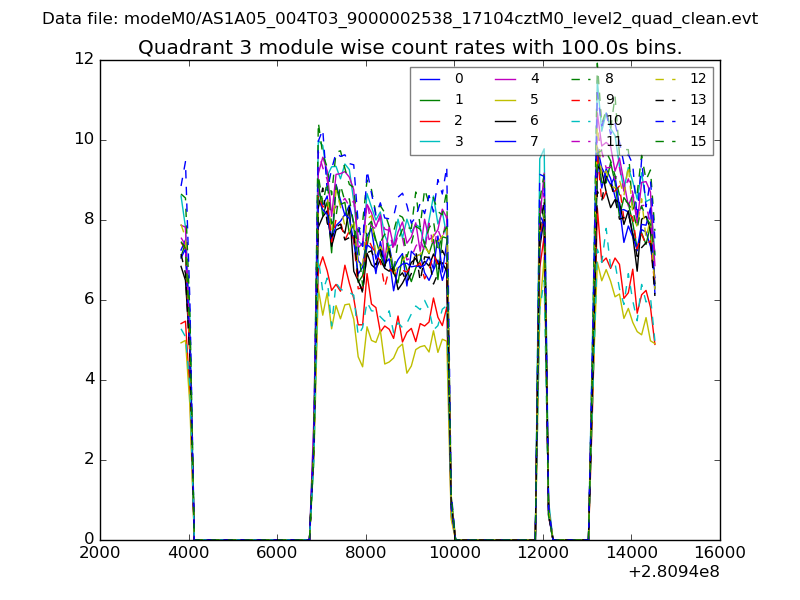 |
 |
| Parameter | Plot |
|---|---|
| CZT HV Monitor | 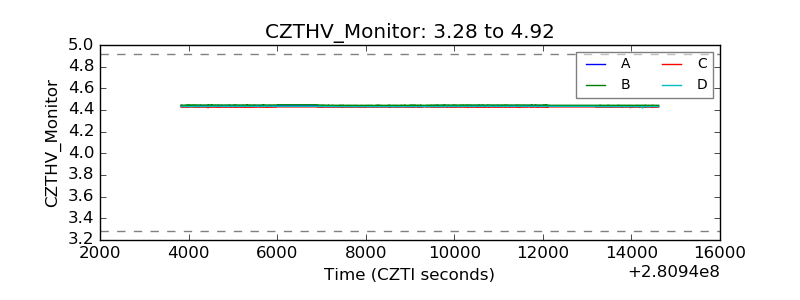 |
| D_VDD |  |
| Temperature 1 | 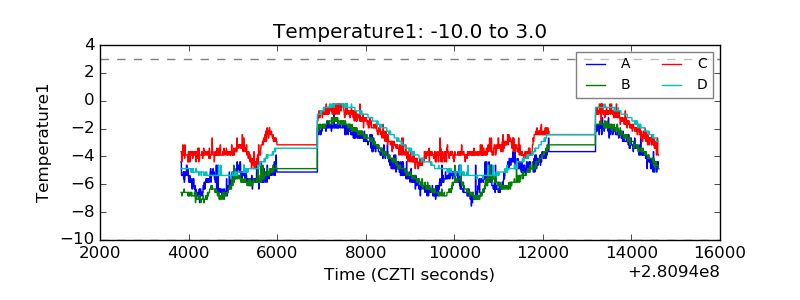 |
| Veto HV Monitor | 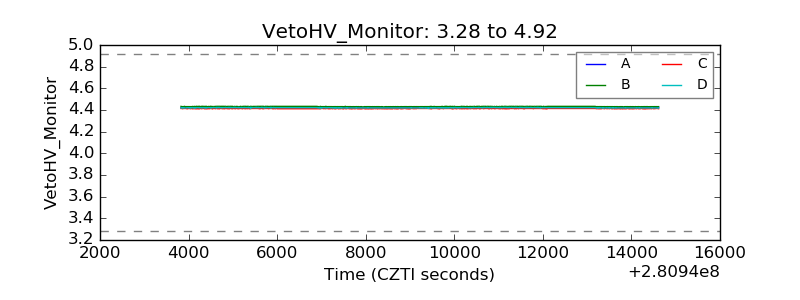 |
| Veto LLD | 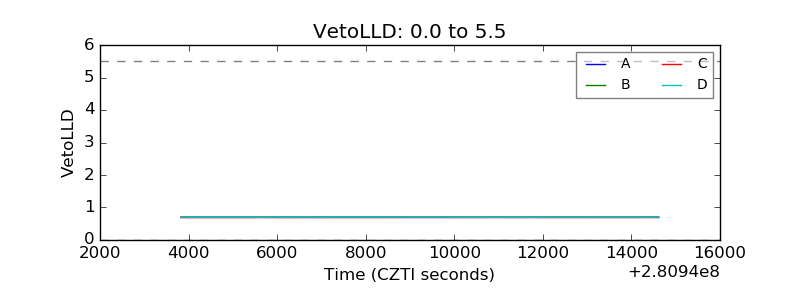 |
| Alpha Counter | 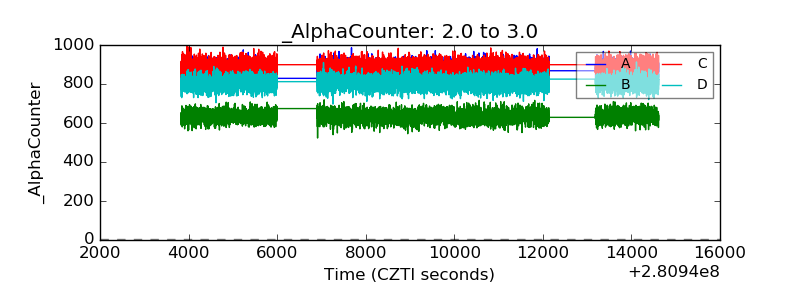 |
| _CPM_Rate | 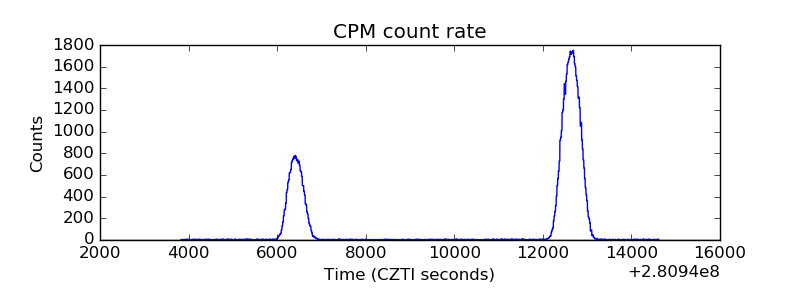 |
| CZT Counter | 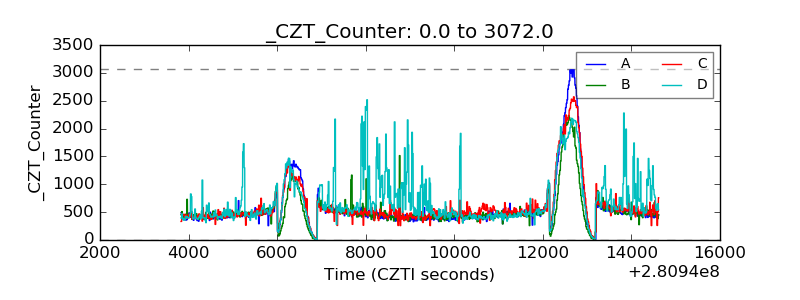 |
| +2.5 Volts monitor |  |
| +5 Volts monitor | 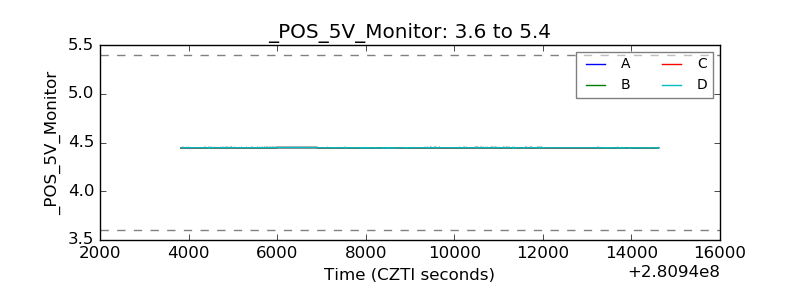 |
| _ROLL_ROT | 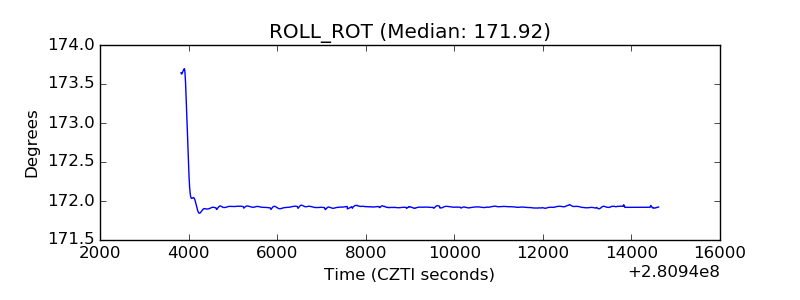 |
| _Roll_DEC | 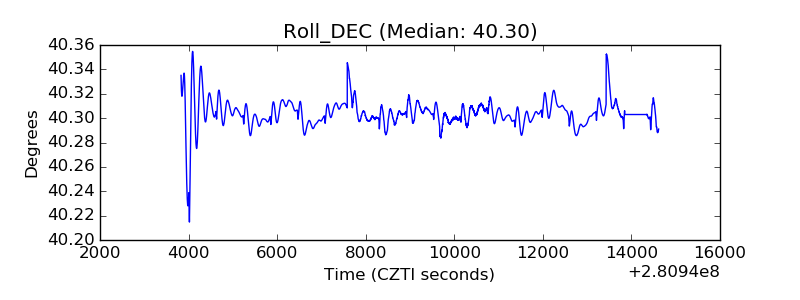 |
| _Roll_RA |  |
| Veto Counter | 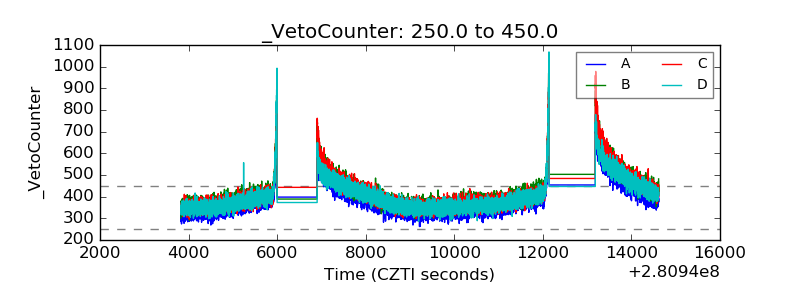 |