| Param | Original file | Final file |
|---|---|---|
| Filename | modeM0/AS1A05_004T03_9000002538_17106cztM0_level2.evt | modeM0/AS1A05_004T03_9000002538_17106cztM0_level2_quad_clean.evt |
| Size (bytes) | 478,632,960 | 95,362,560 |
| Size | 456.5 MB | 90.9 MB |
| Events in quadrant A | 3,077,058 | 626,000 |
| Events in quadrant B | 3,230,462 | 634,468 |
| Events in quadrant C | 3,440,974 | 605,355 |
| Events in quadrant D | 4,311,417 | 574,548 |
| Mode SS | |||
|---|---|---|---|
| Quadrant | BADHDUFLAG | Total packets | Discarded packets |
| A | 0 | 130 | 0 |
| B | 0 | 130 | 0 |
| C | 0 | 130 | 0 |
| D | 0 | 130 | 0 |
| Mode M0 | |||
|---|---|---|---|
| Quadrant | BADHDUFLAG | Total packets | Discarded packets |
| A | 0 | 13445 | 2 |
| B | 0 | 13798 | 2 |
| C | 0 | 14254 | 2 |
| D | 0 | 17157 | 2 |
| Mode M9 | |||
|---|---|---|---|
| Quadrant | BADHDUFLAG | Total packets | Discarded packets |
| A | 0 | 17 | 0 |
| B | 0 | 18 | 0 |
| C | 0 | 18 | 0 |
| D | 0 | 18 | 0 |
| Quadrant | Total seconds | Saturated seconds | Saturation percentage |
|---|---|---|---|
| A | 6418 | 44 | 0.685572% |
| B | 6417 | 50 | 0.779180% |
| C | 6417 | 59 | 0.919433% |
| D | 6417 | 248 | 3.864734% |
Noise dominated data is calculated using 1-second bins in cleaned event files. If a bin has >2000 counts, and if more than 50% of those come from <1% of pixels, then it is considered to be noise-dominated and hence unusable.
| Quadrant | # 1 sec bins | Bins with >0 counts | Bins with >2000 counts | High rate bins dominated by noise | Noise dominated (total time) | Noise dominated (detector-on time) | Marked lightcurve |
|---|---|---|---|---|---|---|---|
| A | 7598 | 6419 | 0 | 0 | 0.00% | 0.00% | 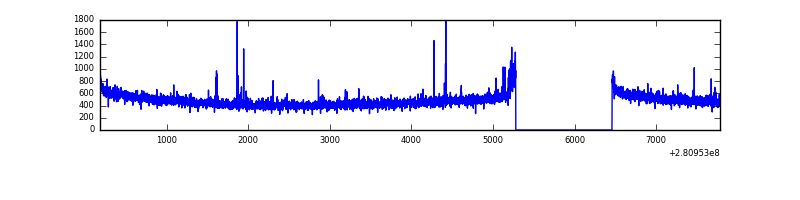 |
| B | 7597 | 6418 | 6 | 6 | 0.08% | 0.09% | 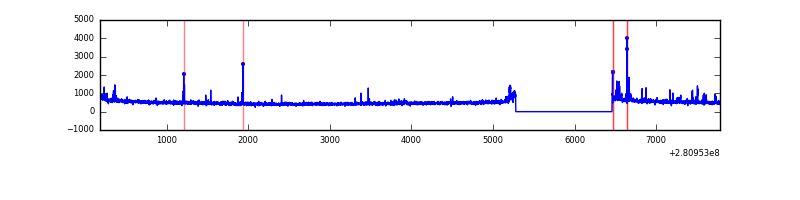 |
| C | 7597 | 6418 | 0 | 0 | 0.00% | 0.00% | 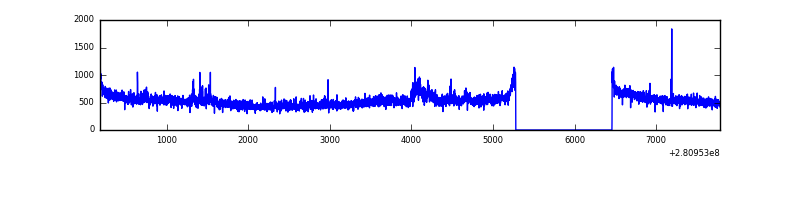 |
| D | 7597 | 6418 | 200 | 200 | 2.63% | 3.12% | 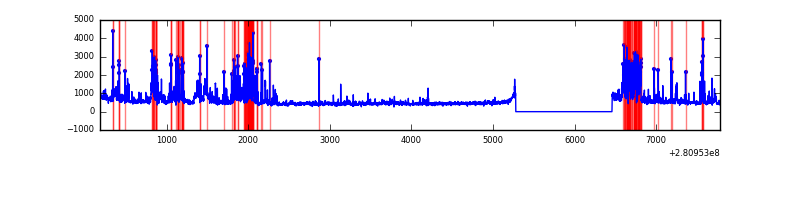 |
Top three noisy pixels from each quadrant. If the there are fewer than three noisy pixels in the level2.evt file, extra rows are filled as -1
| Pixel properties | Quadrant properties | ||||||
|---|---|---|---|---|---|---|---|
| Quadrant | DetID | PixID | Counts | Sigma | Mean | Median | Sigma |
| A | 4 | 2 | 42504 | 262.62 | 787 | 771 | 158.9 |
| A | 0 | 226 | 7028 | 39.37 | 787 | 771 | 158.9 |
| A | 12 | 194 | 5813 | 31.73 | 787 | 771 | 158.9 |
| B | 0 | 197 | 55158 | 367.67 | 790 | 771 | 147.9 |
| B | 0 | 189 | 39247 | 260.1 | 790 | 771 | 147.9 |
| B | 4 | 142 | 16905 | 109.07 | 790 | 771 | 147.9 |
| C | 3 | 233 | 313832 | 1768.58 | 763 | 770 | 177.0 |
| C | 14 | 238 | 117293 | 658.27 | 763 | 770 | 177.0 |
| C | 9 | 54 | 25573 | 140.12 | 763 | 770 | 177.0 |
| D | 5 | 222 | 1078632 | 5903.4 | 760 | 740 | 182.6 |
| D | 12 | 110 | 115621 | 629.18 | 760 | 740 | 182.6 |
| D | 7 | 38 | 81484 | 442.22 | 760 | 740 | 182.6 |
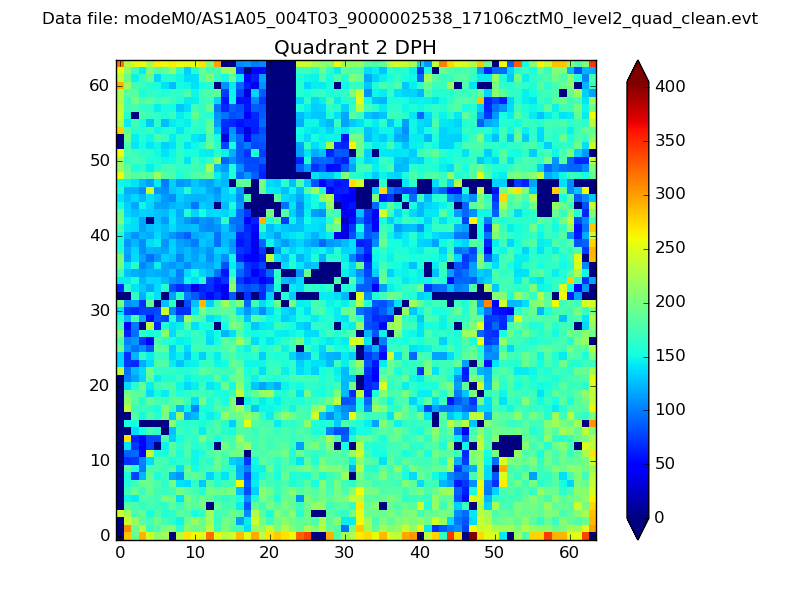
Histogram calculated using DETX and DETY for each event in the final _common_clean file
| Quadrant A | 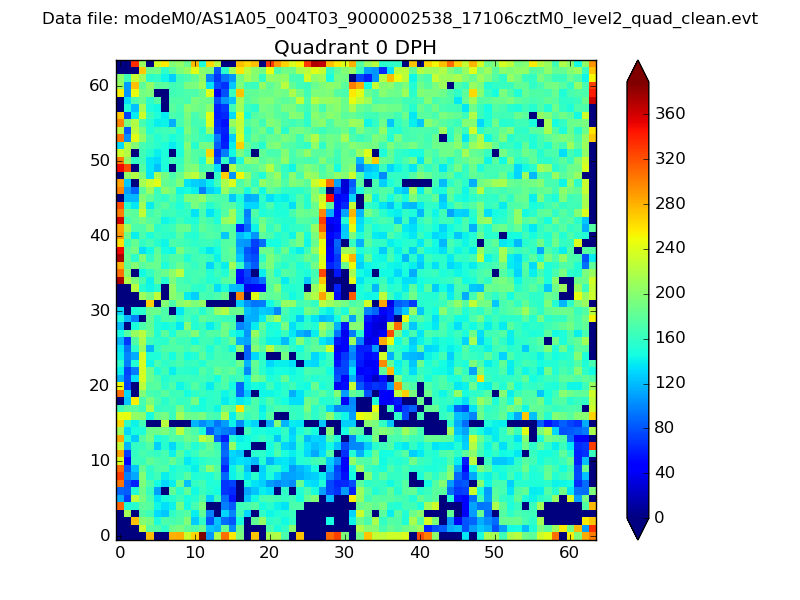 |
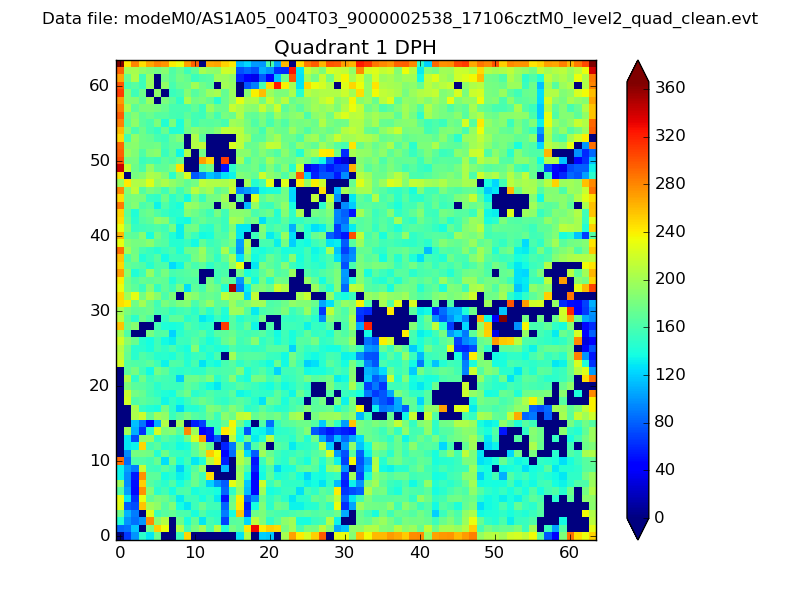 |
Quadrant B |
|---|---|---|---|
| Quadrant D | 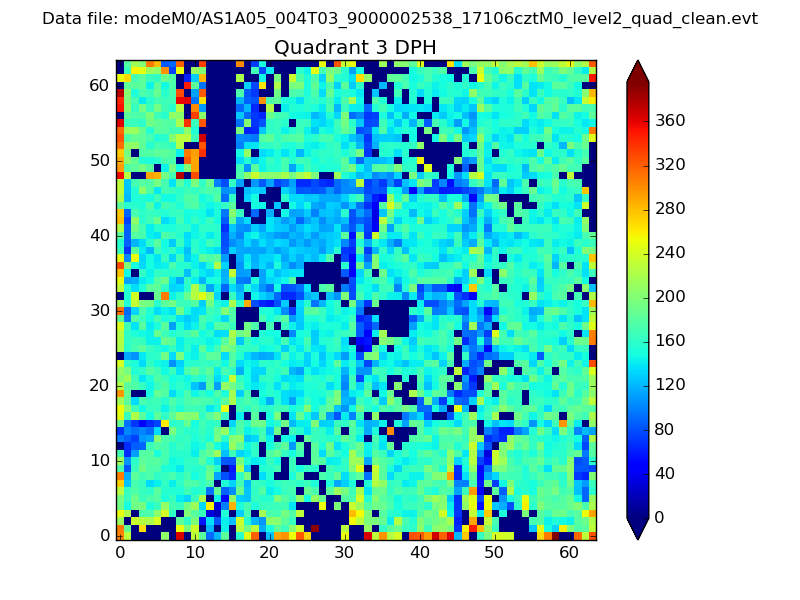 |
 |
Quadrant C |
| Plot type | Count rate plots | Images |
|---|---|---|
| Comparison with Poisson distribution Blue bars denote a histogram of data divided into 1 sec bins. Red curve is a Poisson curve with rate = median count rate of data. |
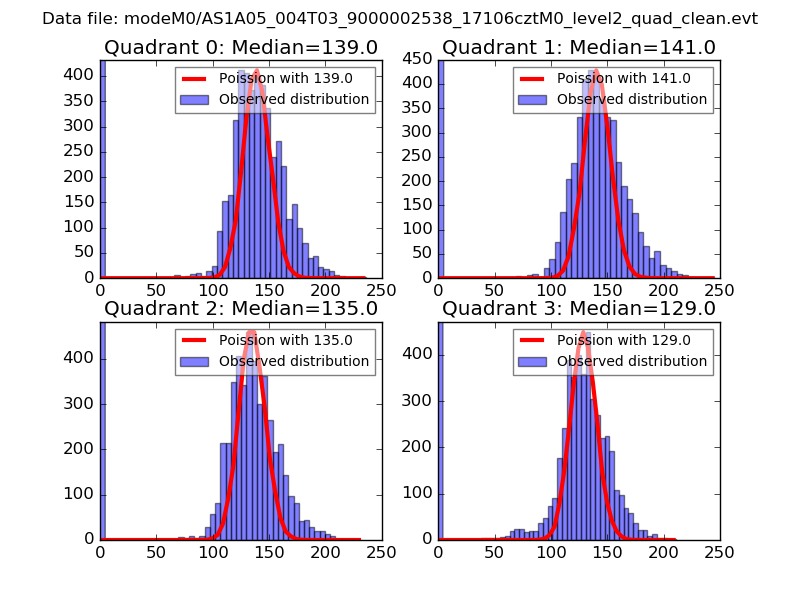 |
 |
| Quadrant-wise count rates Data is divided into 100 sec bins |
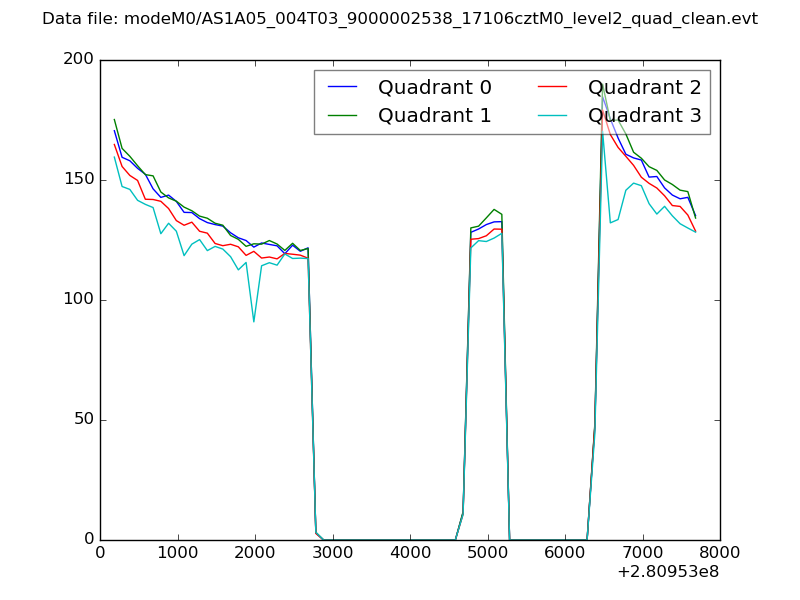 |
|
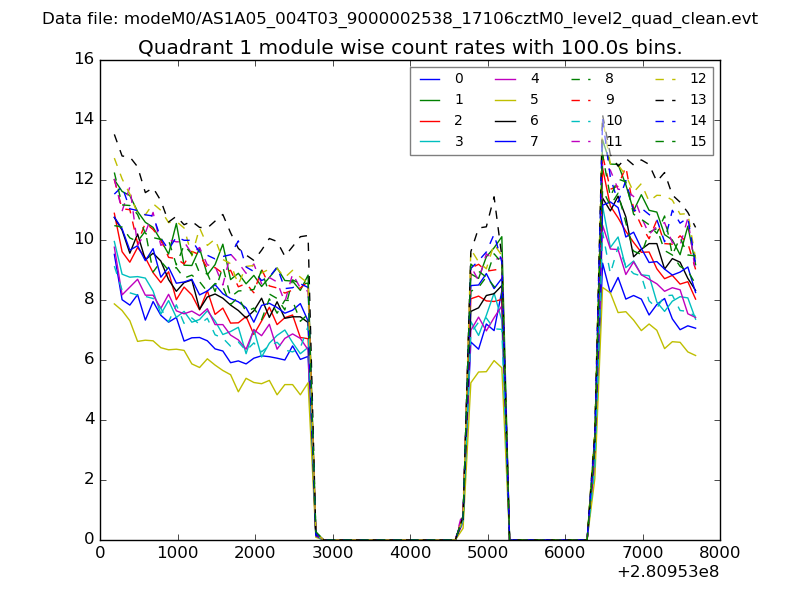
| Module-wise count rates for Quadrant A Data is divided into 100 sec bins |
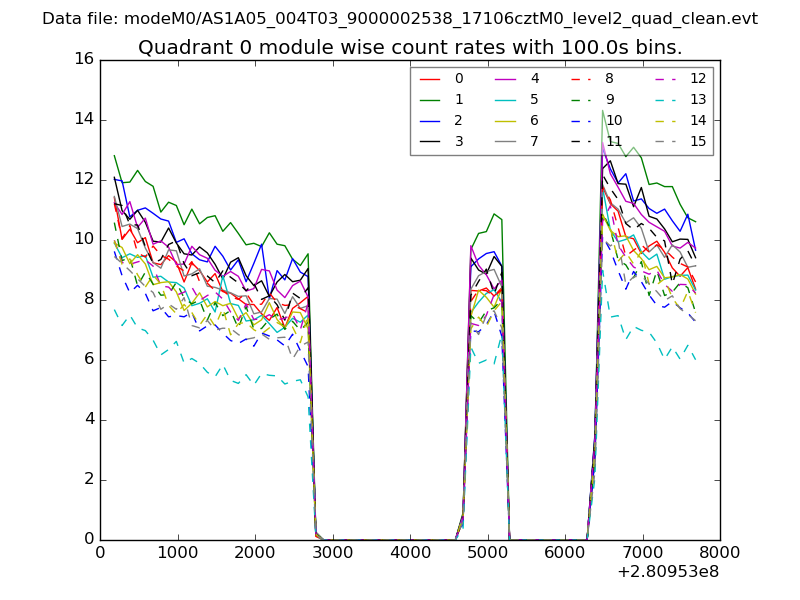 |
 |
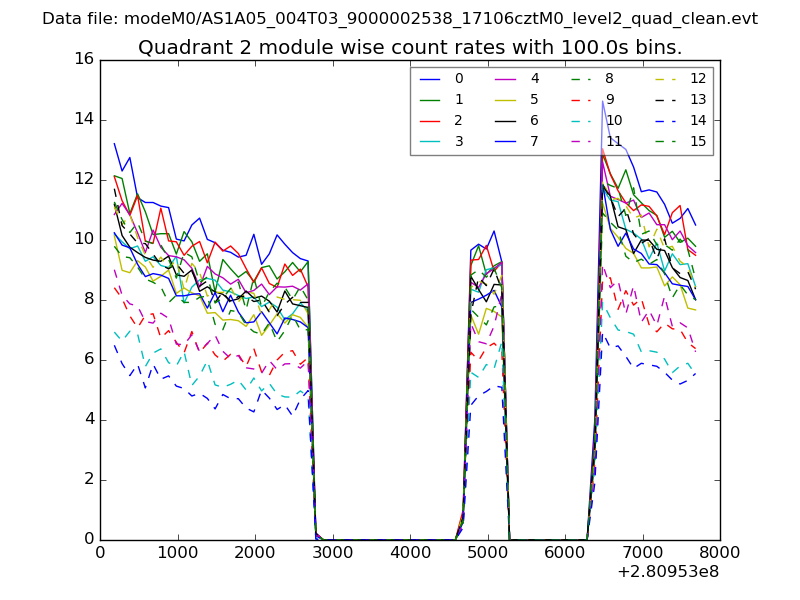
| Module-wise count rates for Quadrant B Data is divided into 100 sec bins |
 |
 |
| Module-wise count rates for Quadrant C Data is divided into 100 sec bins |
 |
 |
| Module-wise count rates for Quadrant D Data is divided into 100 sec bins |
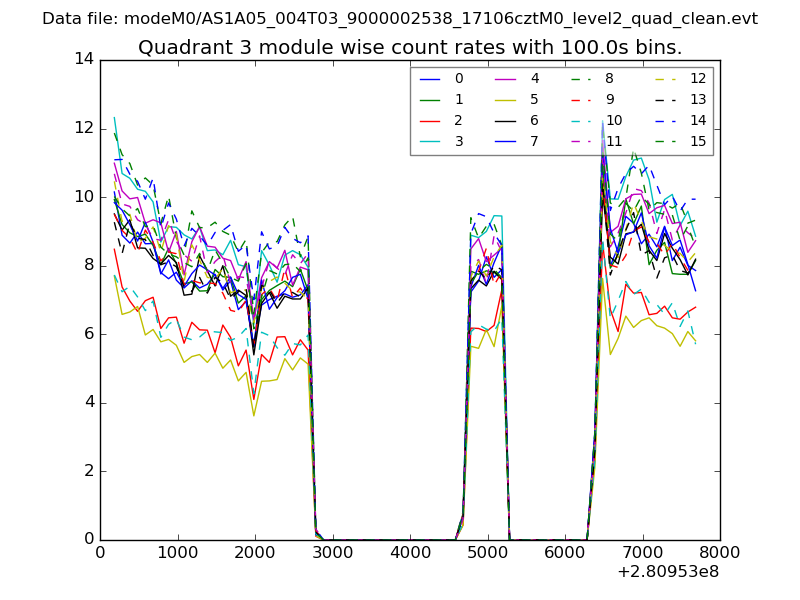 |
 |
| Parameter | Plot |
|---|---|
| CZT HV Monitor | 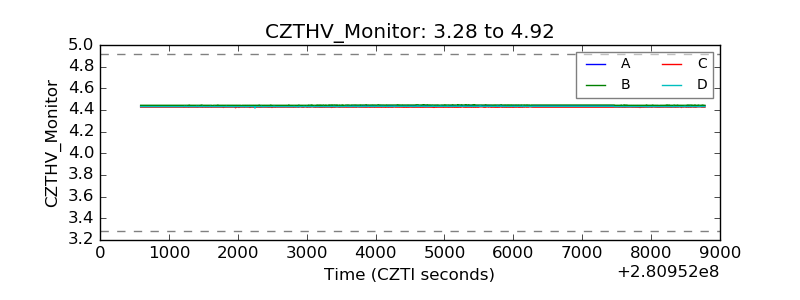 |
| D_VDD | 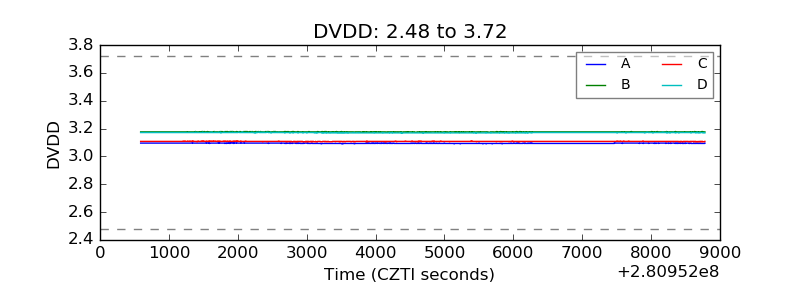 |
| Temperature 1 | 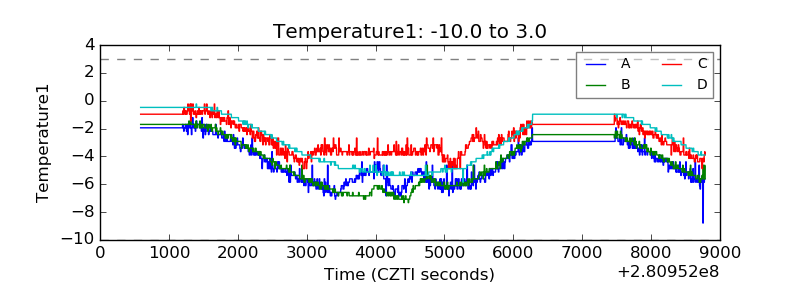 |
| Veto HV Monitor | 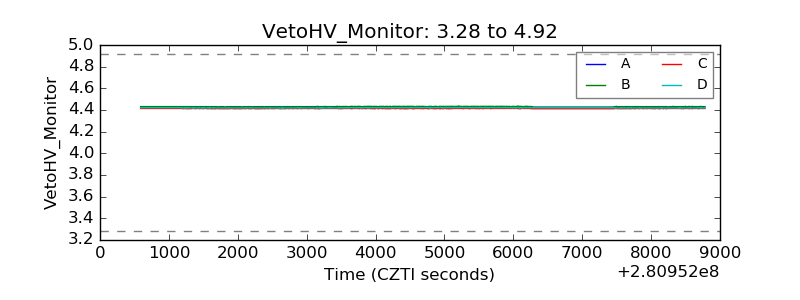 |
| Veto LLD | 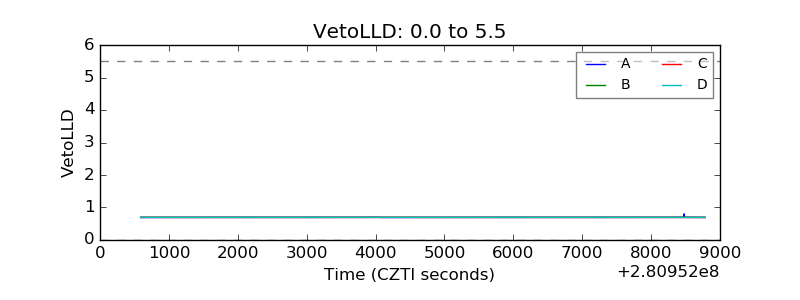 |
| Alpha Counter | 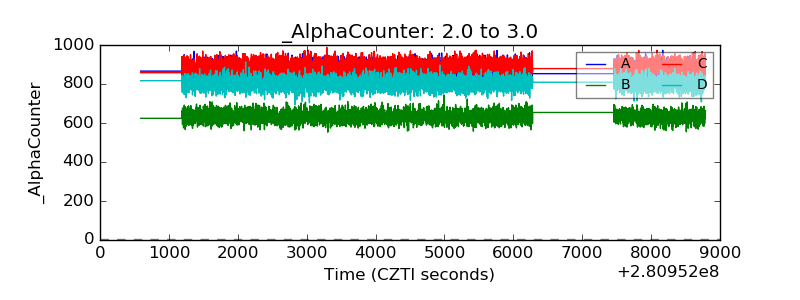 |
| _CPM_Rate |  |
| CZT Counter | 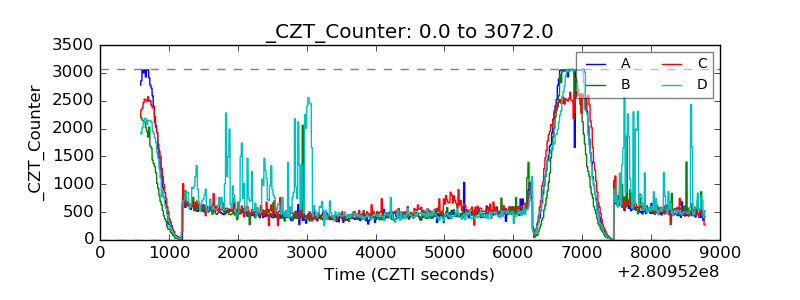 |
| +2.5 Volts monitor |  |
| +5 Volts monitor |  |
| _ROLL_ROT | 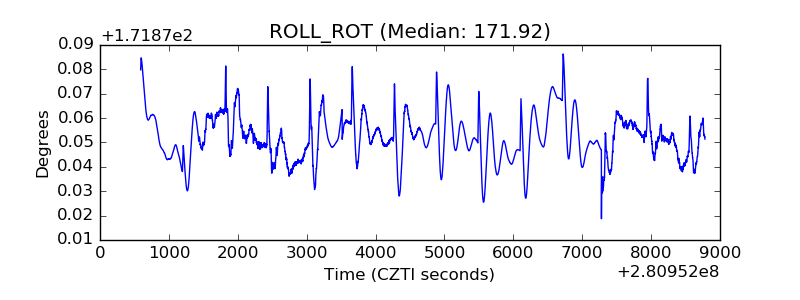 |
| _Roll_DEC | 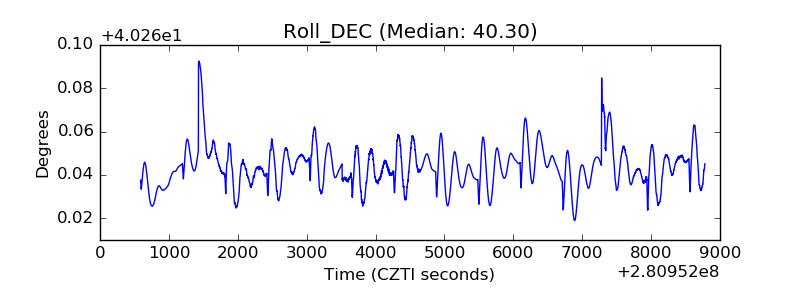 |
| _Roll_RA | 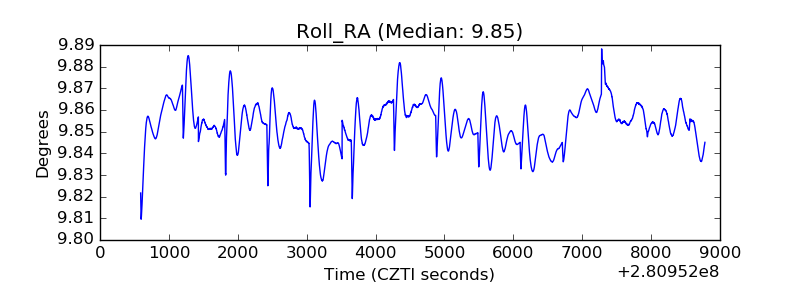 |
| Veto Counter | 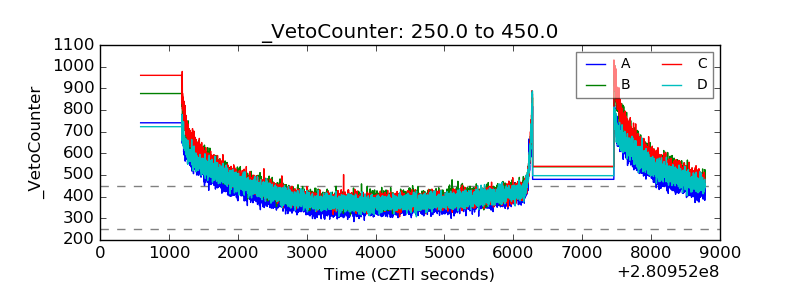 |