| Param | Original file | Final file |
|---|---|---|
| Filename | modeM0/AS1A05_004T03_9000002538_17107cztM0_level2.evt | modeM0/AS1A05_004T03_9000002538_17107cztM0_level2_quad_clean.evt |
| Size (bytes) | 452,312,640 | 95,198,400 |
| Size | 431.4 MB | 90.8 MB |
| Events in quadrant A | 2,983,254 | 623,659 |
| Events in quadrant B | 3,217,674 | 641,281 |
| Events in quadrant C | 3,203,075 | 609,438 |
| Events in quadrant D | 3,873,930 | 576,504 |
| Mode SS | |||
|---|---|---|---|
| Quadrant | BADHDUFLAG | Total packets | Discarded packets |
| A | 0 | 126 | 0 |
| B | 0 | 126 | 0 |
| C | 0 | 126 | 0 |
| D | 0 | 126 | 0 |
| Mode M0 | |||
|---|---|---|---|
| Quadrant | BADHDUFLAG | Total packets | Discarded packets |
| A | 0 | 12895 | 2 |
| B | 0 | 13576 | 2 |
| C | 0 | 13292 | 3 |
| D | 0 | 15818 | 2 |
| Mode M9 | |||
|---|---|---|---|
| Quadrant | BADHDUFLAG | Total packets | Discarded packets |
| A | 0 | 17 | 0 |
| B | 0 | 18 | 0 |
| C | 0 | 18 | 0 |
| D | 0 | 18 | 0 |
| Quadrant | Total seconds | Saturated seconds | Saturation percentage |
|---|---|---|---|
| A | 6188 | 13 | 0.210084% |
| B | 6188 | 35 | 0.565611% |
| C | 6187 | 52 | 0.840472% |
| D | 6187 | 176 | 2.844674% |
Noise dominated data is calculated using 1-second bins in cleaned event files. If a bin has >2000 counts, and if more than 50% of those come from <1% of pixels, then it is considered to be noise-dominated and hence unusable.
| Quadrant | # 1 sec bins | Bins with >0 counts | Bins with >2000 counts | High rate bins dominated by noise | Noise dominated (total time) | Noise dominated (detector-on time) | Marked lightcurve |
|---|---|---|---|---|---|---|---|
| A | 7488 | 6189 | 0 | 0 | 0.00% | 0.00% | 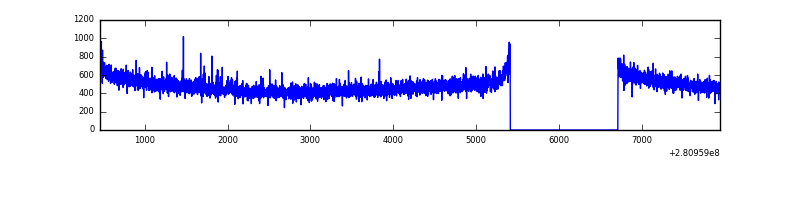 |
| B | 7488 | 6189 | 6 | 6 | 0.08% | 0.10% | 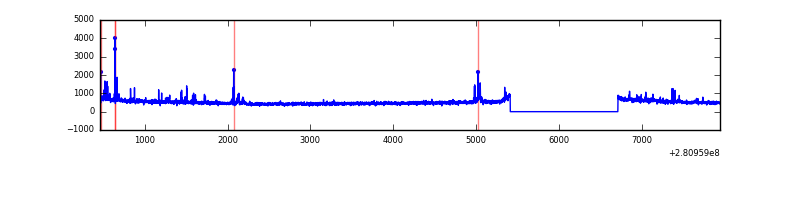 |
| C | 7487 | 6188 | 0 | 0 | 0.00% | 0.00% | 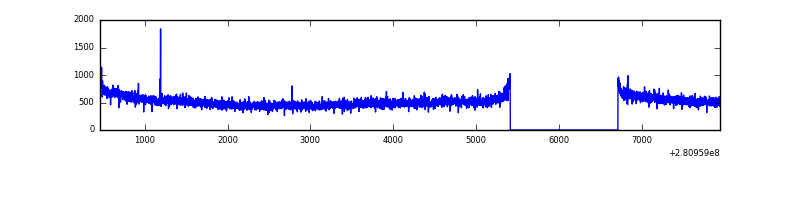 |
| D | 7487 | 6188 | 149 | 149 | 1.99% | 2.41% | 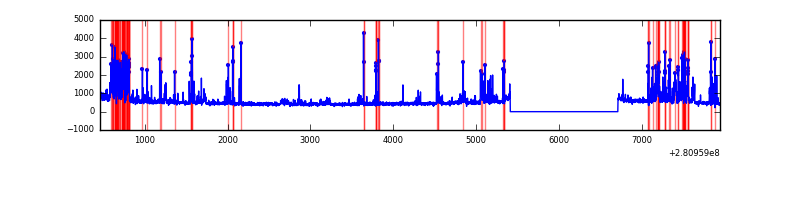 |
Top three noisy pixels from each quadrant. If the there are fewer than three noisy pixels in the level2.evt file, extra rows are filled as -1
| Pixel properties | Quadrant properties | ||||||
|---|---|---|---|---|---|---|---|
| Quadrant | DetID | PixID | Counts | Sigma | Mean | Median | Sigma |
| A | 4 | 2 | 11862 | 71.78 | 772 | 757 | 154.7 |
| A | 0 | 226 | 6759 | 38.79 | 772 | 757 | 154.7 |
| A | 12 | 194 | 5792 | 32.54 | 772 | 757 | 154.7 |
| B | 0 | 189 | 59886 | 407.37 | 779 | 759 | 145.1 |
| B | 0 | 229 | 39133 | 264.39 | 779 | 759 | 145.1 |
| B | 0 | 197 | 30733 | 206.51 | 779 | 759 | 145.1 |
| C | 3 | 233 | 137674 | 782.44 | 755 | 762 | 175.0 |
| C | 14 | 238 | 116444 | 661.11 | 755 | 762 | 175.0 |
| C | 13 | 61 | 5380 | 26.39 | 755 | 762 | 175.0 |
| D | 5 | 222 | 816555 | 4560.71 | 746 | 728 | 178.9 |
| D | 10 | 70 | 180419 | 1004.53 | 746 | 728 | 178.9 |
| D | 1 | 52 | 32973 | 180.26 | 746 | 728 | 178.9 |
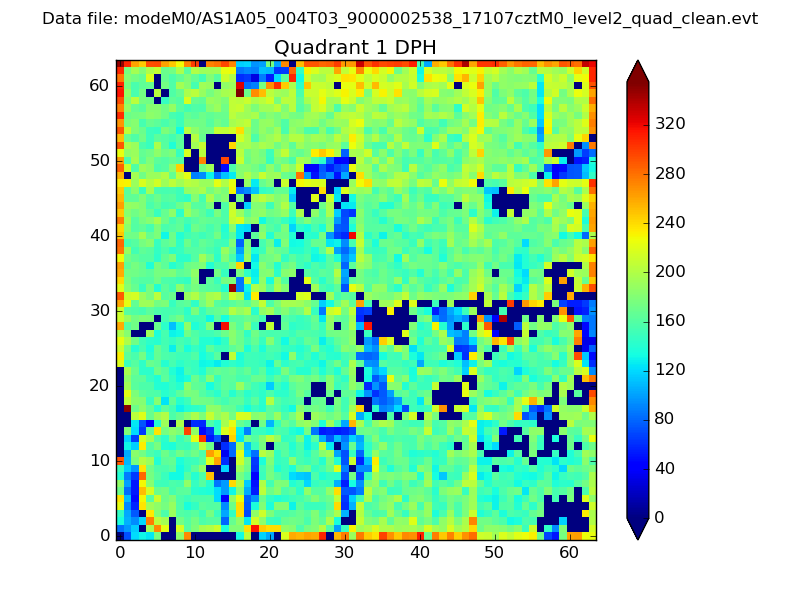
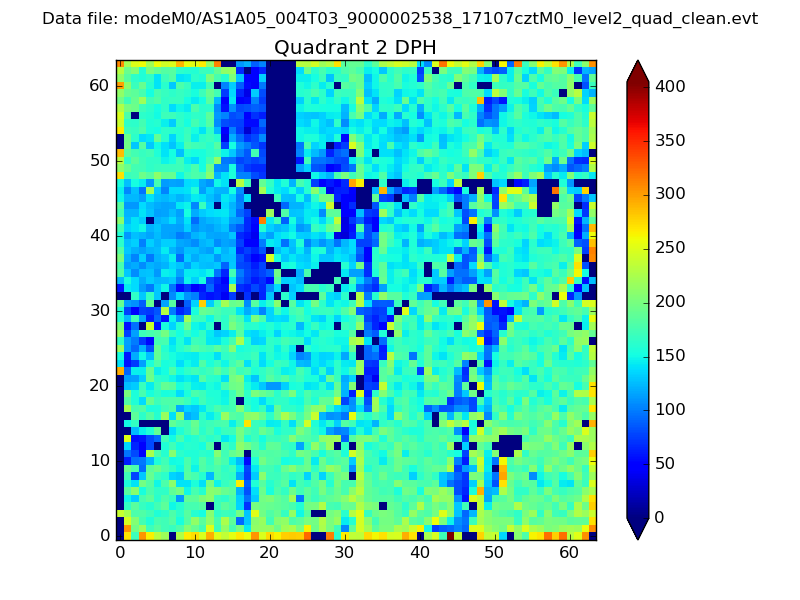
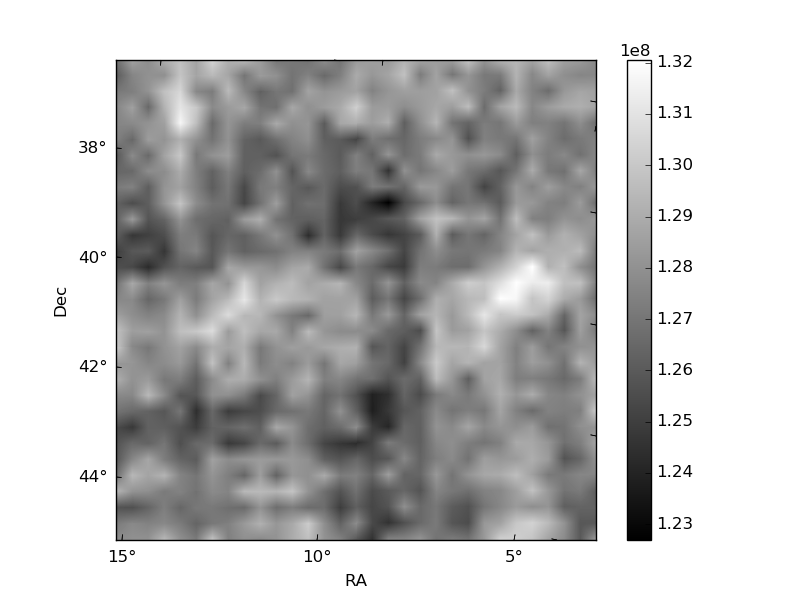
Histogram calculated using DETX and DETY for each event in the final _common_clean file
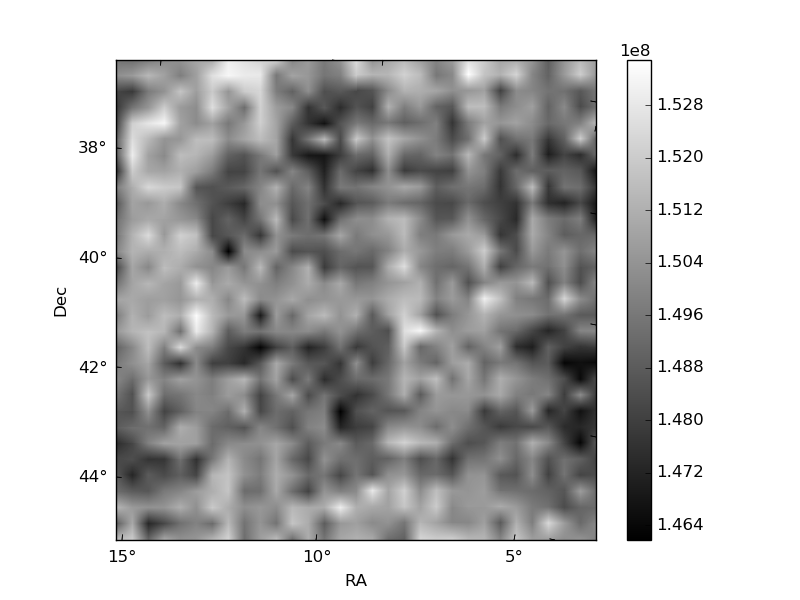
| Quadrant A |  |
 |
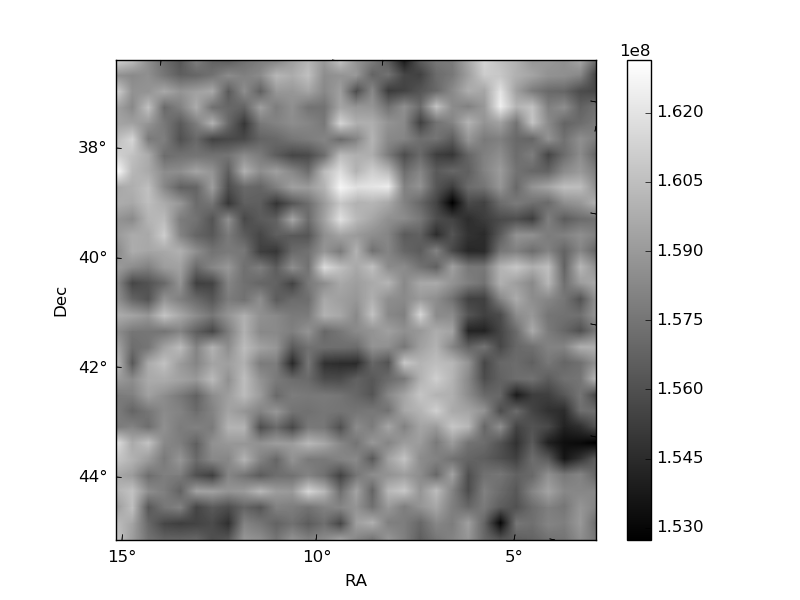
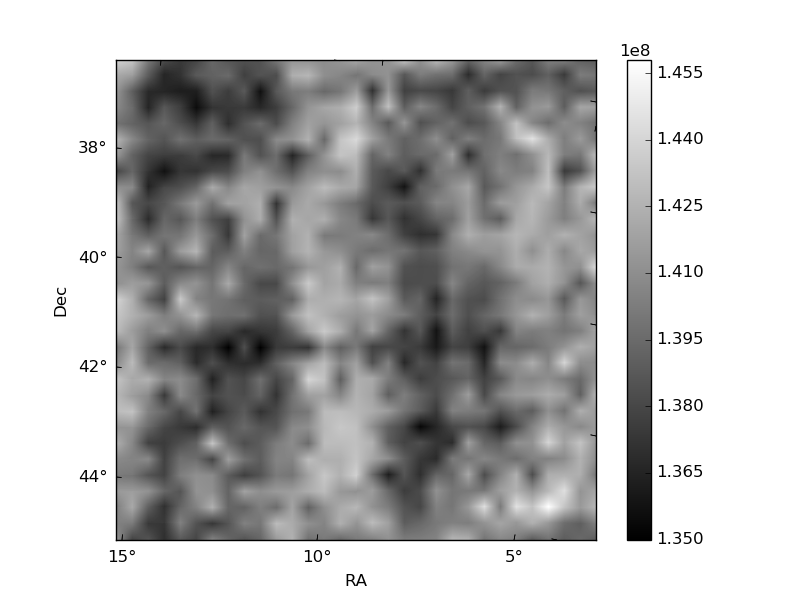
Quadrant B |
|---|---|---|---|
| Quadrant D | 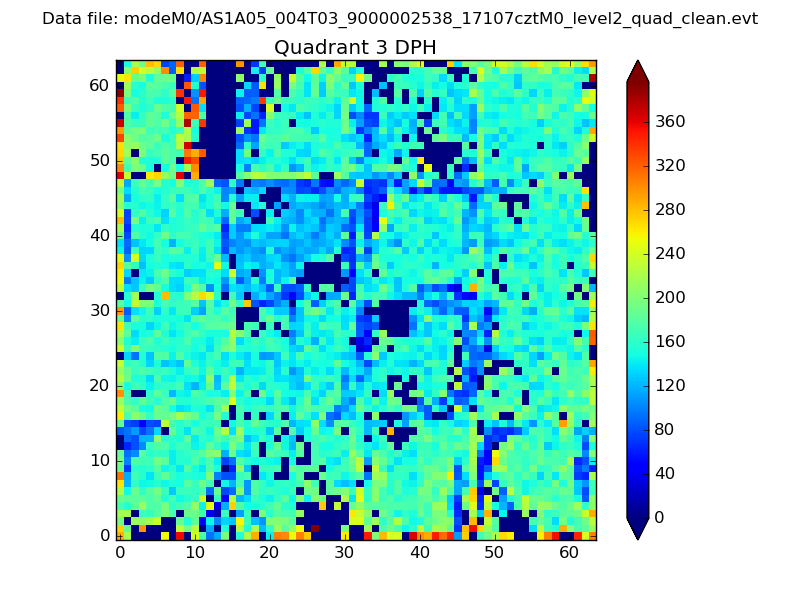 |
 |
Quadrant C |
| Plot type | Count rate plots | Images |
|---|---|---|
| Comparison with Poisson distribution Blue bars denote a histogram of data divided into 1 sec bins. Red curve is a Poisson curve with rate = median count rate of data. |
 |
 |
| Quadrant-wise count rates Data is divided into 100 sec bins |
 |
|
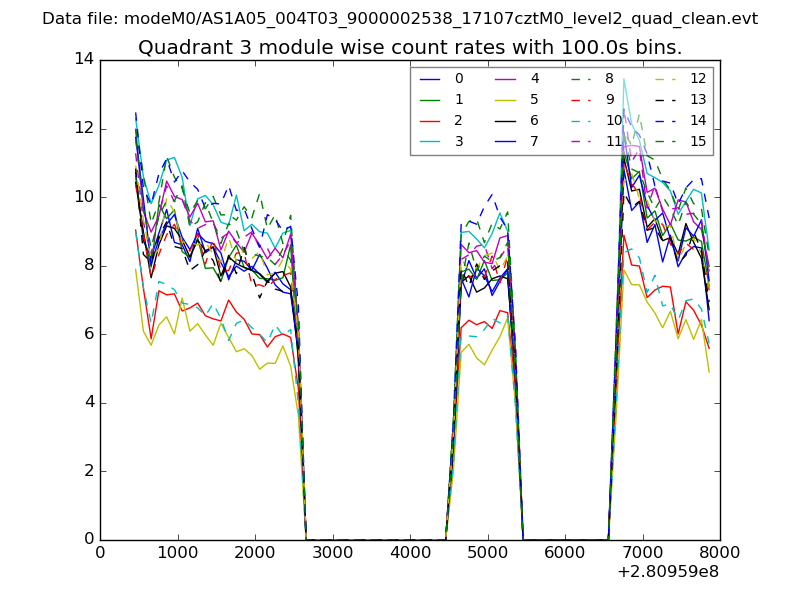
| Module-wise count rates for Quadrant A Data is divided into 100 sec bins |
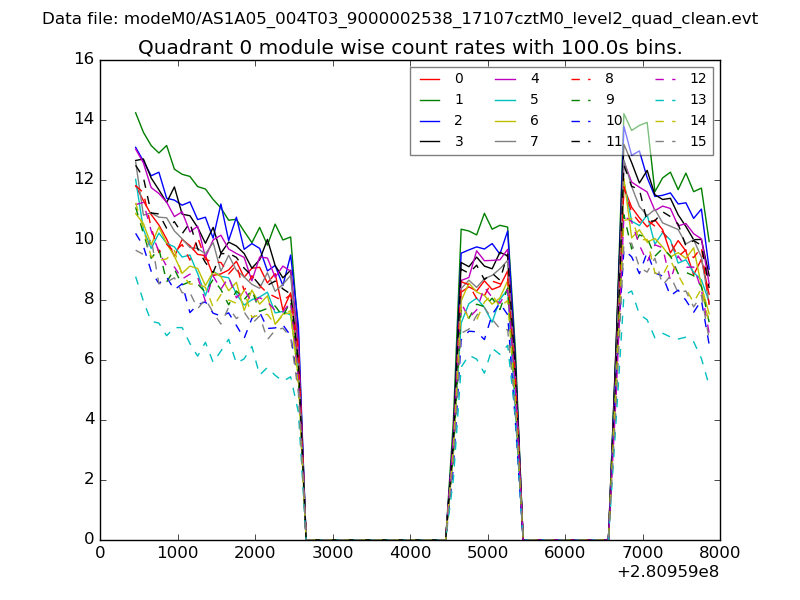 |
 |
| Module-wise count rates for Quadrant B Data is divided into 100 sec bins |
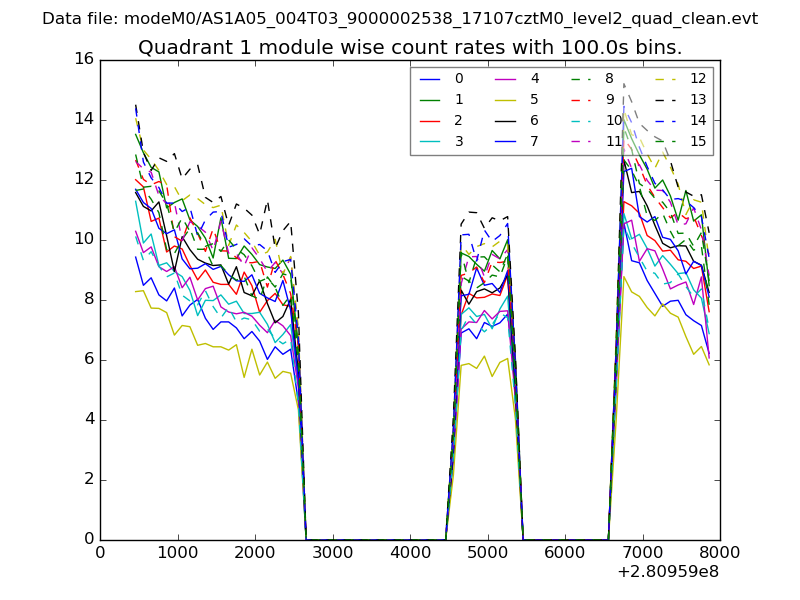 |
 |
| Module-wise count rates for Quadrant C Data is divided into 100 sec bins |
 |
 |
| Module-wise count rates for Quadrant D Data is divided into 100 sec bins |
 |
 |
| Parameter | Plot |
|---|---|
| CZT HV Monitor | 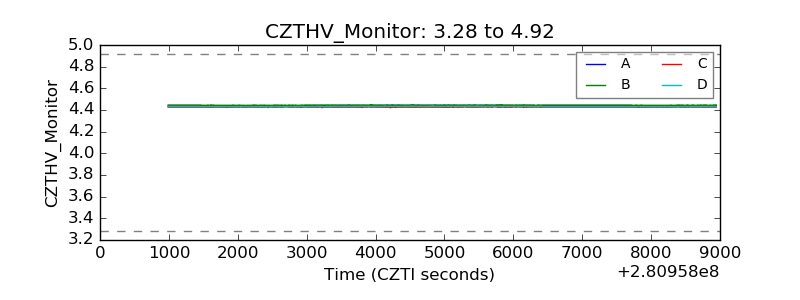 |
| D_VDD | 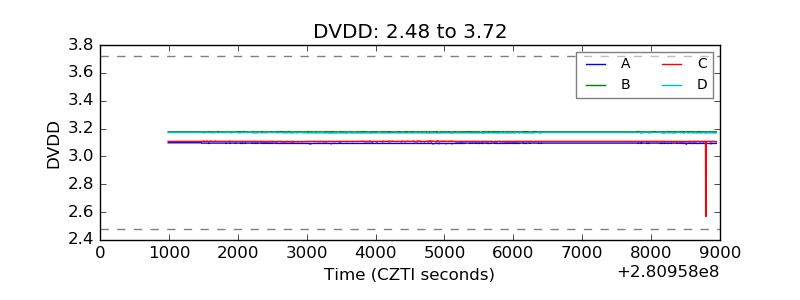 |
| Temperature 1 | 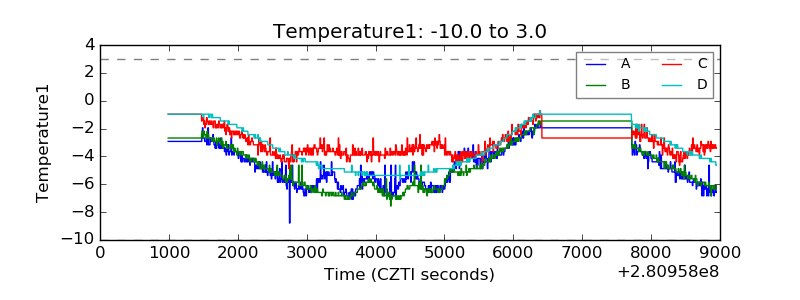 |
| Veto HV Monitor | 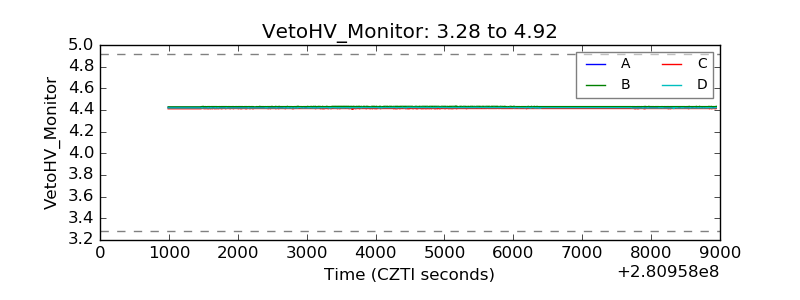 |
| Veto LLD | 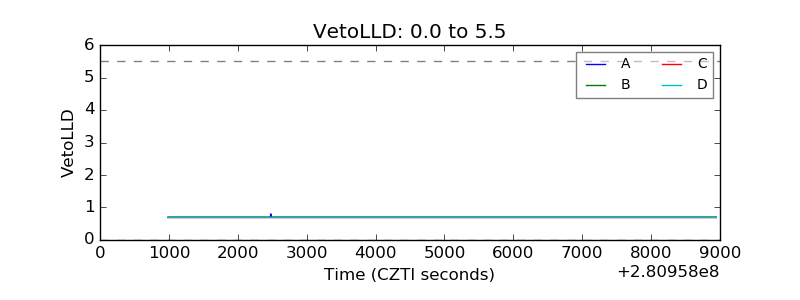 |
| Alpha Counter |  |
| _CPM_Rate | 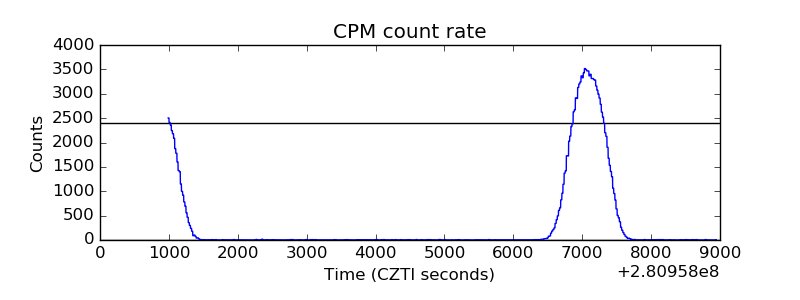 |
| CZT Counter | 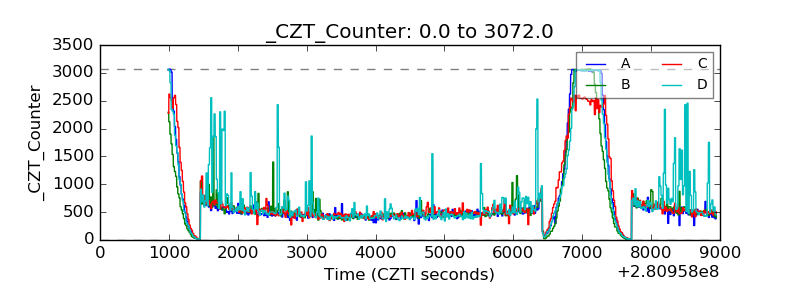 |
| +2.5 Volts monitor |  |
| +5 Volts monitor |  |
| _ROLL_ROT | 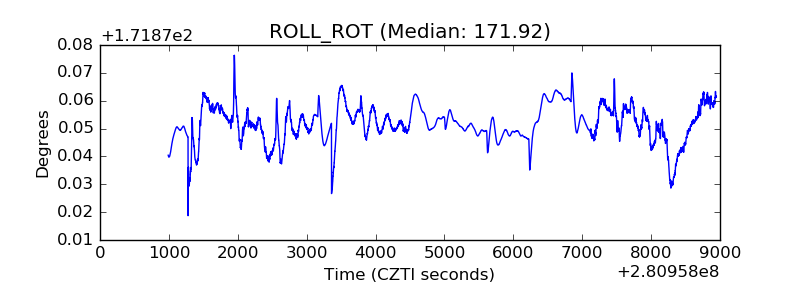 |
| _Roll_DEC | 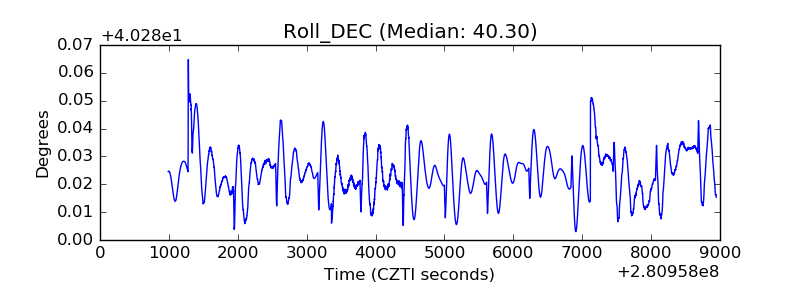 |
| _Roll_RA | 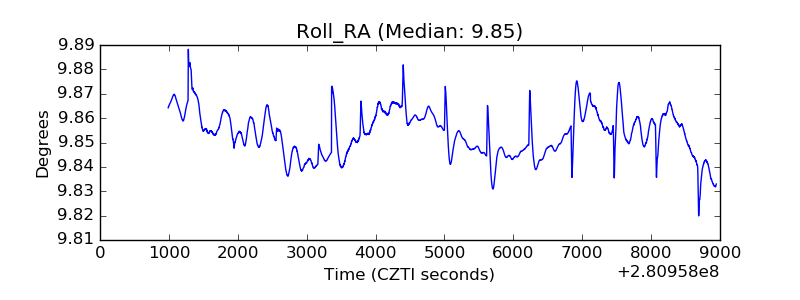 |
| Veto Counter | 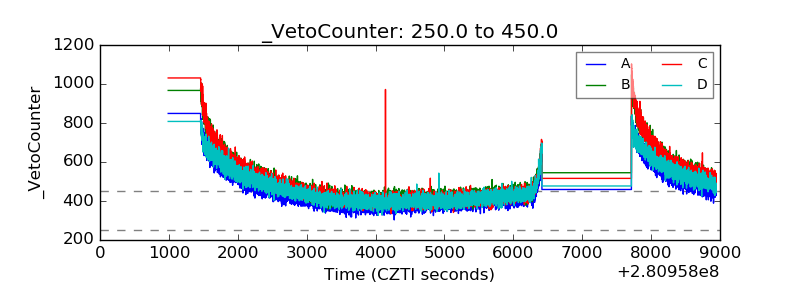 |