| Param | Original file | Final file |
|---|---|---|
| Filename | modeM0/AS1A05_004T03_9000002538_17108cztM0_level2.evt | modeM0/AS1A05_004T03_9000002538_17108cztM0_level2_quad_clean.evt |
| Size (bytes) | 440,769,600 | 93,718,080 |
| Size | 420.4 MB | 89.4 MB |
| Events in quadrant A | 3,001,491 | 613,392 |
| Events in quadrant B | 3,125,765 | 635,464 |
| Events in quadrant C | 3,184,267 | 600,384 |
| Events in quadrant D | 3,627,242 | 567,615 |
| Mode SS | |||
|---|---|---|---|
| Quadrant | BADHDUFLAG | Total packets | Discarded packets |
| A | 0 | 124 | 0 |
| B | 0 | 124 | 0 |
| C | 0 | 124 | 0 |
| D | 0 | 124 | 0 |
| Mode M0 | |||
|---|---|---|---|
| Quadrant | BADHDUFLAG | Total packets | Discarded packets |
| A | 0 | 12767 | 2 |
| B | 0 | 13147 | 2 |
| C | 0 | 13058 | 2 |
| D | 0 | 14848 | 2 |
| Mode M9 | |||
|---|---|---|---|
| Quadrant | BADHDUFLAG | Total packets | Discarded packets |
| A | 0 | 17 | 0 |
| B | 0 | 18 | 0 |
| C | 0 | 18 | 0 |
| D | 0 | 18 | 0 |
| Quadrant | Total seconds | Saturated seconds | Saturation percentage |
|---|---|---|---|
| A | 6029 | 29 | 0.481008% |
| B | 6029 | 34 | 0.563941% |
| C | 6029 | 59 | 0.978603% |
| D | 6029 | 107 | 1.774755% |
Noise dominated data is calculated using 1-second bins in cleaned event files. If a bin has >2000 counts, and if more than 50% of those come from <1% of pixels, then it is considered to be noise-dominated and hence unusable.
| Quadrant | # 1 sec bins | Bins with >0 counts | Bins with >2000 counts | High rate bins dominated by noise | Noise dominated (total time) | Noise dominated (detector-on time) | Marked lightcurve |
|---|---|---|---|---|---|---|---|
| A | 7404 | 6030 | 11 | 11 | 0.15% | 0.18% | 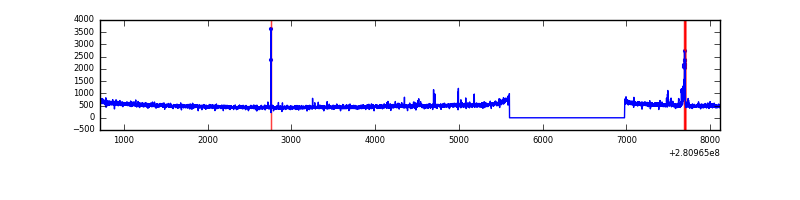 |
| B | 7404 | 6030 | 2 | 2 | 0.03% | 0.03% | 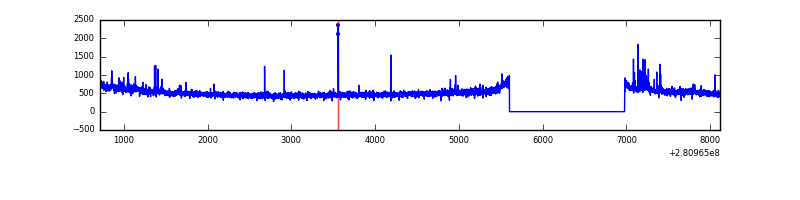 |
| C | 7404 | 6030 | 0 | 0 | 0.00% | 0.00% | 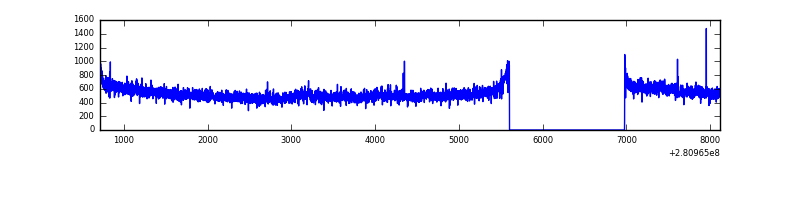 |
| D | 7404 | 6030 | 81 | 81 | 1.09% | 1.34% | 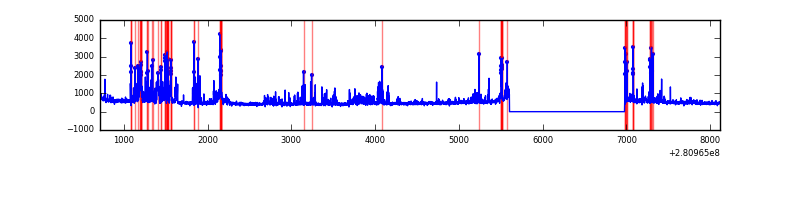 |
Top three noisy pixels from each quadrant. If the there are fewer than three noisy pixels in the level2.evt file, extra rows are filled as -1
| Pixel properties | Quadrant properties | ||||||
|---|---|---|---|---|---|---|---|
| Quadrant | DetID | PixID | Counts | Sigma | Mean | Median | Sigma |
| A | 4 | 2 | 55166 | 355.09 | 764 | 749 | 153.3 |
| A | 12 | 189 | 10312 | 62.4 | 764 | 749 | 153.3 |
| A | 0 | 226 | 6648 | 38.49 | 764 | 749 | 153.3 |
| B | 0 | 219 | 23634 | 159.39 | 776 | 758 | 143.5 |
| B | 0 | 189 | 17085 | 113.76 | 776 | 758 | 143.5 |
| B | 12 | 111 | 16102 | 106.91 | 776 | 758 | 143.5 |
| C | 3 | 233 | 159939 | 918.35 | 746 | 753 | 173.3 |
| C | 14 | 238 | 114554 | 656.52 | 746 | 753 | 173.3 |
| C | 13 | 61 | 5282 | 26.13 | 746 | 753 | 173.3 |
| D | 5 | 222 | 511998 | 2869.8 | 737 | 717 | 178.2 |
| D | 10 | 70 | 169606 | 947.97 | 737 | 717 | 178.2 |
| D | 1 | 52 | 135602 | 757.1 | 737 | 717 | 178.2 |
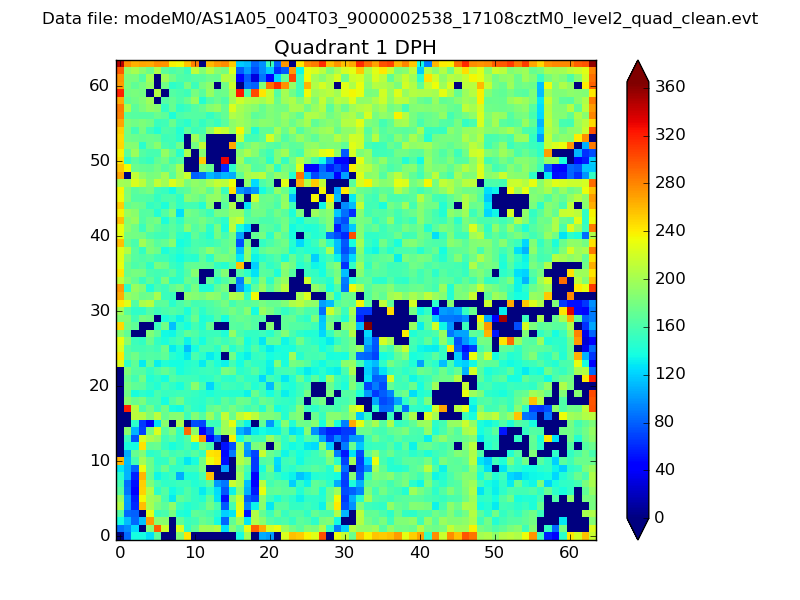
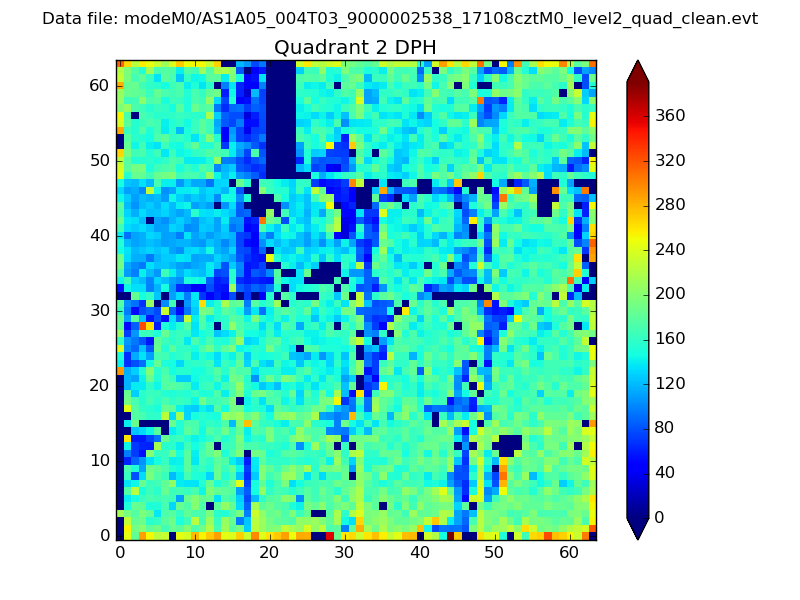
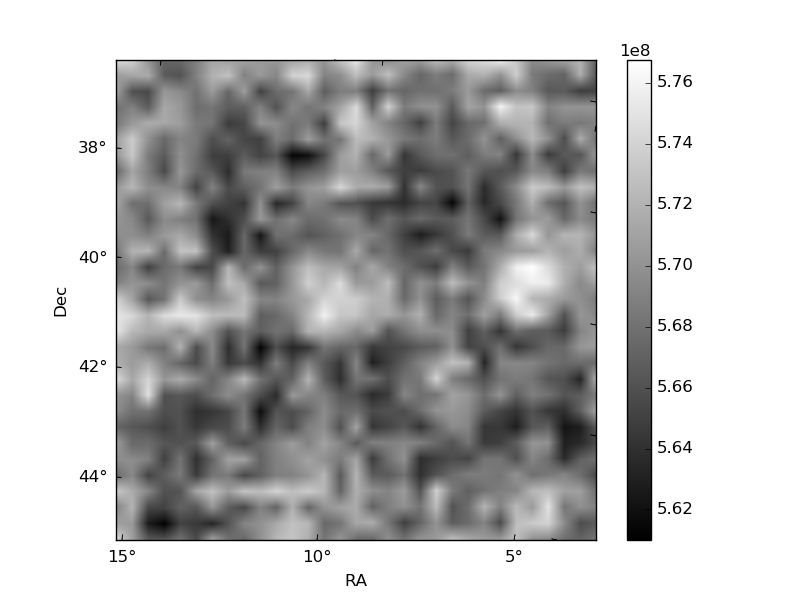
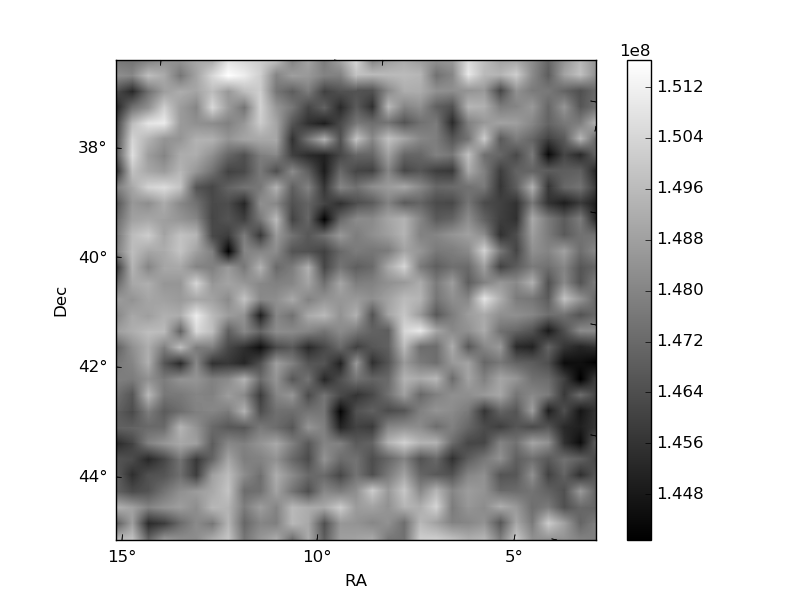
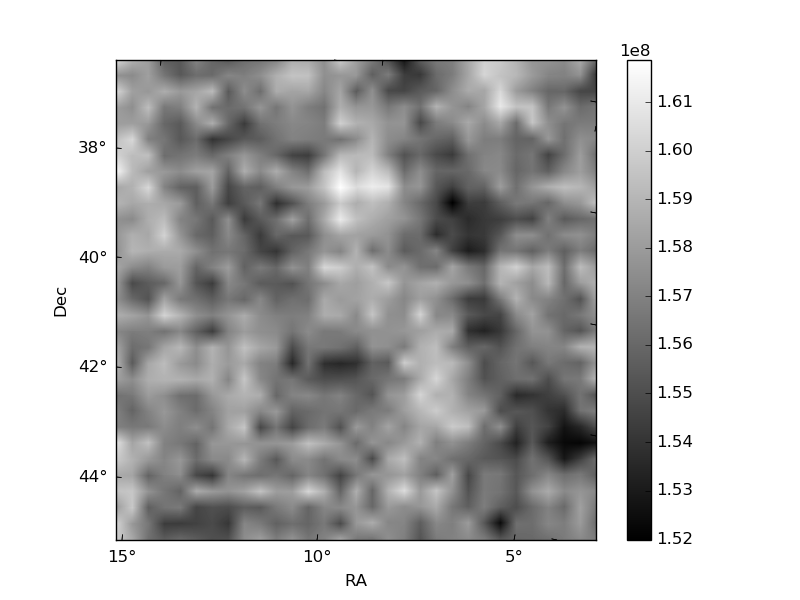
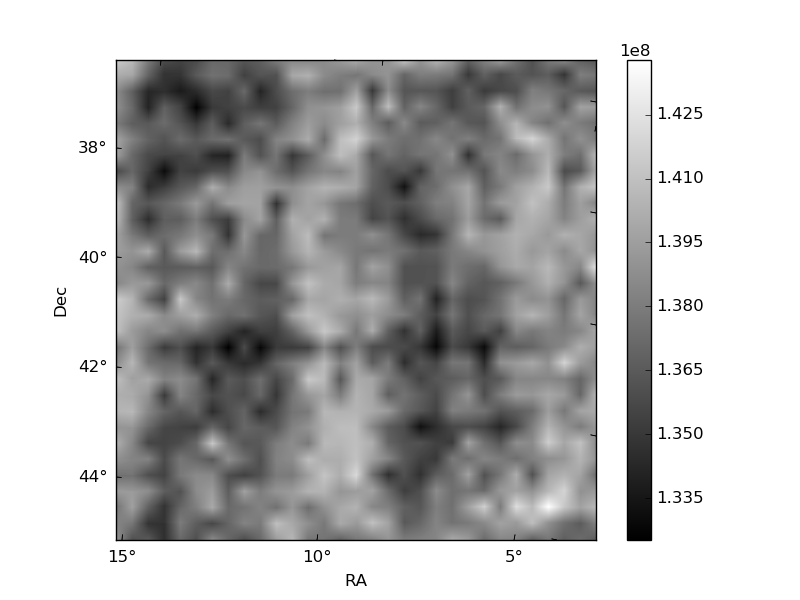
Histogram calculated using DETX and DETY for each event in the final _common_clean file
| Quadrant A |  |
 |
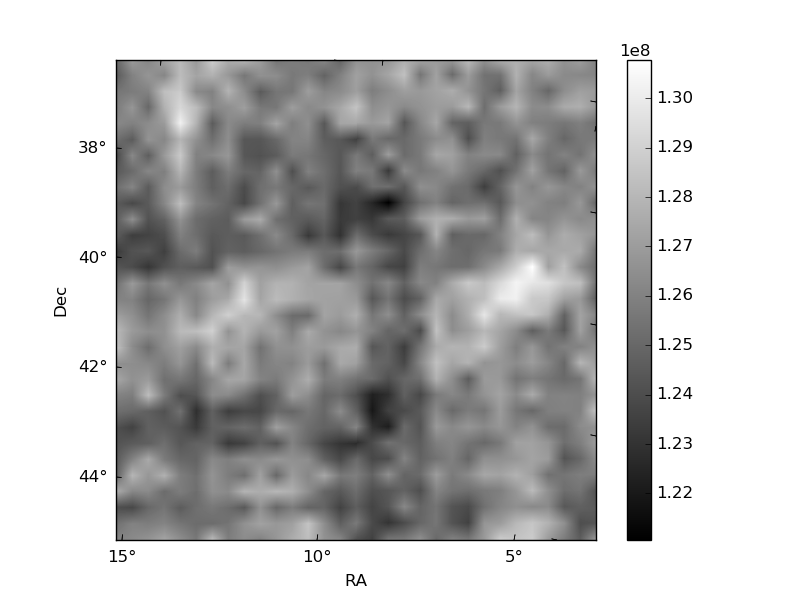
Quadrant B |
|---|---|---|---|
| Quadrant D | 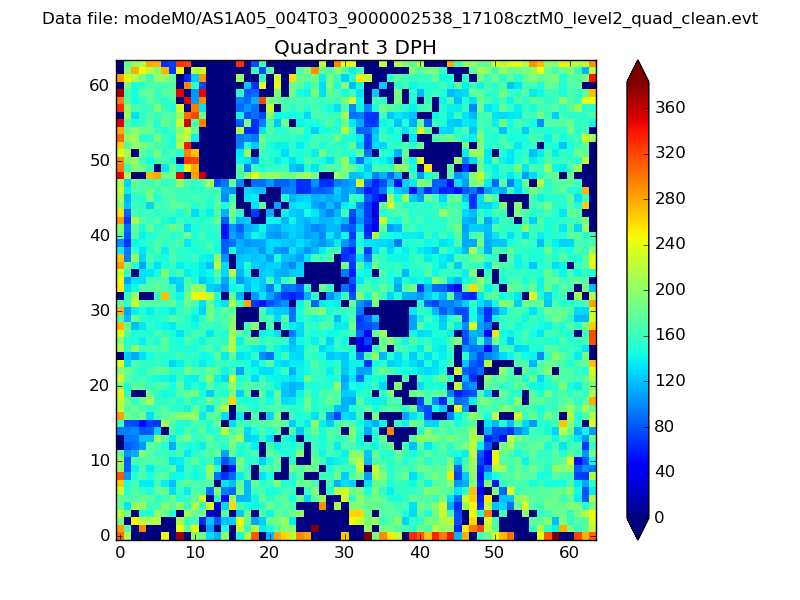 |
 |
Quadrant C |
| Plot type | Count rate plots | Images |
|---|---|---|
| Comparison with Poisson distribution Blue bars denote a histogram of data divided into 1 sec bins. Red curve is a Poisson curve with rate = median count rate of data. |
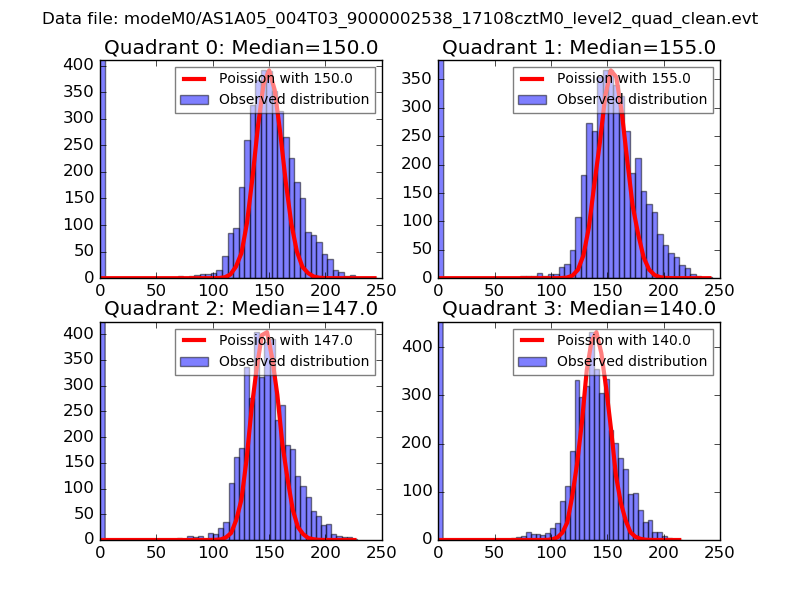 |
 |
| Quadrant-wise count rates Data is divided into 100 sec bins |
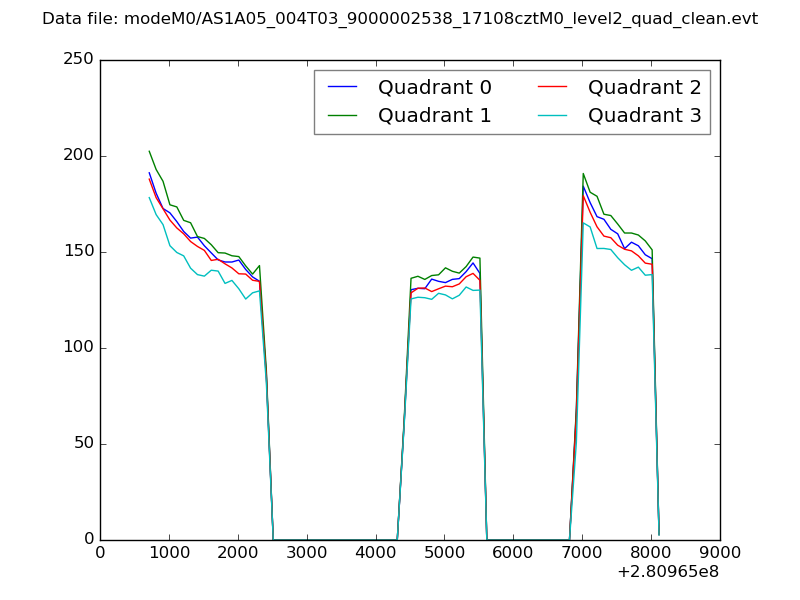 |
|
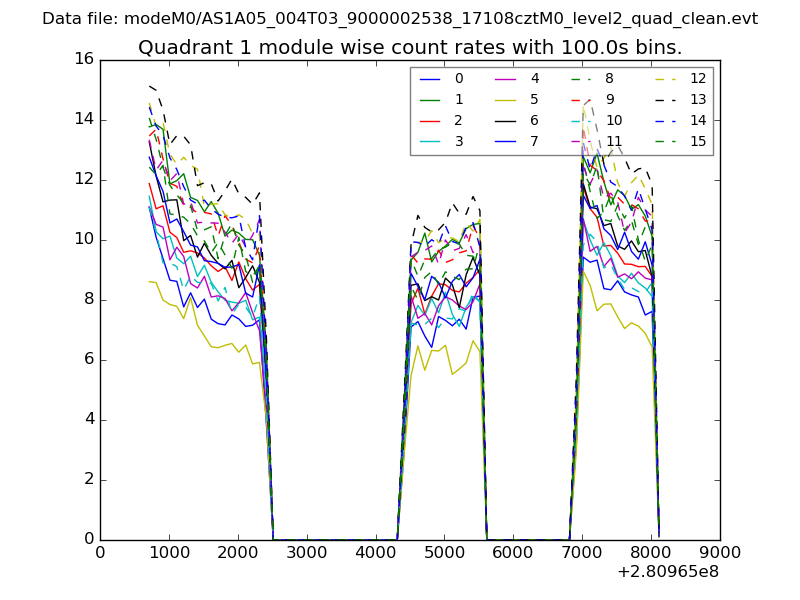
| Module-wise count rates for Quadrant A Data is divided into 100 sec bins |
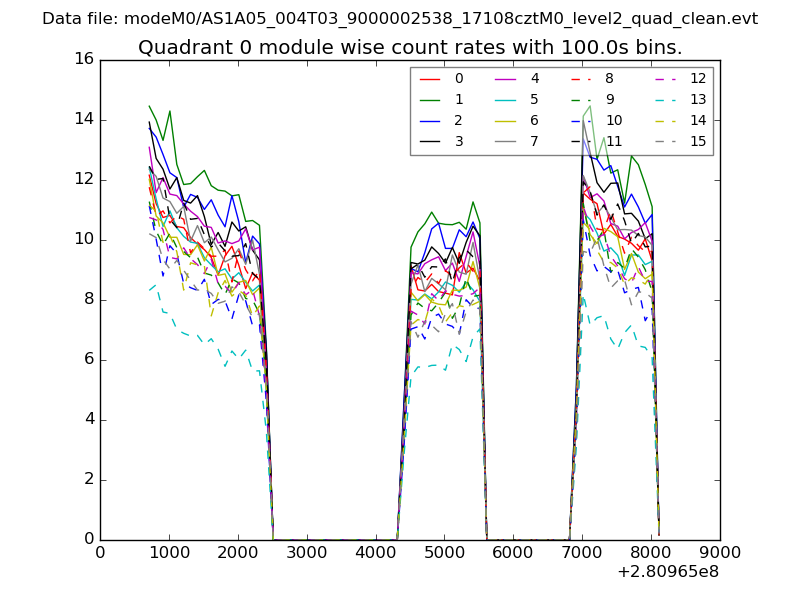 |
 |
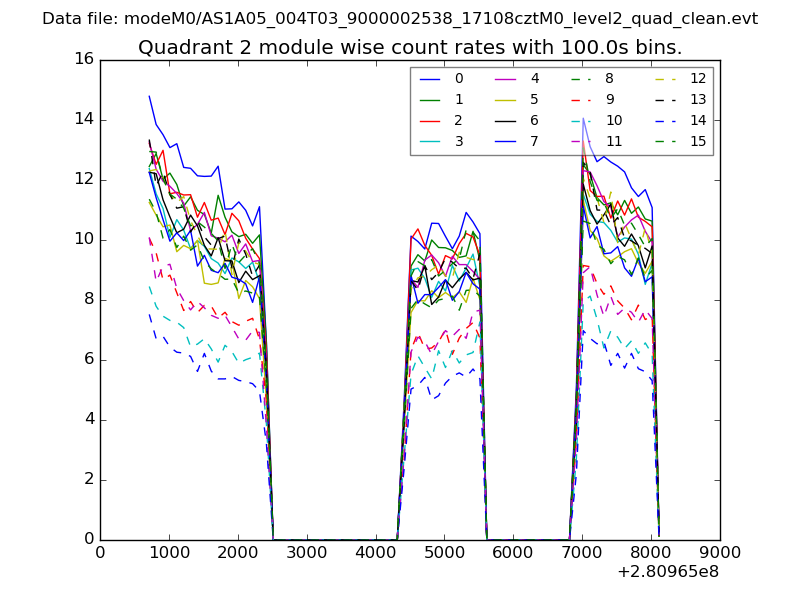
| Module-wise count rates for Quadrant B Data is divided into 100 sec bins |
 |
 |
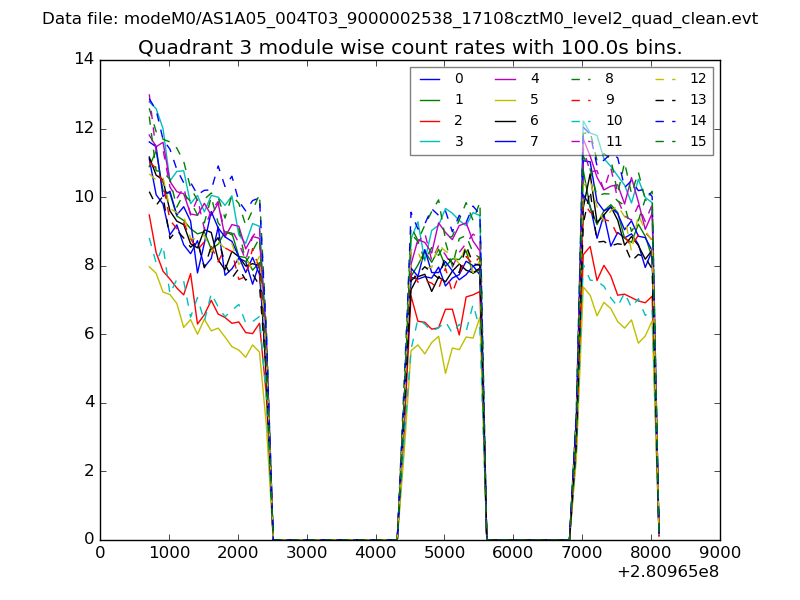
| Module-wise count rates for Quadrant C Data is divided into 100 sec bins |
 |
 |
| Module-wise count rates for Quadrant D Data is divided into 100 sec bins |
 |
 |
| Parameter | Plot |
|---|---|
| CZT HV Monitor | 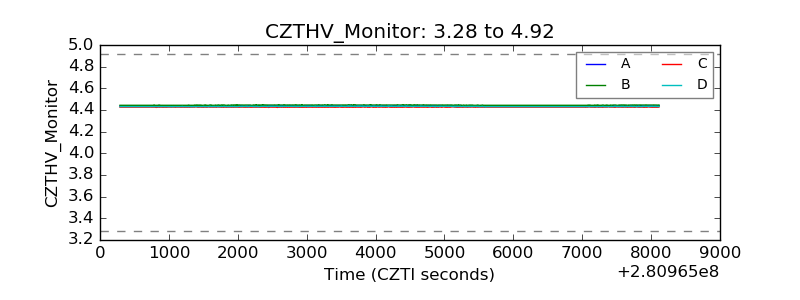 |
| D_VDD | 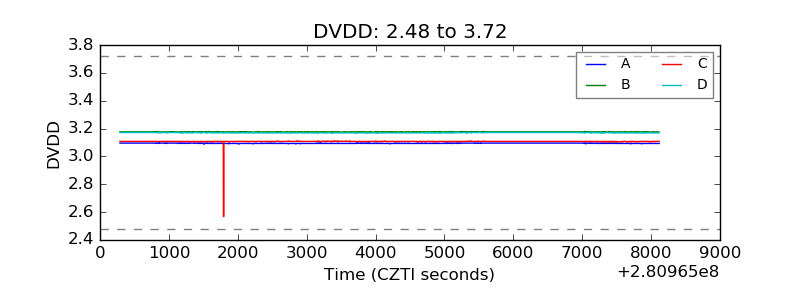 |
| Temperature 1 | 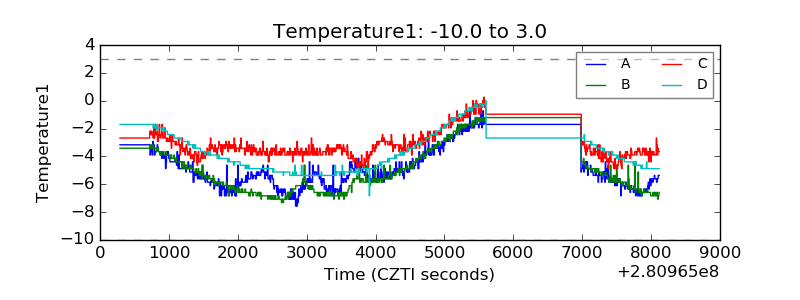 |
| Veto HV Monitor | 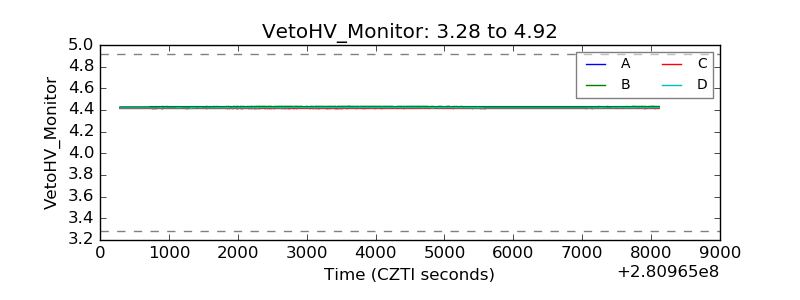 |
| Veto LLD | 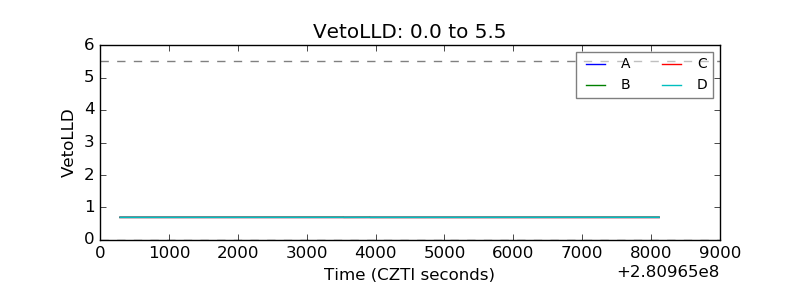 |
| Alpha Counter | 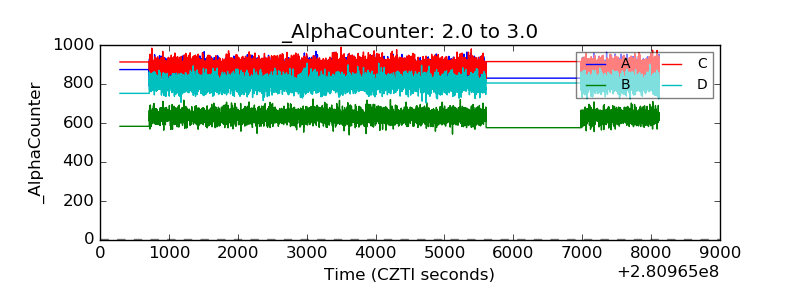 |
| _CPM_Rate | 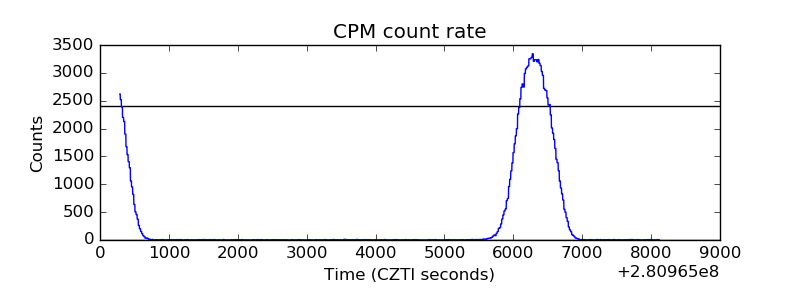 |
| CZT Counter | 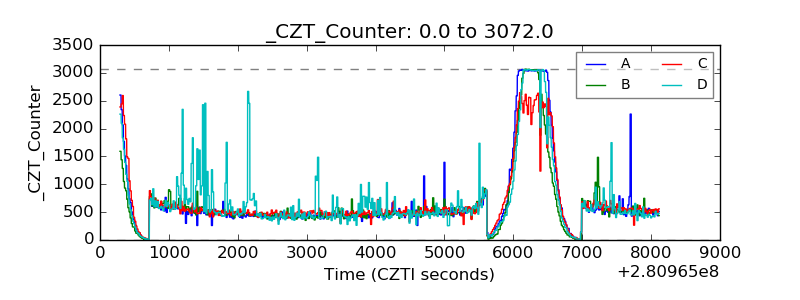 |
| +2.5 Volts monitor |  |
| +5 Volts monitor |  |
| _ROLL_ROT | 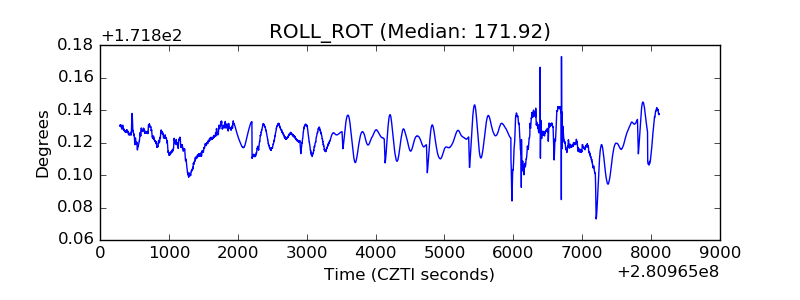 |
| _Roll_DEC | 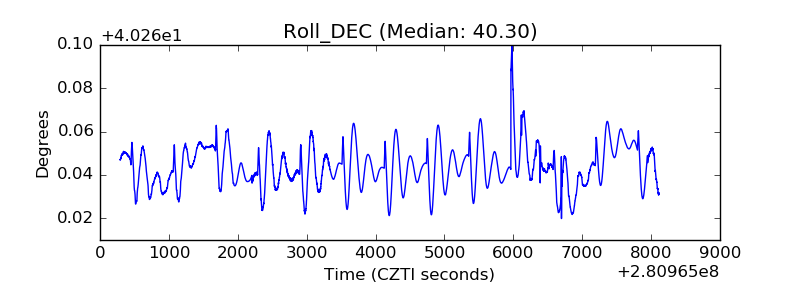 |
| _Roll_RA | 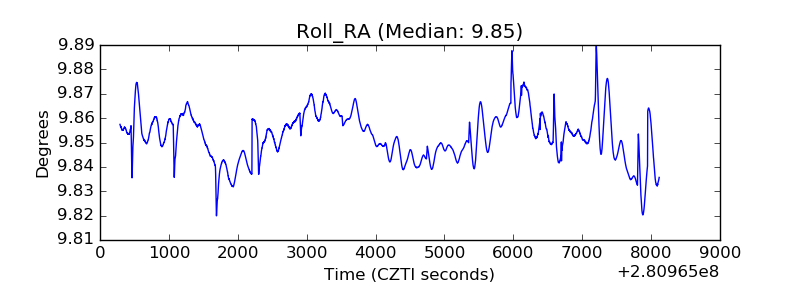 |
| Veto Counter | 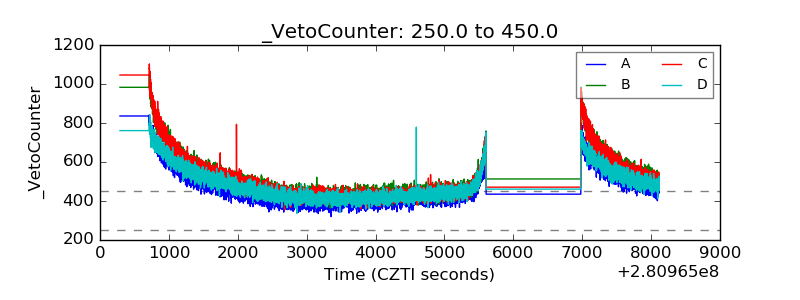 |