| Param | Original file | Final file |
|---|---|---|
| Filename | modeM0/AS1A05_004T03_9000002538_17110cztM0_level2.evt | modeM0/AS1A05_004T03_9000002538_17110cztM0_level2_quad_clean.evt |
| Size (bytes) | 462,352,320 | 80,640,000 |
| Size | 440.9 MB | 76.9 MB |
| Events in quadrant A | 3,104,043 | 507,640 |
| Events in quadrant B | 3,237,641 | 519,649 |
| Events in quadrant C | 3,342,556 | 488,302 |
| Events in quadrant D | 3,878,331 | 474,692 |
| Mode SS | |||
|---|---|---|---|
| Quadrant | BADHDUFLAG | Total packets | Discarded packets |
| A | 0 | 130 | 0 |
| B | 0 | 130 | 0 |
| C | 0 | 130 | 0 |
| D | 0 | 130 | 0 |
| Mode M0 | |||
|---|---|---|---|
| Quadrant | BADHDUFLAG | Total packets | Discarded packets |
| A | 0 | 13337 | 2 |
| B | 0 | 13645 | 2 |
| C | 0 | 13973 | 2 |
| D | 0 | 15825 | 2 |
| Mode M9 | |||
|---|---|---|---|
| Quadrant | BADHDUFLAG | Total packets | Discarded packets |
| A | 0 | 19 | 0 |
| B | 0 | 20 | 0 |
| C | 0 | 20 | 0 |
| D | 0 | 20 | 0 |
| Quadrant | Total seconds | Saturated seconds | Saturation percentage |
|---|---|---|---|
| A | 6478 | 30 | 0.463106% |
| B | 6478 | 56 | 0.864464% |
| C | 6478 | 79 | 1.219512% |
| D | 6478 | 131 | 2.022229% |
Noise dominated data is calculated using 1-second bins in cleaned event files. If a bin has >2000 counts, and if more than 50% of those come from <1% of pixels, then it is considered to be noise-dominated and hence unusable.
| Quadrant | # 1 sec bins | Bins with >0 counts | Bins with >2000 counts | High rate bins dominated by noise | Noise dominated (total time) | Noise dominated (detector-on time) | Marked lightcurve |
|---|---|---|---|---|---|---|---|
| A | 7748 | 6479 | 0 | 0 | 0.00% | 0.00% | 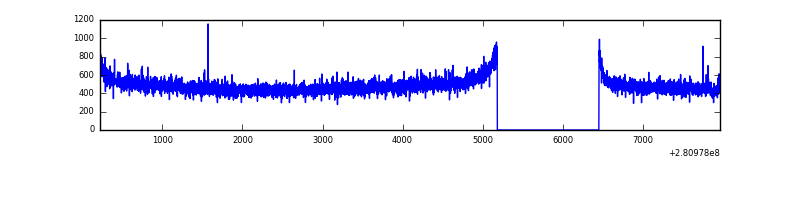 |
| B | 7748 | 6479 | 0 | 0 | 0.00% | 0.00% | 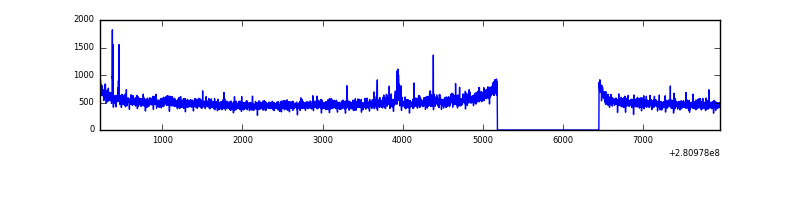 |
| C | 7748 | 6479 | 0 | 0 | 0.00% | 0.00% | 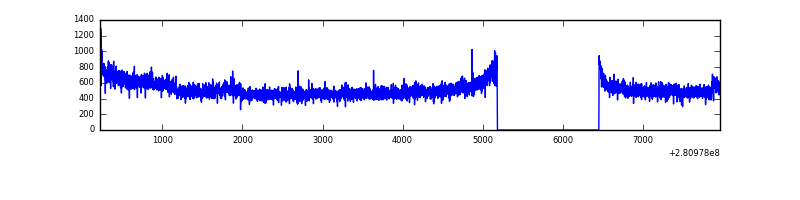 |
| D | 7748 | 6479 | 112 | 112 | 1.45% | 1.73% | 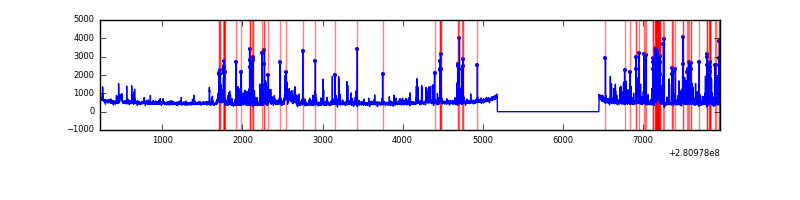 |
Top three noisy pixels from each quadrant. If the there are fewer than three noisy pixels in the level2.evt file, extra rows are filled as -1
| Pixel properties | Quadrant properties | ||||||
|---|---|---|---|---|---|---|---|
| Quadrant | DetID | PixID | Counts | Sigma | Mean | Median | Sigma |
| A | 4 | 2 | 10522 | 59.88 | 804 | 786 | 162.6 |
| A | 0 | 226 | 7013 | 38.3 | 804 | 786 | 162.6 |
| A | 12 | 194 | 5793 | 30.79 | 804 | 786 | 162.6 |
| B | 0 | 219 | 19813 | 123.87 | 812 | 795 | 153.5 |
| B | 12 | 111 | 17579 | 109.32 | 812 | 795 | 153.5 |
| B | 0 | 189 | 16217 | 100.44 | 812 | 795 | 153.5 |
| C | 3 | 233 | 198289 | 1096.19 | 775 | 782 | 180.2 |
| C | 14 | 238 | 121365 | 669.25 | 775 | 782 | 180.2 |
| C | 13 | 61 | 5538 | 26.4 | 775 | 782 | 180.2 |
| D | 12 | 32 | 647674 | 3471.37 | 770 | 748 | 186.4 |
| D | 5 | 222 | 217952 | 1165.51 | 770 | 748 | 186.4 |
| D | 10 | 70 | 72970 | 387.54 | 770 | 748 | 186.4 |
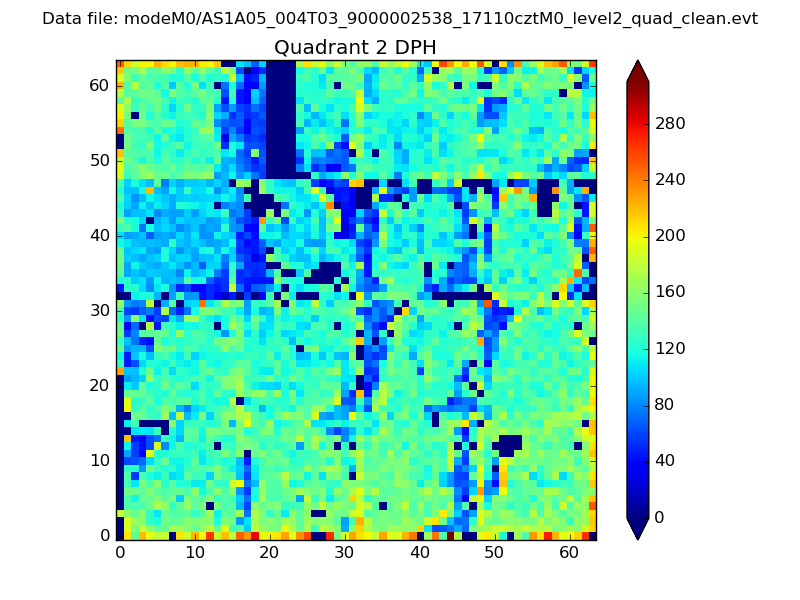
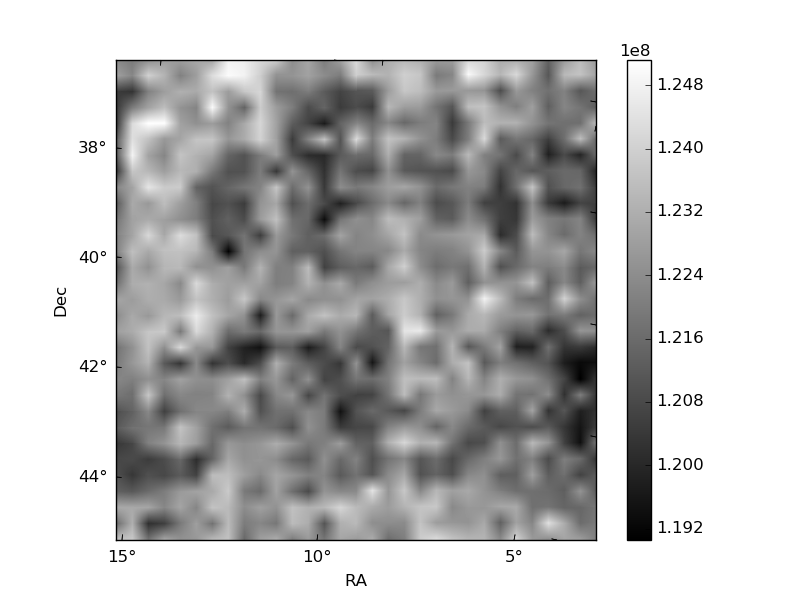
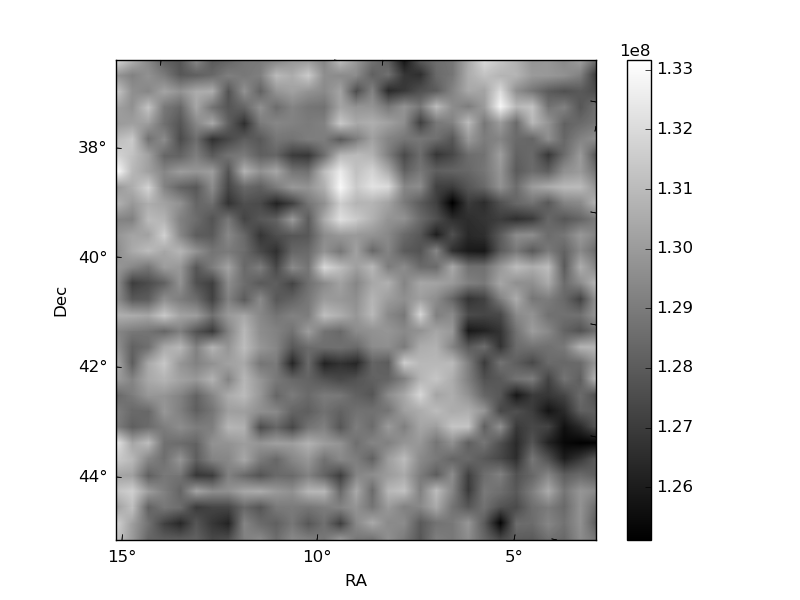
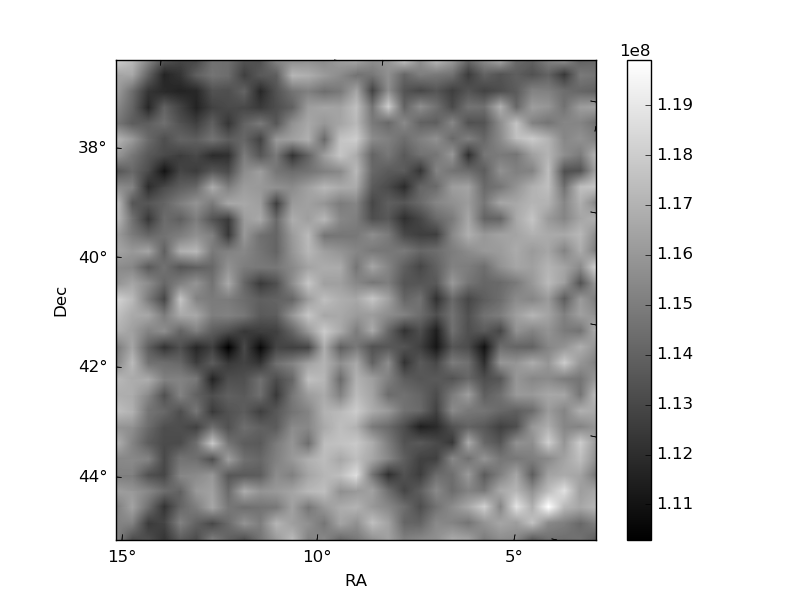
Histogram calculated using DETX and DETY for each event in the final _common_clean file
| Quadrant A | 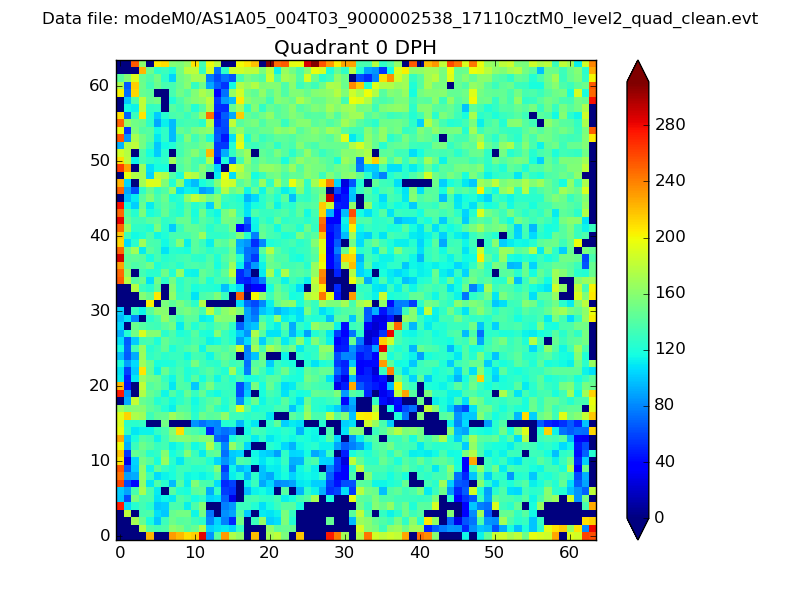 |
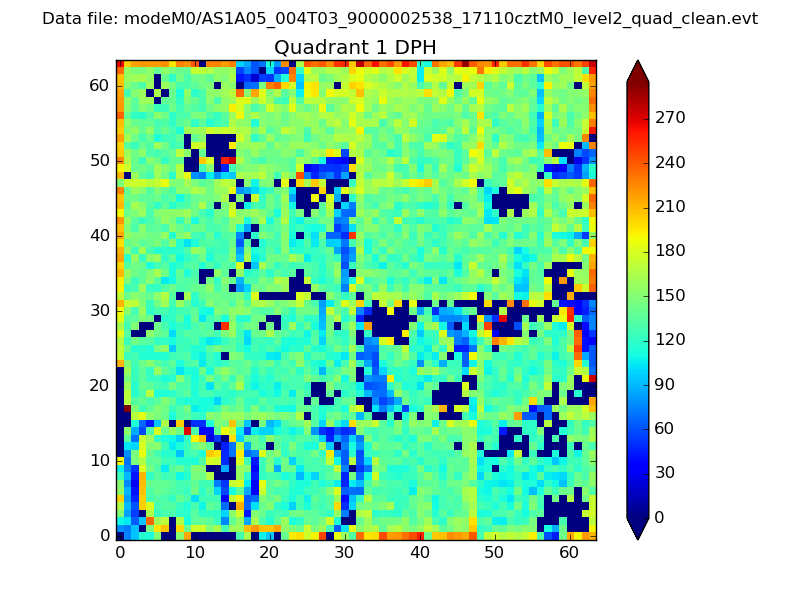 |
Quadrant B |
|---|---|---|---|
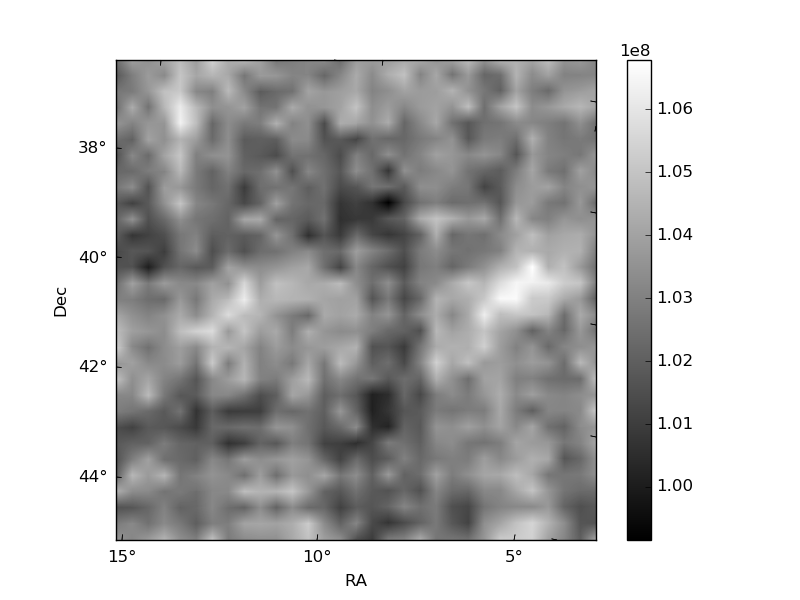
| Quadrant D | 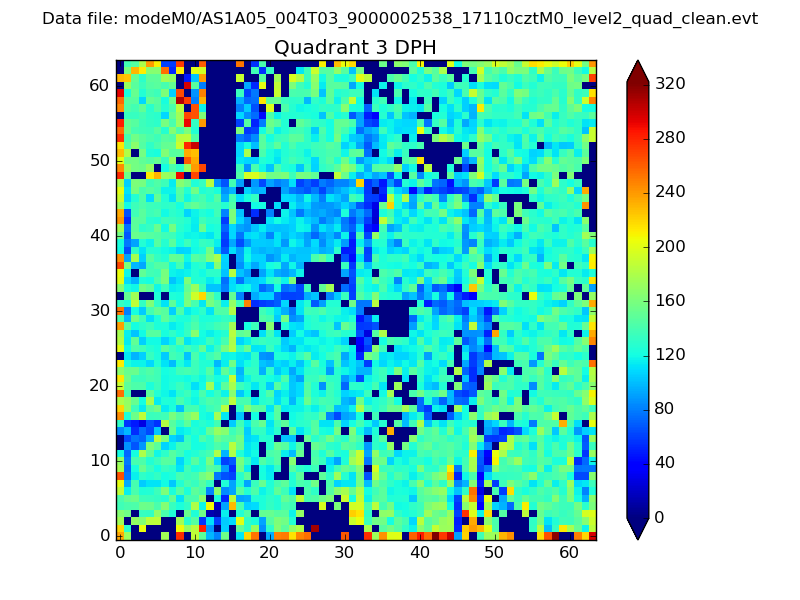 |
 |
Quadrant C |
| Plot type | Count rate plots | Images |
|---|---|---|
| Comparison with Poisson distribution Blue bars denote a histogram of data divided into 1 sec bins. Red curve is a Poisson curve with rate = median count rate of data. |
 |
 |
| Quadrant-wise count rates Data is divided into 100 sec bins |
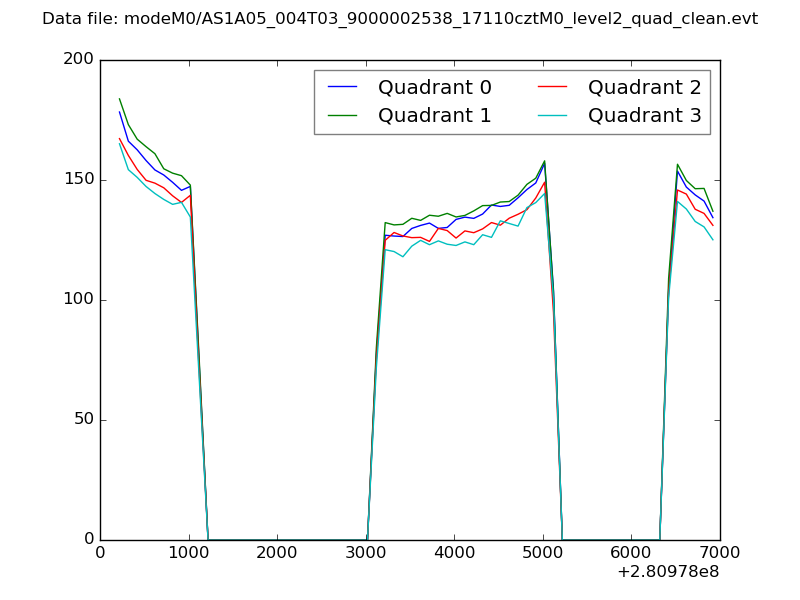 |
|
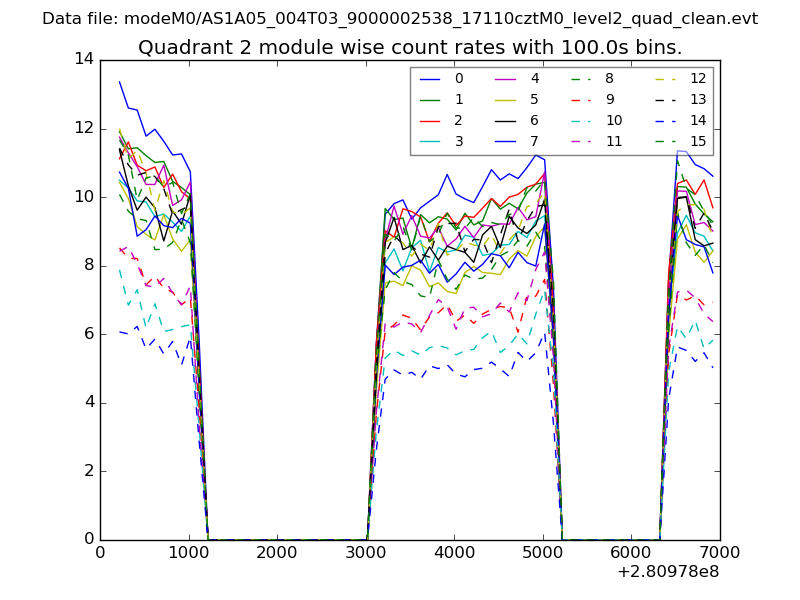
| Module-wise count rates for Quadrant A Data is divided into 100 sec bins |
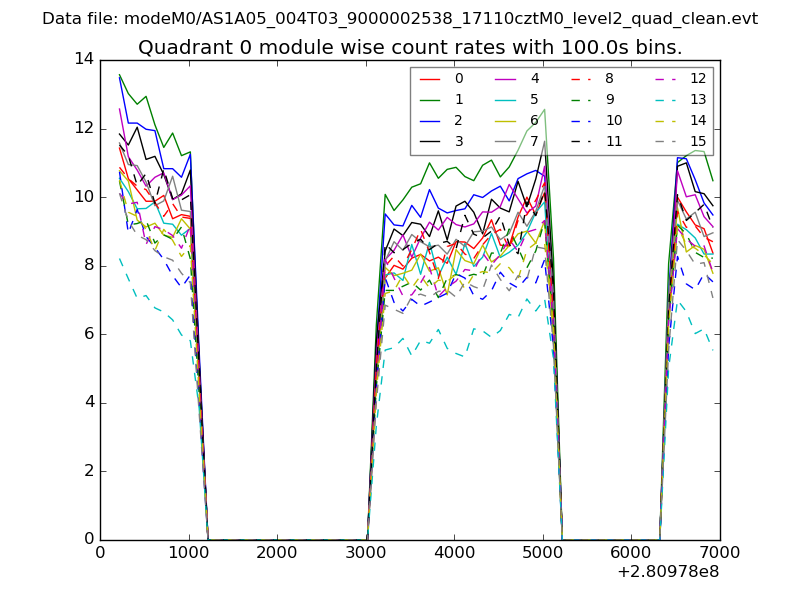 |
 |
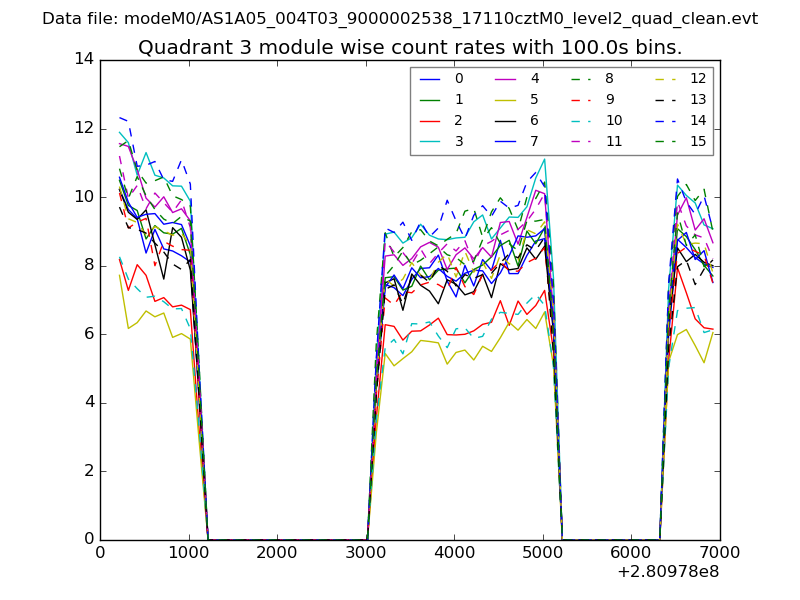
| Module-wise count rates for Quadrant B Data is divided into 100 sec bins |
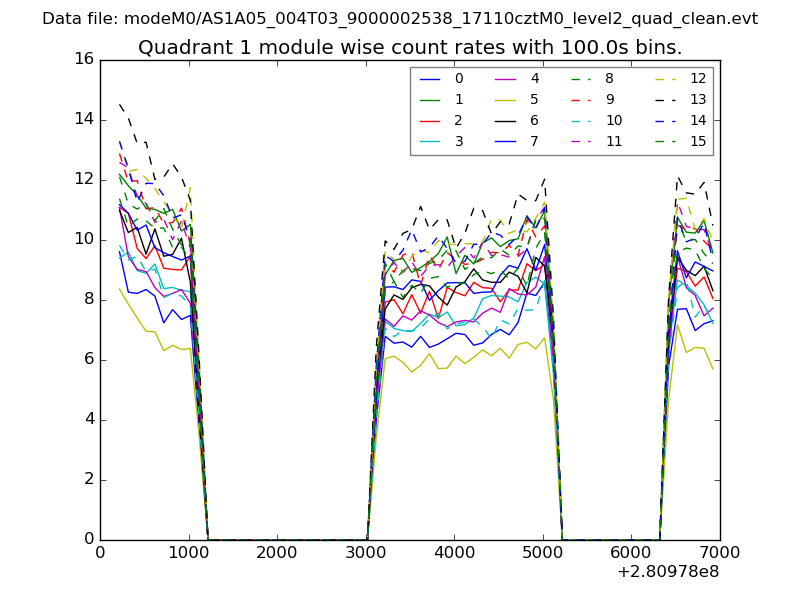 |
 |
| Module-wise count rates for Quadrant C Data is divided into 100 sec bins |
 |
 |
| Module-wise count rates for Quadrant D Data is divided into 100 sec bins |
 |
 |
| Parameter | Plot |
|---|---|
| CZT HV Monitor | 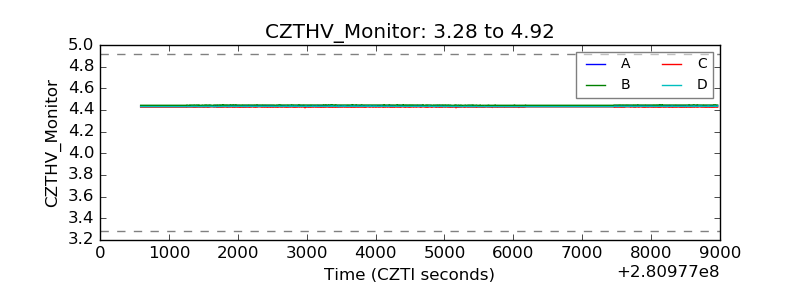 |
| D_VDD | 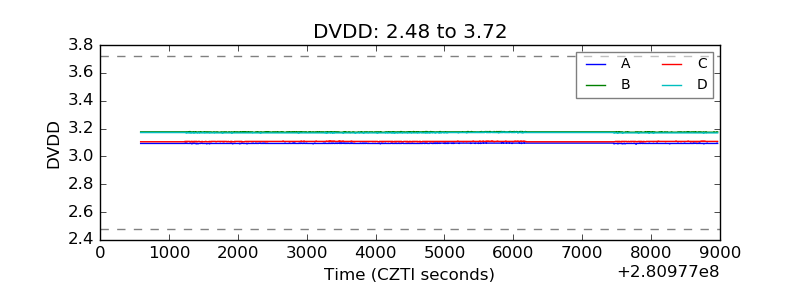 |
| Temperature 1 | 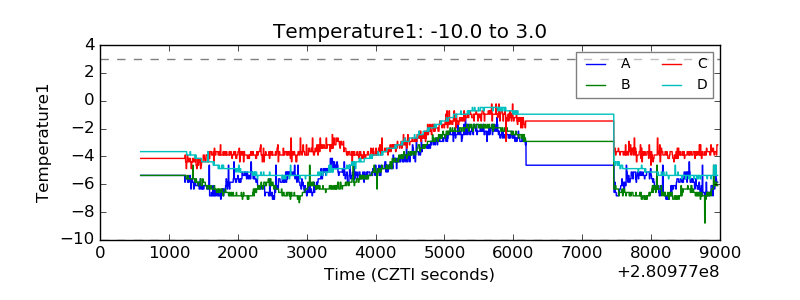 |
| Veto HV Monitor |  |
| Veto LLD | 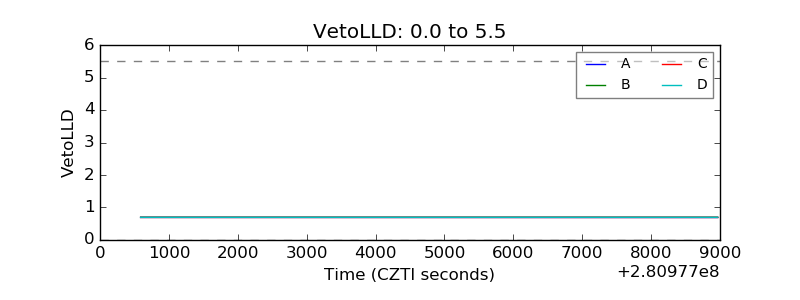 |
| Alpha Counter | 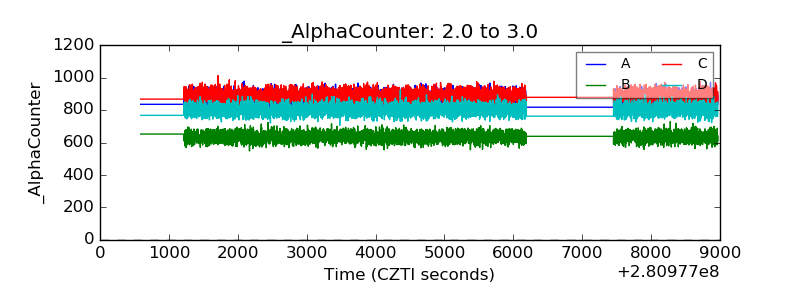 |
| _CPM_Rate | 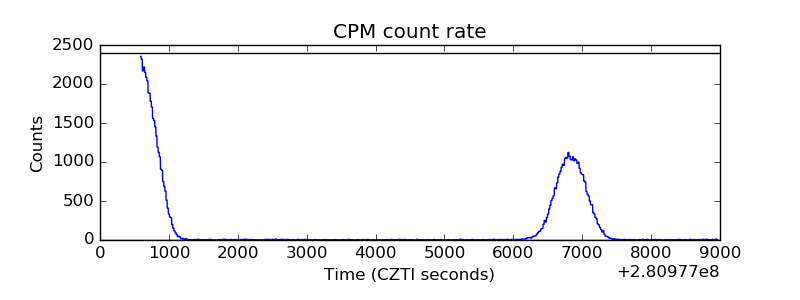 |
| CZT Counter | 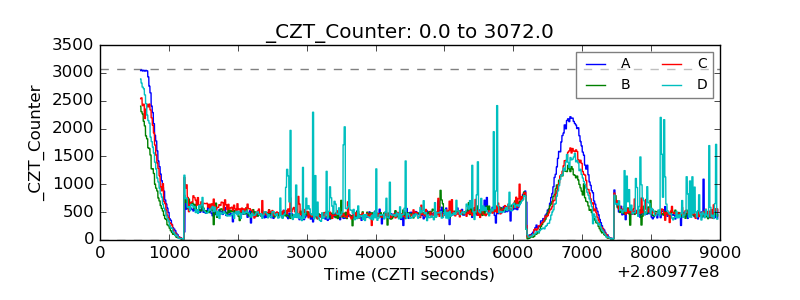 |
| +2.5 Volts monitor | 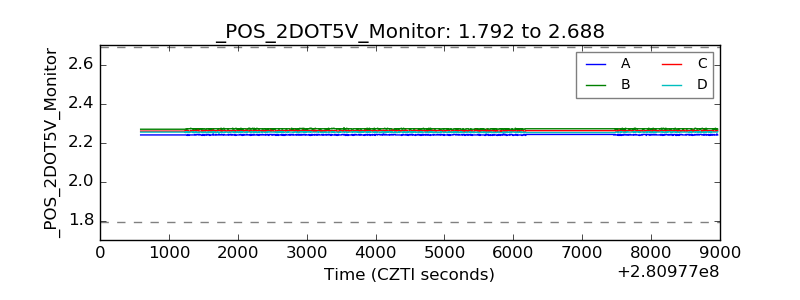 |
| +5 Volts monitor |  |
| _ROLL_ROT | 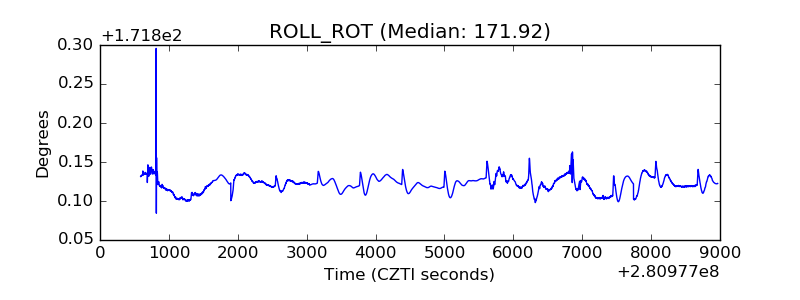 |
| _Roll_DEC | 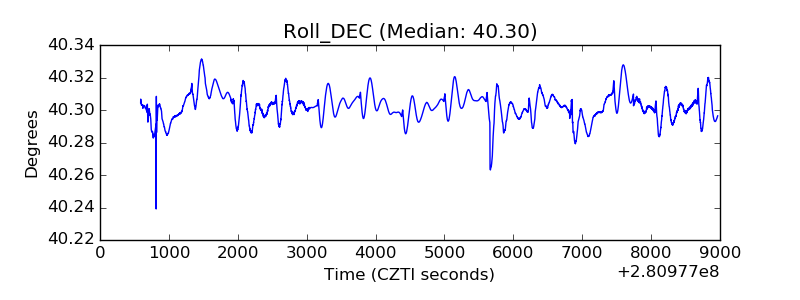 |
| _Roll_RA | 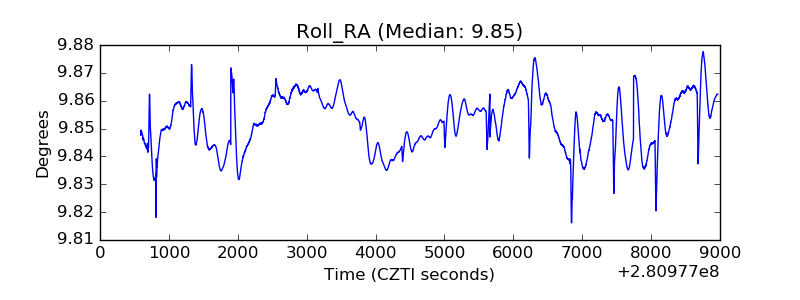 |
| Veto Counter | 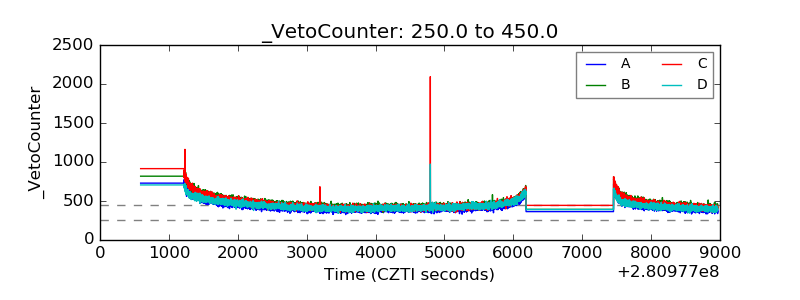 |