| Param | Original file | Final file |
|---|---|---|
| Filename | modeM0/AS1A05_004T03_9000002538_17113cztM0_level2.evt | modeM0/AS1A05_004T03_9000002538_17113cztM0_level2_quad_clean.evt |
| Size (bytes) | 594,573,120 | 92,989,440 |
| Size | 567.0 MB | 88.7 MB |
| Events in quadrant A | 3,872,628 | 576,444 |
| Events in quadrant B | 4,015,370 | 582,253 |
| Events in quadrant C | 4,283,689 | 557,336 |
| Events in quadrant D | 5,273,807 | 525,269 |
| Mode SS | |||
|---|---|---|---|
| Quadrant | BADHDUFLAG | Total packets | Discarded packets |
| A | 0 | 170 | 0 |
| B | 0 | 170 | 0 |
| C | 0 | 170 | 0 |
| D | 0 | 170 | 0 |
| Mode M0 | |||
|---|---|---|---|
| Quadrant | BADHDUFLAG | Total packets | Discarded packets |
| A | 0 | 17143 | 3 |
| B | 0 | 17278 | 3 |
| C | 0 | 17758 | 3 |
| D | 0 | 21389 | 3 |
| Mode M9 | |||
|---|---|---|---|
| Quadrant | BADHDUFLAG | Total packets | Discarded packets |
| A | 0 | 6 | 0 |
| B | 0 | 6 | 0 |
| C | 0 | 6 | 0 |
| D | 0 | 6 | 0 |
| Quadrant | Total seconds | Saturated seconds | Saturation percentage |
|---|---|---|---|
| A | 8266 | 199 | 2.407452% |
| B | 8266 | 239 | 2.891362% |
| C | 8266 | 260 | 3.145415% |
| D | 8266 | 578 | 6.992499% |
Noise dominated data is calculated using 1-second bins in cleaned event files. If a bin has >2000 counts, and if more than 50% of those come from <1% of pixels, then it is considered to be noise-dominated and hence unusable.
| Quadrant | # 1 sec bins | Bins with >0 counts | Bins with >2000 counts | High rate bins dominated by noise | Noise dominated (total time) | Noise dominated (detector-on time) | Marked lightcurve |
|---|---|---|---|---|---|---|---|
| A | 8976 | 8269 | 1 | 1 | 0.01% | 0.01% | 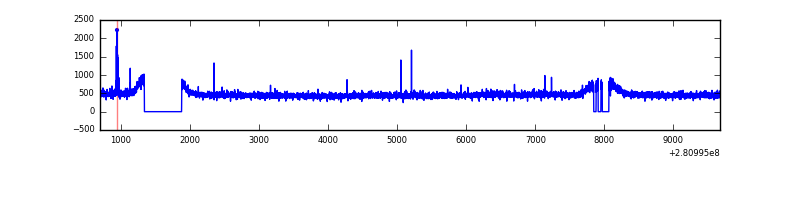 |
| B | 8976 | 8270 | 1 | 1 | 0.01% | 0.01% | 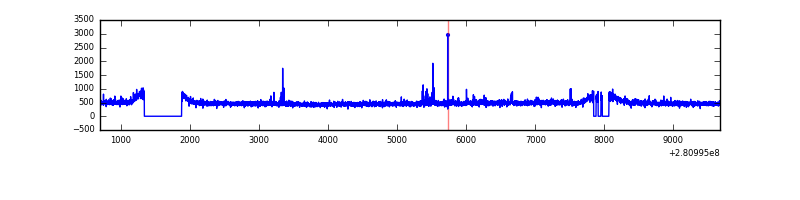 |
| C | 8976 | 8269 | 0 | 0 | 0.00% | 0.00% | 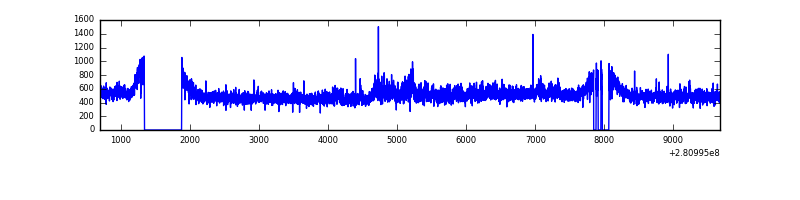 |
| D | 8976 | 8270 | 374 | 374 | 4.17% | 4.52% | 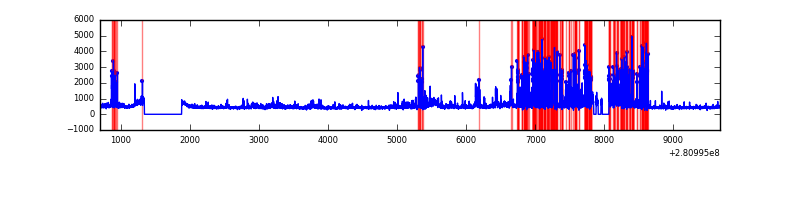 |
Top three noisy pixels from each quadrant. If the there are fewer than three noisy pixels in the level2.evt file, extra rows are filled as -1
| Pixel properties | Quadrant properties | ||||||
|---|---|---|---|---|---|---|---|
| Quadrant | DetID | PixID | Counts | Sigma | Mean | Median | Sigma |
| A | 4 | 2 | 27829 | 132.16 | 999 | 975 | 203.2 |
| A | 0 | 226 | 8714 | 38.09 | 999 | 975 | 203.2 |
| A | 3 | 137 | 7498 | 32.1 | 999 | 975 | 203.2 |
| B | 12 | 111 | 23435 | 115.83 | 1001 | 973 | 193.9 |
| B | 0 | 190 | 20556 | 100.99 | 1001 | 973 | 193.9 |
| B | 11 | 111 | 20001 | 98.12 | 1001 | 973 | 193.9 |
| C | 3 | 233 | 368029 | 1610.77 | 962 | 966 | 227.9 |
| C | 14 | 238 | 148337 | 646.7 | 962 | 966 | 227.9 |
| C | 9 | 160 | 7621 | 29.2 | 962 | 966 | 227.9 |
| D | 5 | 222 | 1488722 | 6520.02 | 937 | 909 | 228.2 |
| D | 11 | 176 | 115926 | 504.04 | 937 | 909 | 228.2 |
| D | 10 | 70 | 35357 | 150.96 | 937 | 909 | 228.2 |
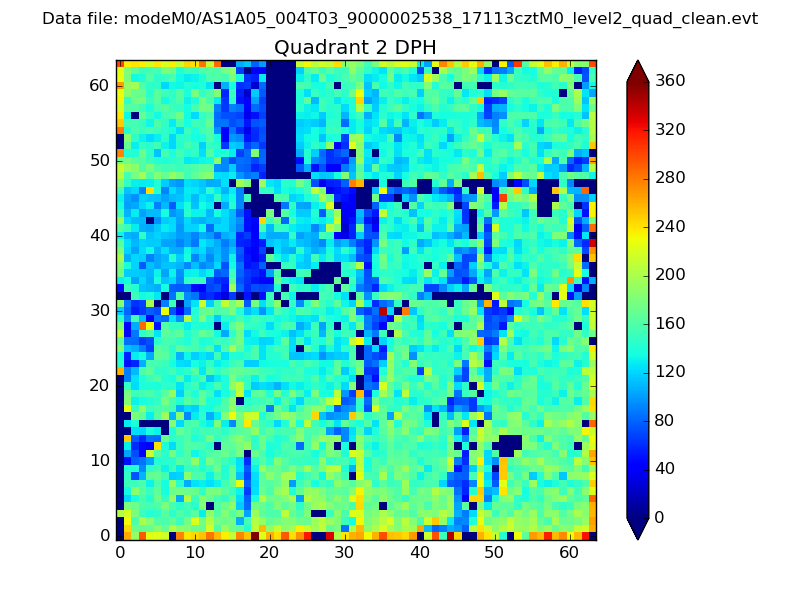
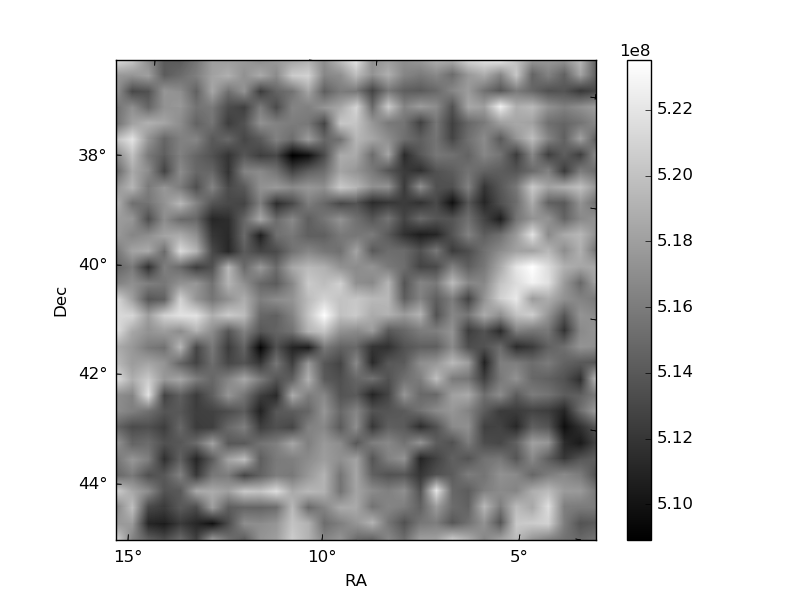
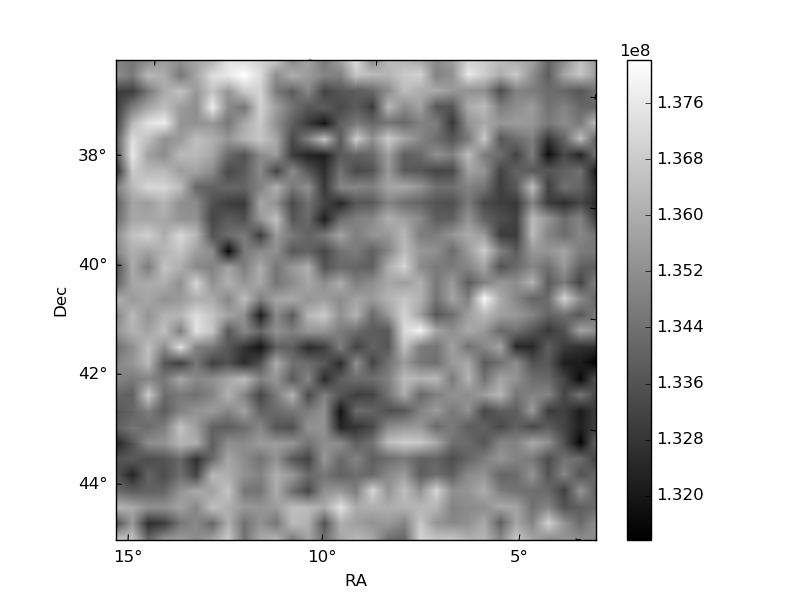
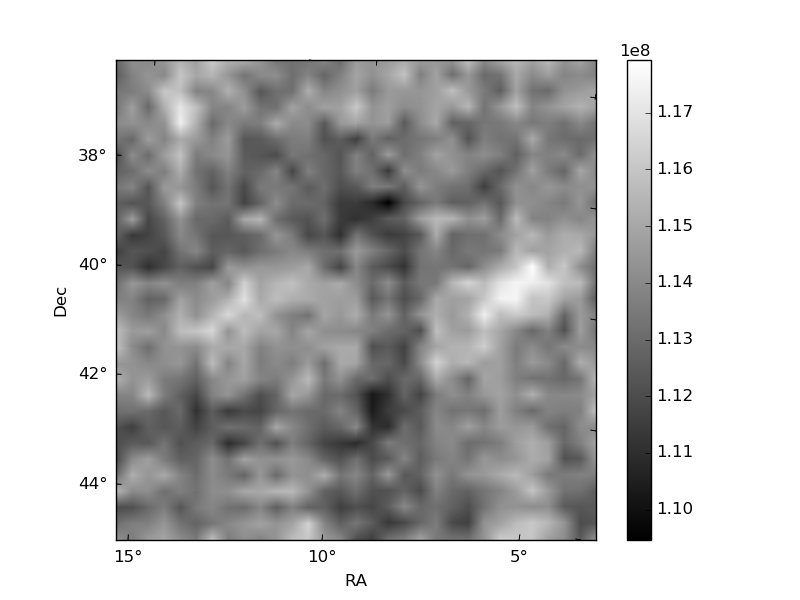
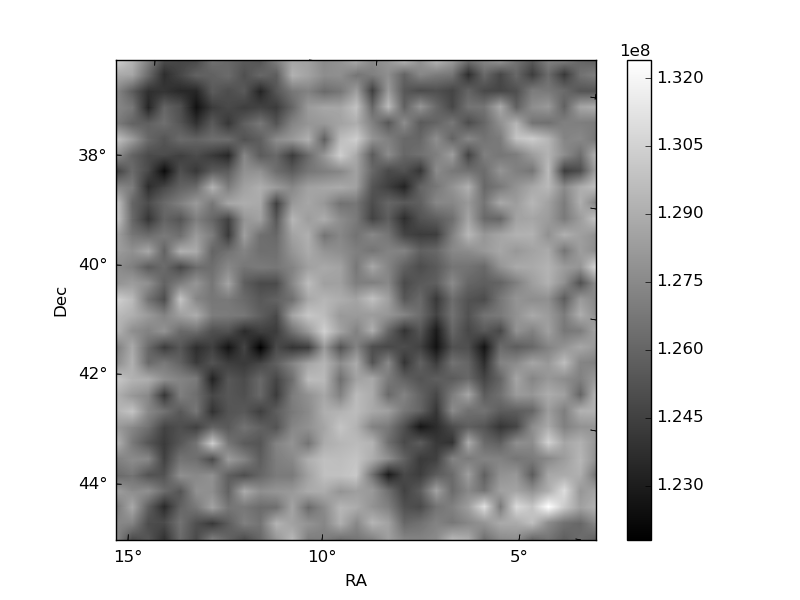
Histogram calculated using DETX and DETY for each event in the final _common_clean file
| Quadrant A | 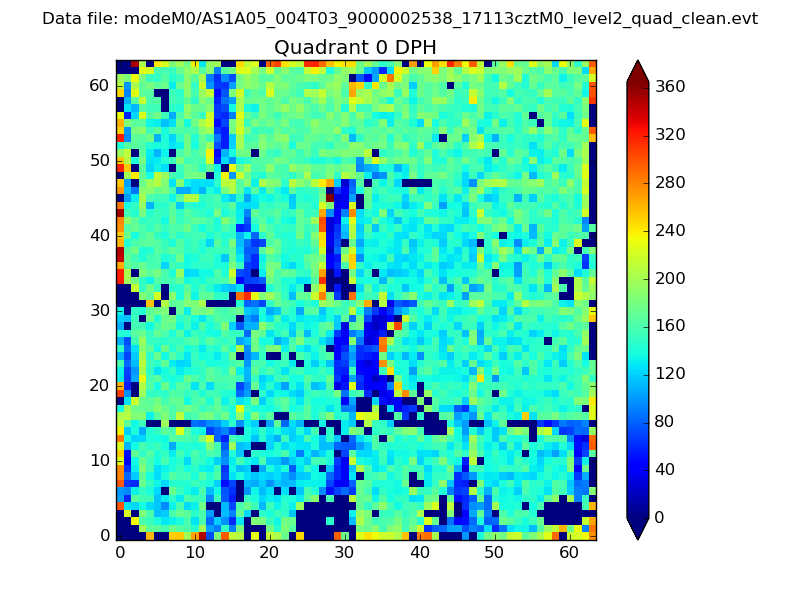 |
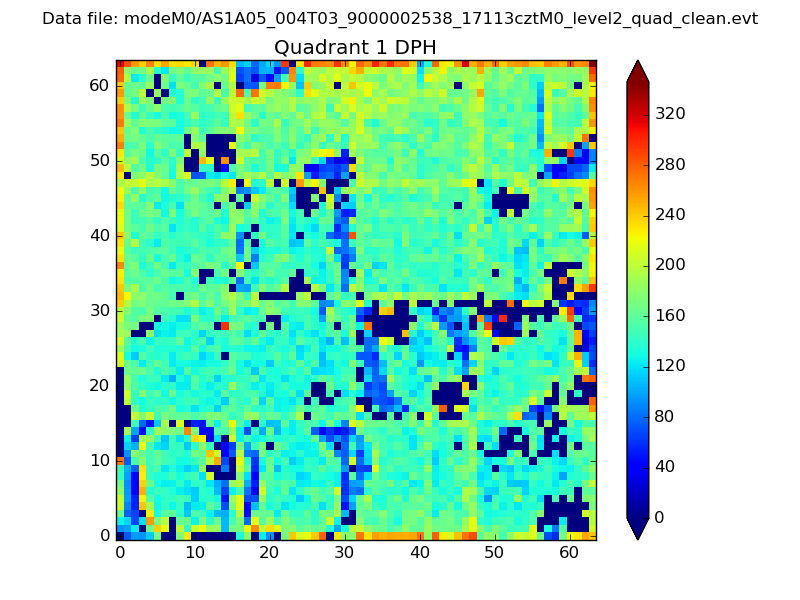 |
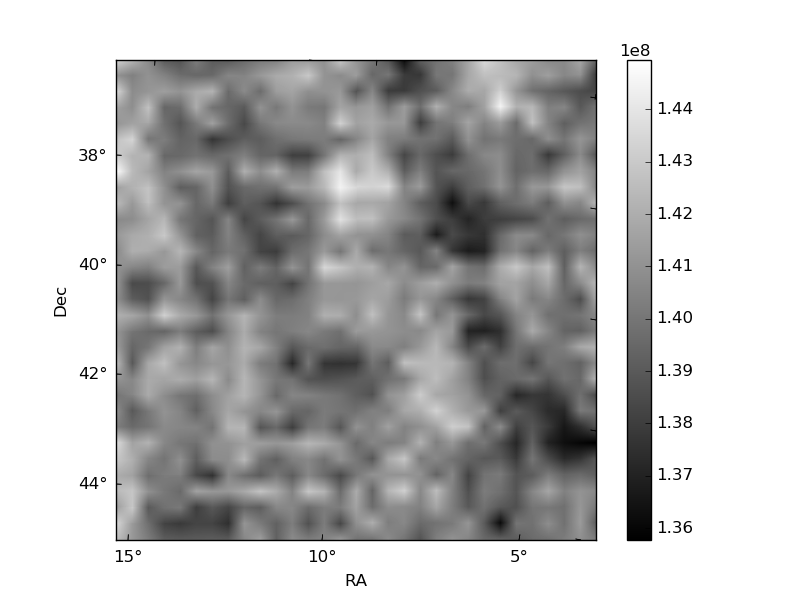
Quadrant B |
|---|---|---|---|
| Quadrant D | 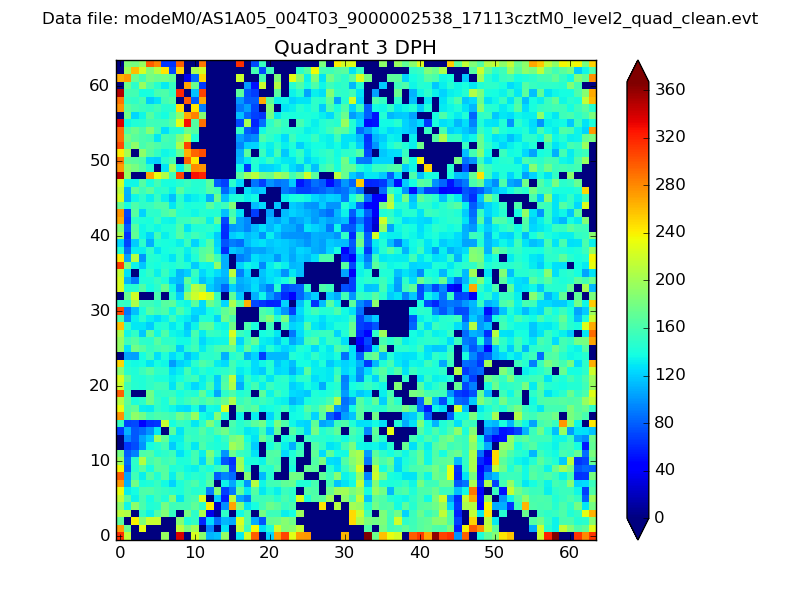 |
 |
Quadrant C |
| Plot type | Count rate plots | Images |
|---|---|---|
| Comparison with Poisson distribution Blue bars denote a histogram of data divided into 1 sec bins. Red curve is a Poisson curve with rate = median count rate of data. |
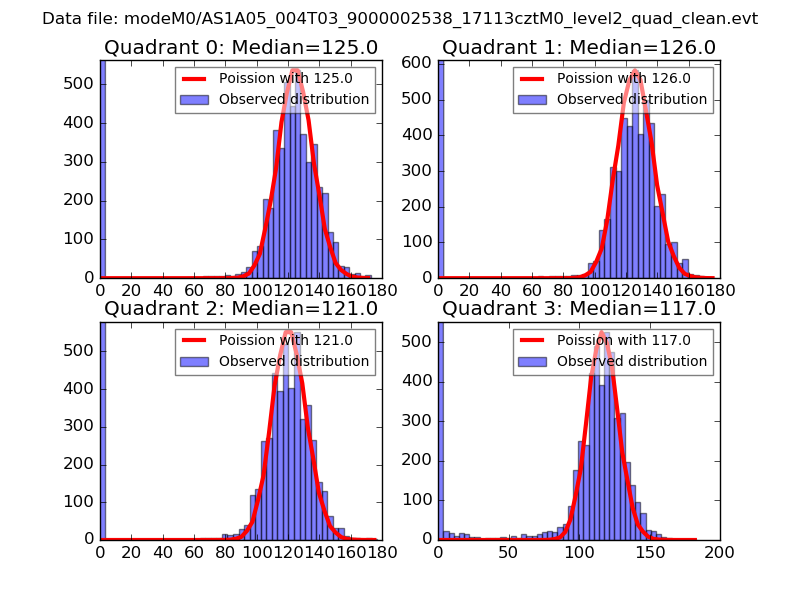 |
 |
| Quadrant-wise count rates Data is divided into 100 sec bins |
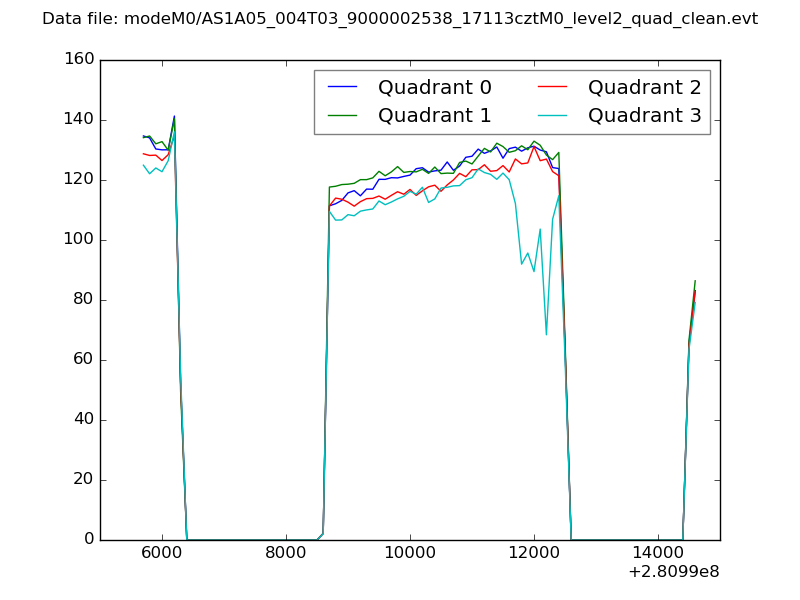 |
|
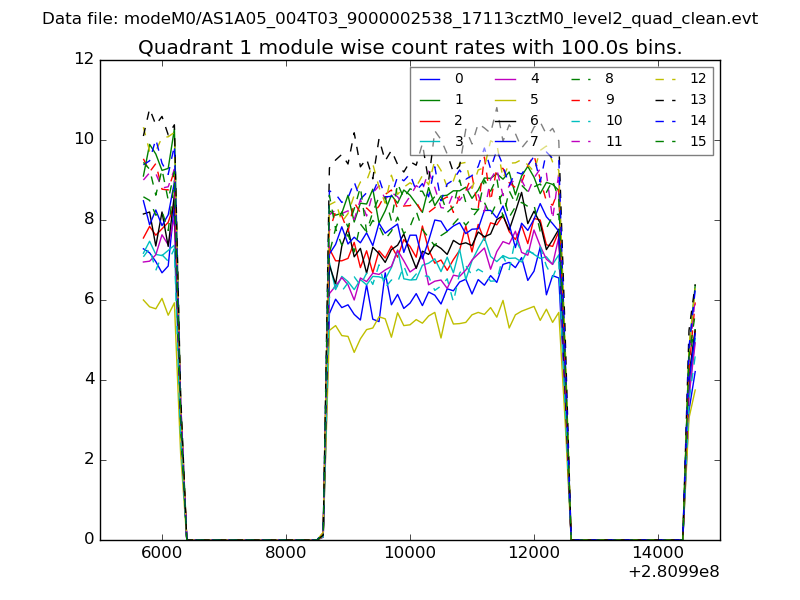
| Module-wise count rates for Quadrant A Data is divided into 100 sec bins |
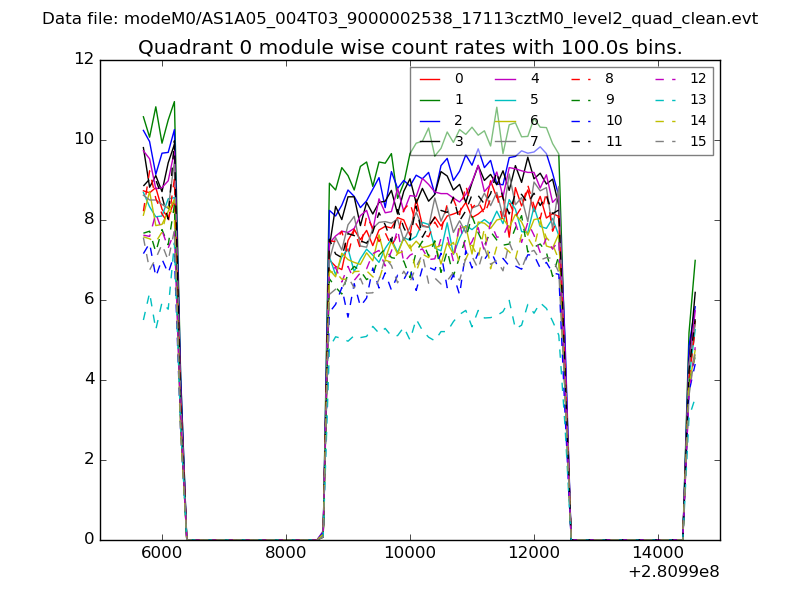 |
 |
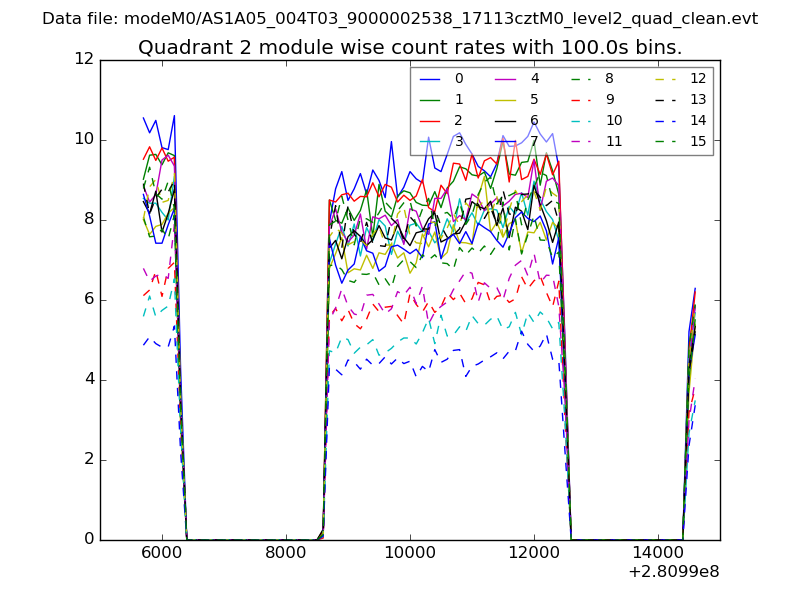
| Module-wise count rates for Quadrant B Data is divided into 100 sec bins |
 |
 |
| Module-wise count rates for Quadrant C Data is divided into 100 sec bins |
 |
 |
| Module-wise count rates for Quadrant D Data is divided into 100 sec bins |
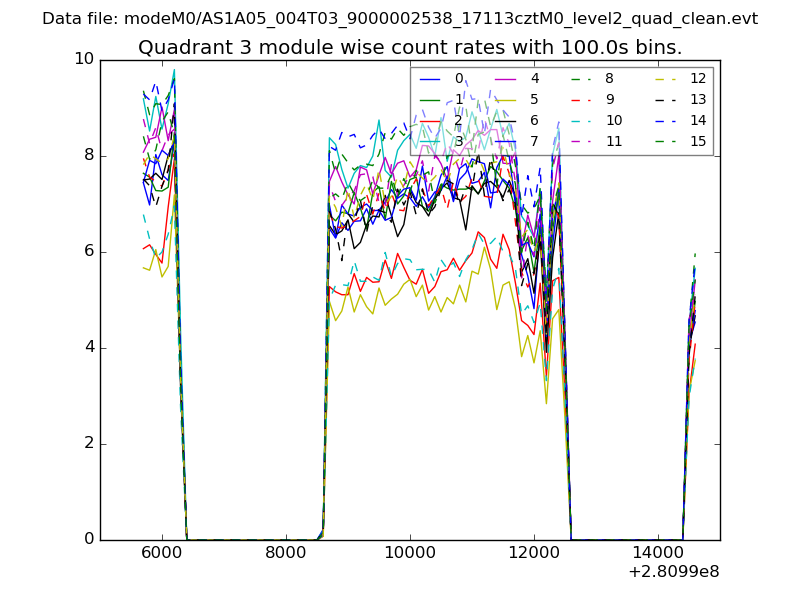 |
 |
| Parameter | Plot |
|---|---|
| CZT HV Monitor | 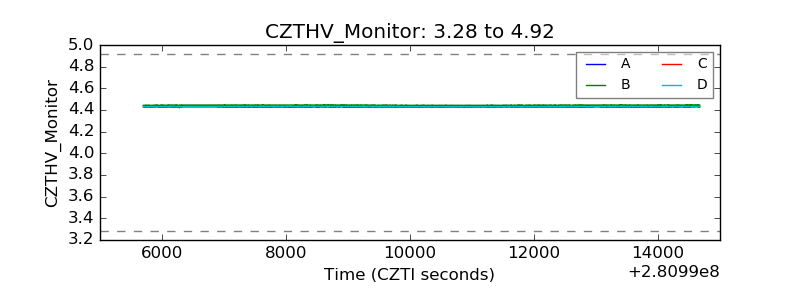 |
| D_VDD | 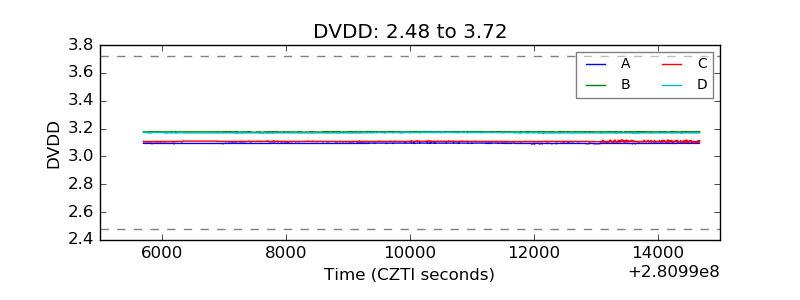 |
| Temperature 1 | 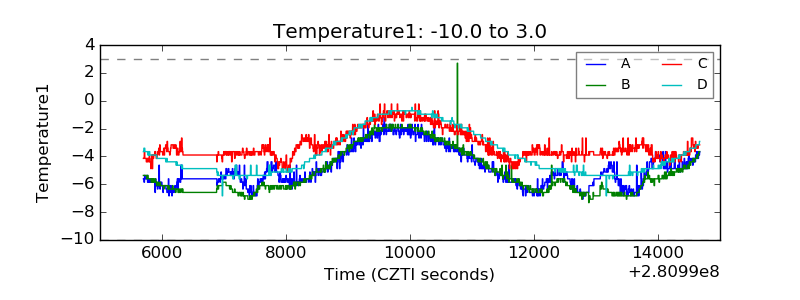 |
| Veto HV Monitor | 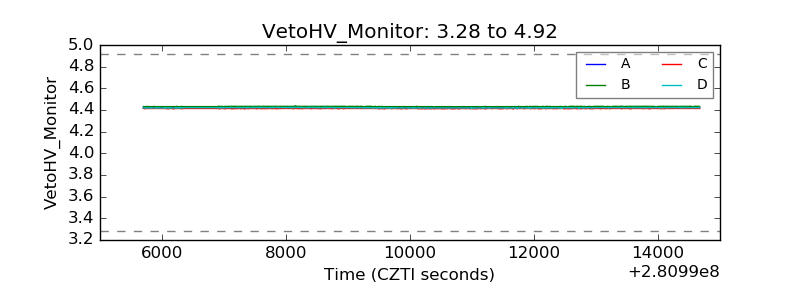 |
| Veto LLD | 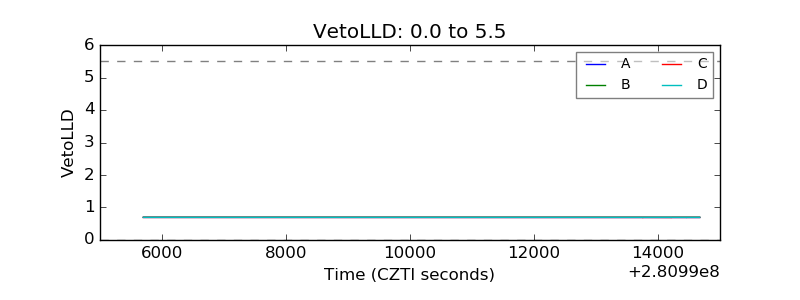 |
| Alpha Counter | 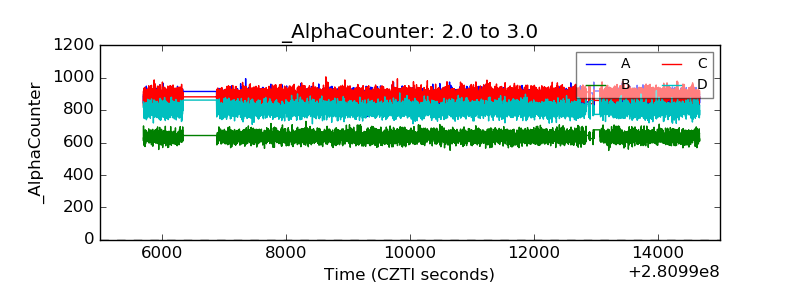 |
| _CPM_Rate |  |
| CZT Counter | 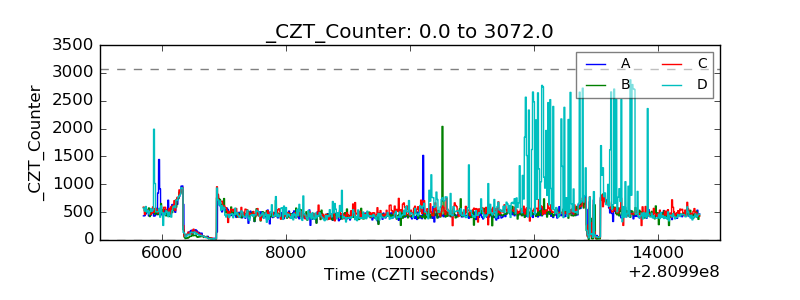 |
| +2.5 Volts monitor |  |
| +5 Volts monitor |  |
| _ROLL_ROT | 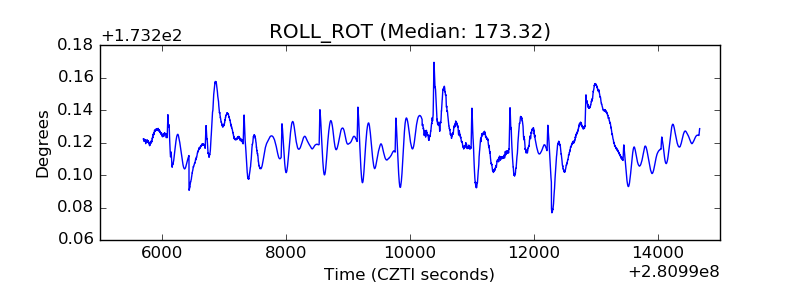 |
| _Roll_DEC | 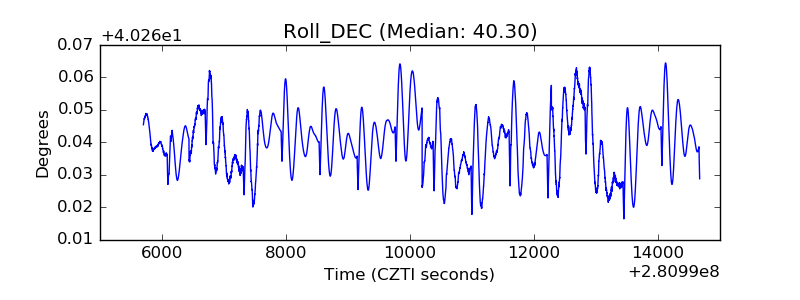 |
| _Roll_RA | 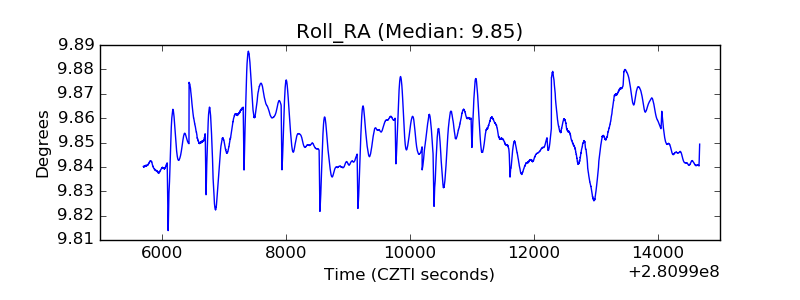 |
| Veto Counter | 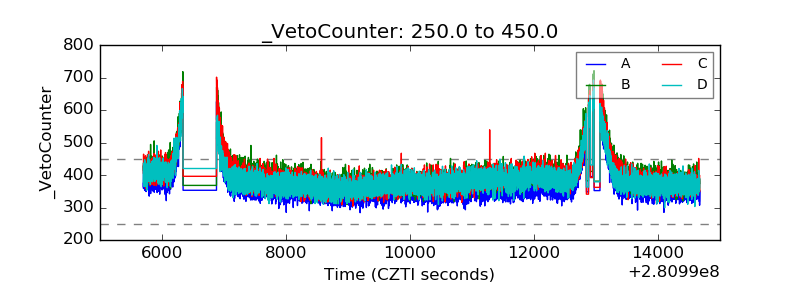 |