| Param | Original file | Final file |
|---|---|---|
| Filename | modeM0/AS1A05_004T03_9000002538_17114cztM0_level2.evt | modeM0/AS1A05_004T03_9000002538_17114cztM0_level2_quad_clean.evt |
| Size (bytes) | 576,132,480 | 92,041,920 |
| Size | 549.4 MB | 87.8 MB |
| Events in quadrant A | 3,851,833 | 563,494 |
| Events in quadrant B | 4,144,091 | 571,516 |
| Events in quadrant C | 4,216,358 | 546,562 |
| Events in quadrant D | 4,673,617 | 530,701 |
| Mode SS | |||
|---|---|---|---|
| Quadrant | BADHDUFLAG | Total packets | Discarded packets |
| A | 0 | 170 | 0 |
| B | 0 | 170 | 0 |
| C | 0 | 170 | 0 |
| D | 0 | 170 | 0 |
| Mode M0 | |||
|---|---|---|---|
| Quadrant | BADHDUFLAG | Total packets | Discarded packets |
| A | 0 | 17130 | 3 |
| B | 0 | 17695 | 3 |
| C | 0 | 17650 | 3 |
| D | 0 | 19780 | 3 |
| Mode M9 | |||
|---|---|---|---|
| Quadrant | BADHDUFLAG | Total packets | Discarded packets |
| A | 0 | 4 | 0 |
| B | 0 | 4 | 0 |
| C | 0 | 4 | 0 |
| D | 0 | 4 | 0 |
| Quadrant | Total seconds | Saturated seconds | Saturation percentage |
|---|---|---|---|
| A | 8281 | 288 | 3.477841% |
| B | 8282 | 355 | 4.286404% |
| C | 8282 | 307 | 3.706834% |
| D | 8282 | 511 | 6.170007% |
Noise dominated data is calculated using 1-second bins in cleaned event files. If a bin has >2000 counts, and if more than 50% of those come from <1% of pixels, then it is considered to be noise-dominated and hence unusable.
| Quadrant | # 1 sec bins | Bins with >0 counts | Bins with >2000 counts | High rate bins dominated by noise | Noise dominated (total time) | Noise dominated (detector-on time) | Marked lightcurve |
|---|---|---|---|---|---|---|---|
| A | 8651 | 8283 | 0 | 0 | 0.00% | 0.00% | 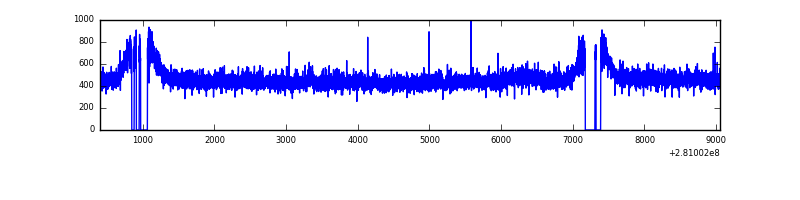 |
| B | 8652 | 8285 | 15 | 15 | 0.17% | 0.18% | 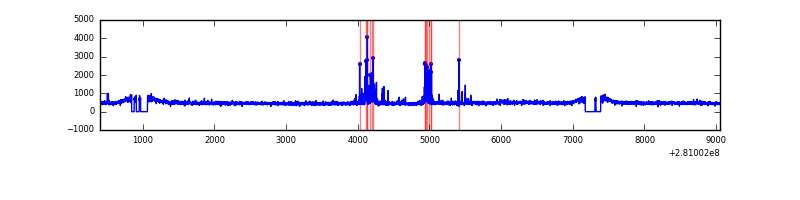 |
| C | 8652 | 8285 | 1 | 1 | 0.01% | 0.01% | 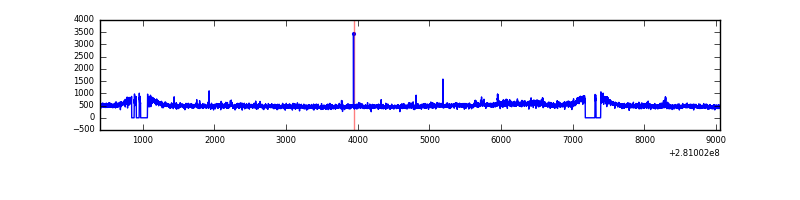 |
| D | 8652 | 8287 | 255 | 255 | 2.95% | 3.08% | 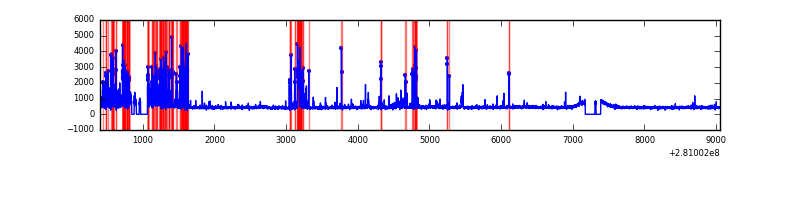 |
Top three noisy pixels from each quadrant. If the there are fewer than three noisy pixels in the level2.evt file, extra rows are filled as -1
| Pixel properties | Quadrant properties | ||||||
|---|---|---|---|---|---|---|---|
| Quadrant | DetID | PixID | Counts | Sigma | Mean | Median | Sigma |
| A | 0 | 226 | 8850 | 38.54 | 999 | 973 | 204.4 |
| A | 3 | 137 | 7574 | 32.29 | 999 | 973 | 204.4 |
| A | 12 | 194 | 7359 | 31.24 | 999 | 973 | 204.4 |
| B | 0 | 197 | 103065 | 533.93 | 998 | 972 | 191.2 |
| B | 7 | 220 | 51157 | 262.46 | 998 | 972 | 191.2 |
| B | 12 | 111 | 23385 | 117.22 | 998 | 972 | 191.2 |
| C | 3 | 233 | 299793 | 1333.17 | 958 | 964 | 224.1 |
| C | 14 | 238 | 146782 | 650.54 | 958 | 964 | 224.1 |
| C | 8 | 128 | 12056 | 49.48 | 958 | 964 | 224.1 |
| D | 5 | 222 | 961306 | 4115.52 | 950 | 922 | 233.4 |
| D | 11 | 176 | 33963 | 141.59 | 950 | 922 | 233.4 |
| D | 10 | 70 | 31716 | 131.96 | 950 | 922 | 233.4 |
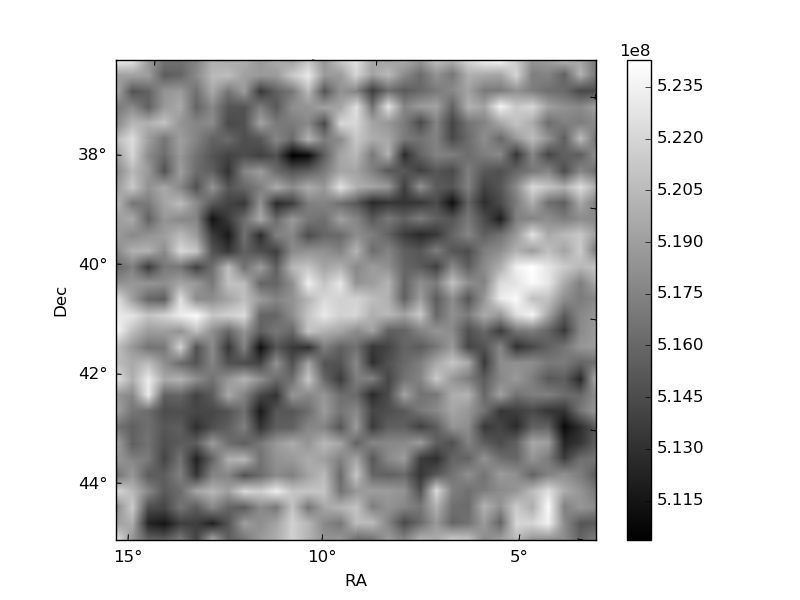
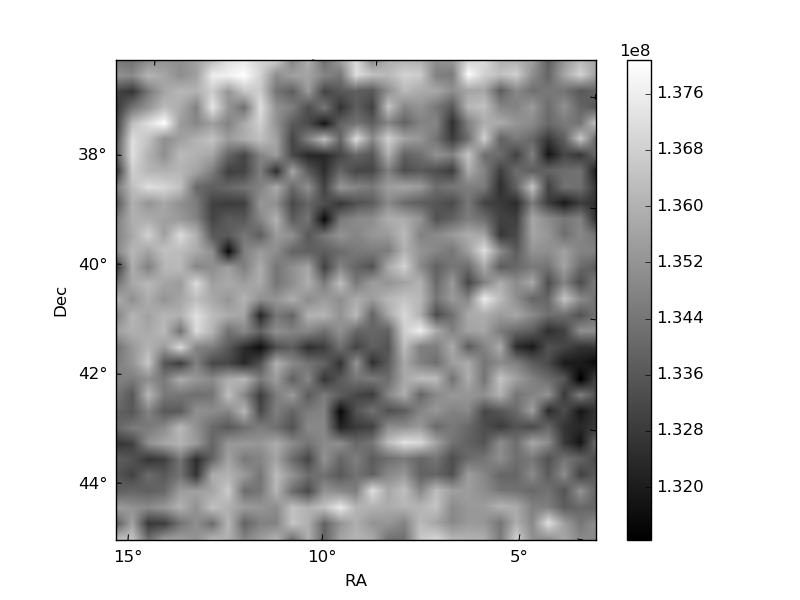
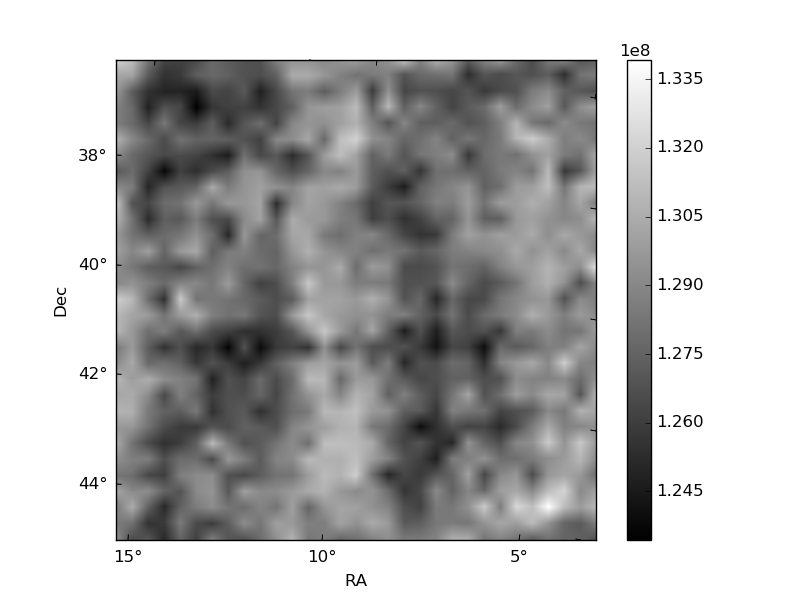
Histogram calculated using DETX and DETY for each event in the final _common_clean file
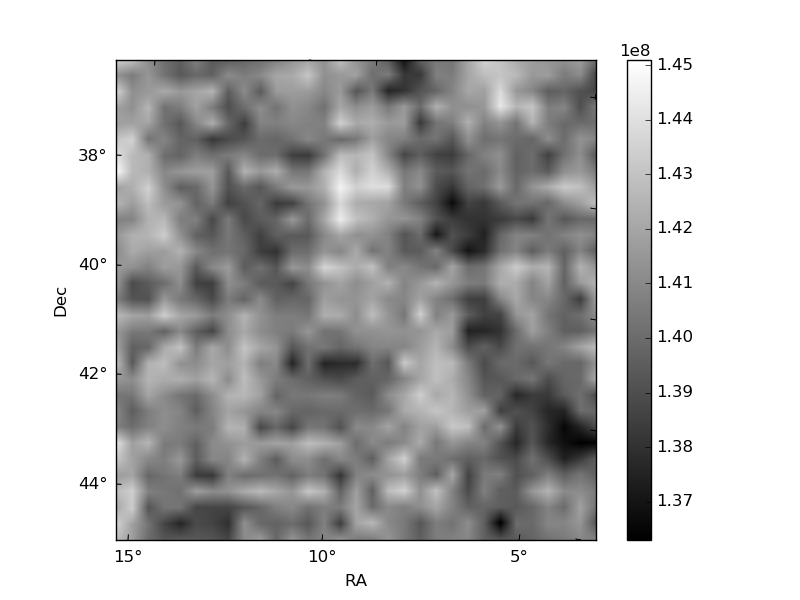
| Quadrant A | 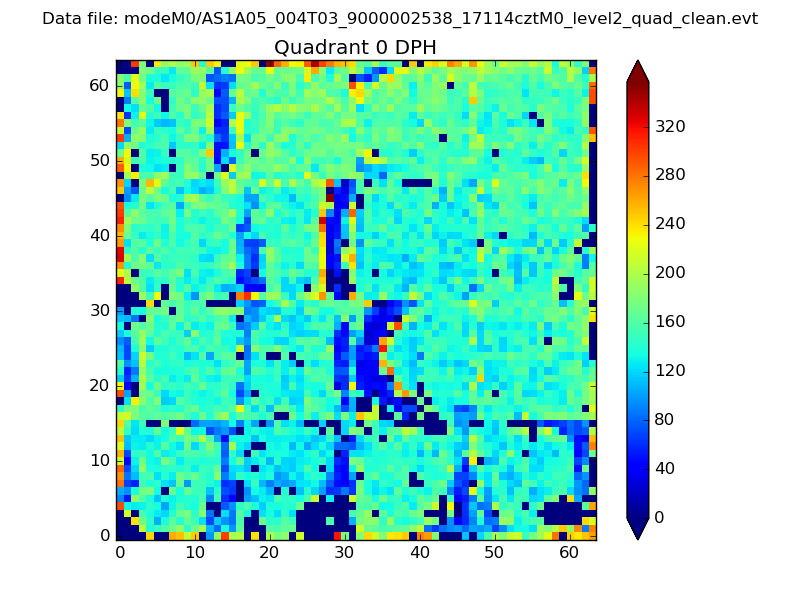 |
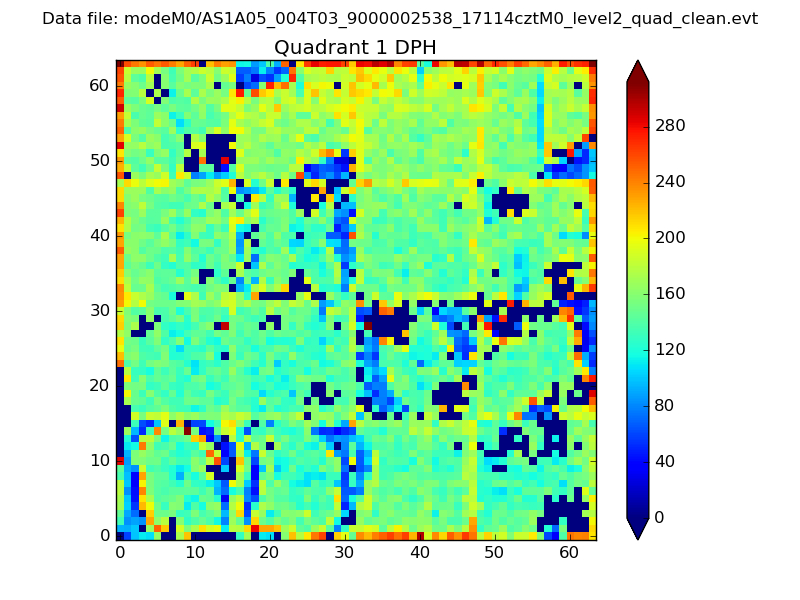 |
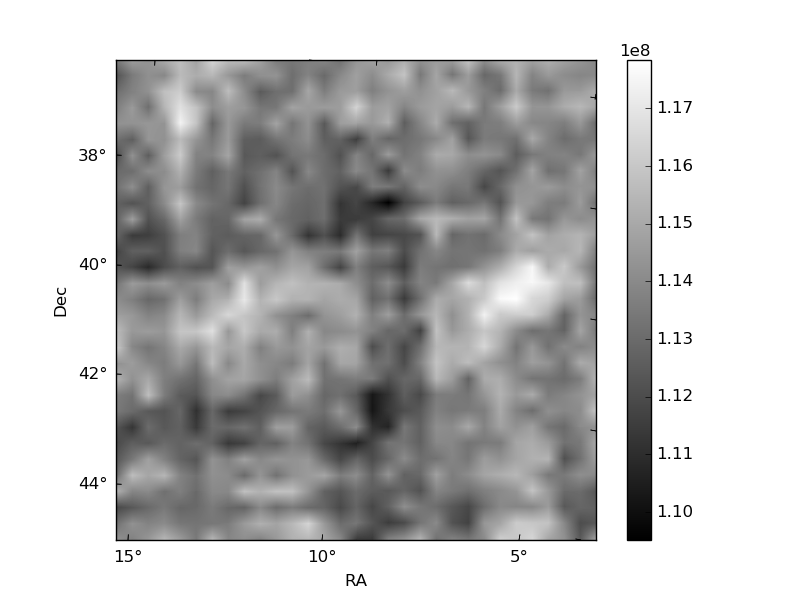
Quadrant B |
|---|---|---|---|
| Quadrant D | 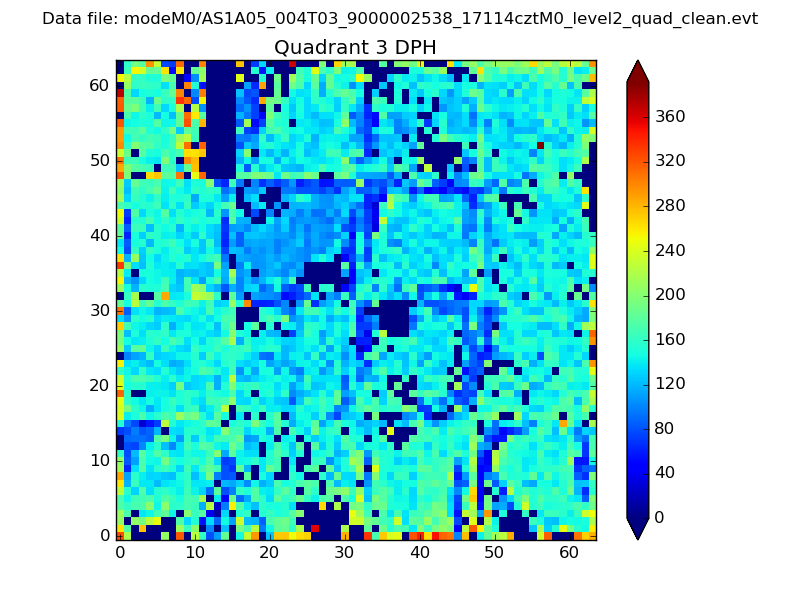 |
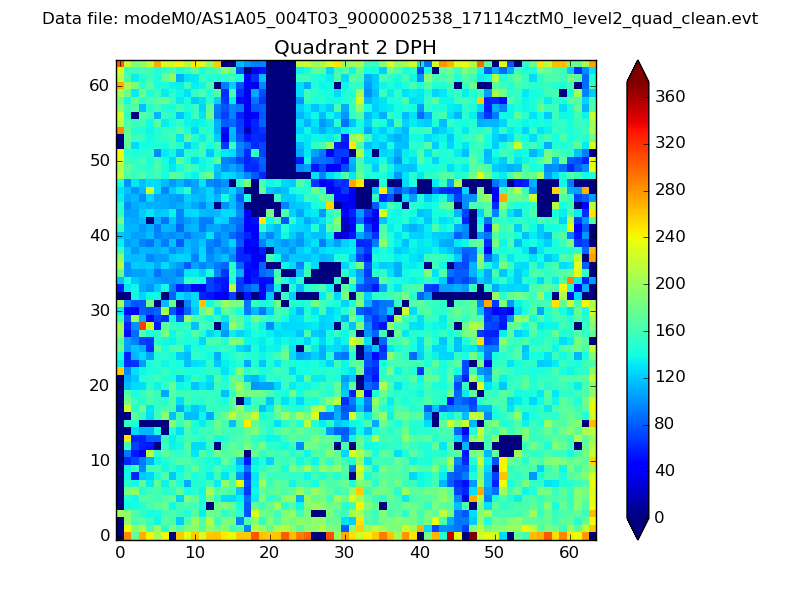 |
Quadrant C |
| Plot type | Count rate plots | Images |
|---|---|---|
| Comparison with Poisson distribution Blue bars denote a histogram of data divided into 1 sec bins. Red curve is a Poisson curve with rate = median count rate of data. |
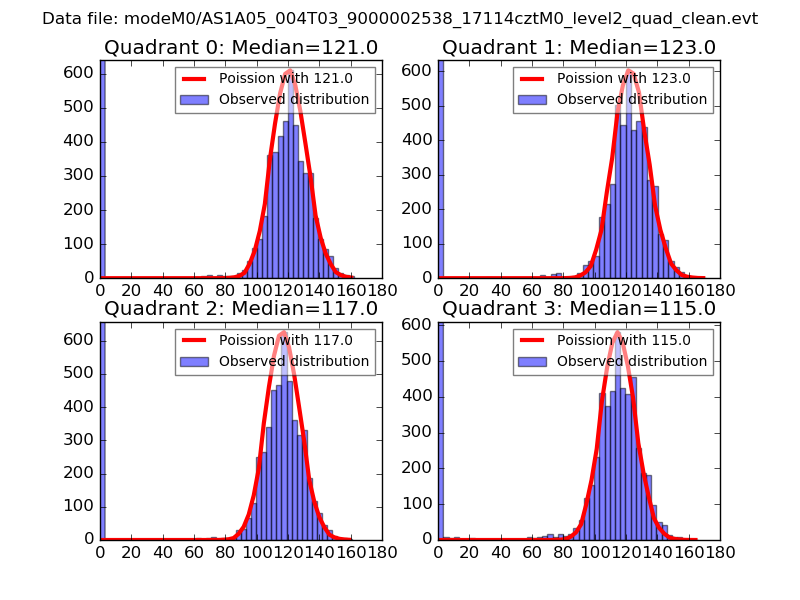 |
 |
| Quadrant-wise count rates Data is divided into 100 sec bins |
 |
|
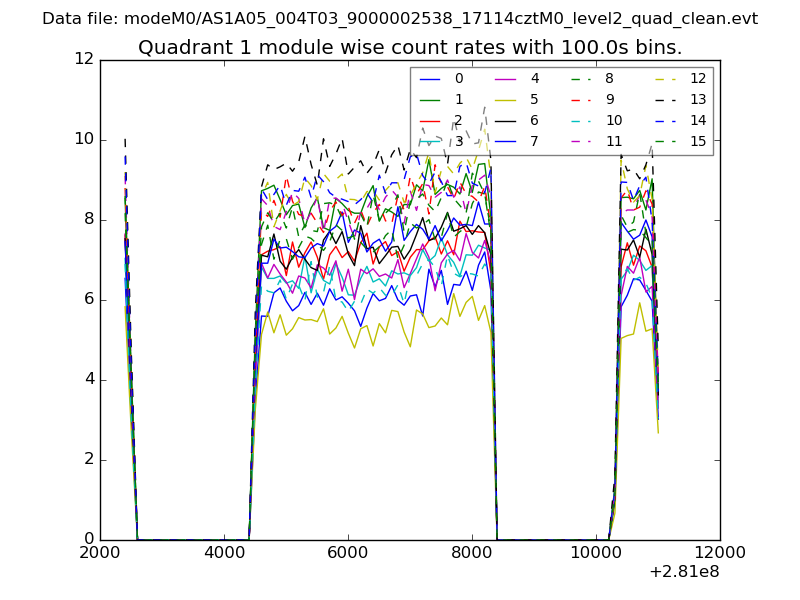
| Module-wise count rates for Quadrant A Data is divided into 100 sec bins |
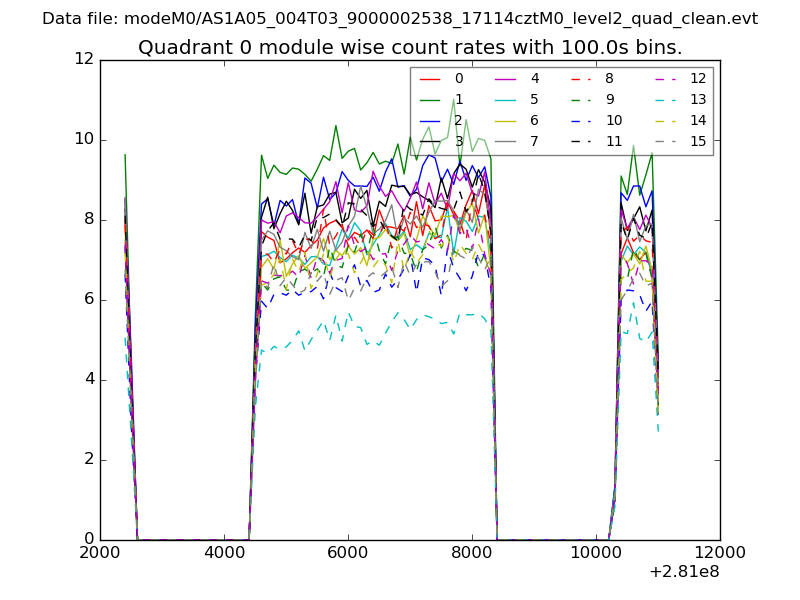 |
 |
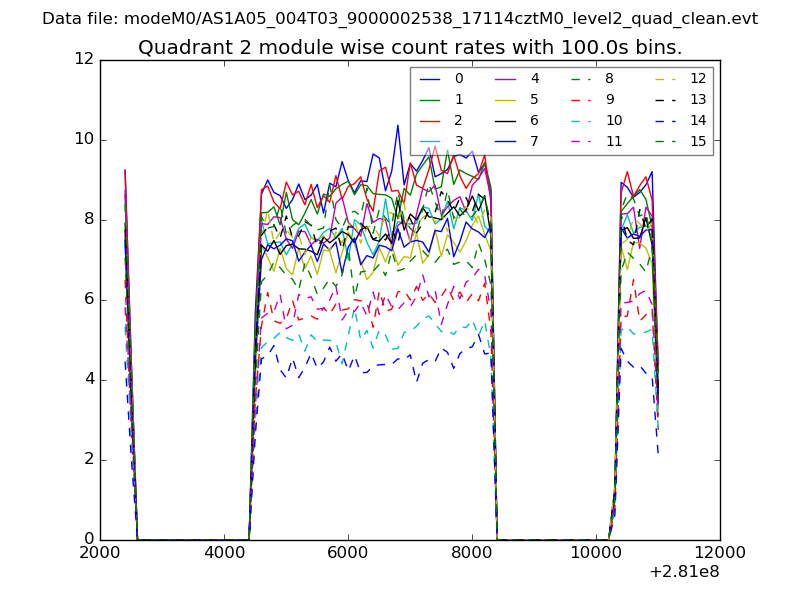
| Module-wise count rates for Quadrant B Data is divided into 100 sec bins |
 |
 |
| Module-wise count rates for Quadrant C Data is divided into 100 sec bins |
 |
 |
| Module-wise count rates for Quadrant D Data is divided into 100 sec bins |
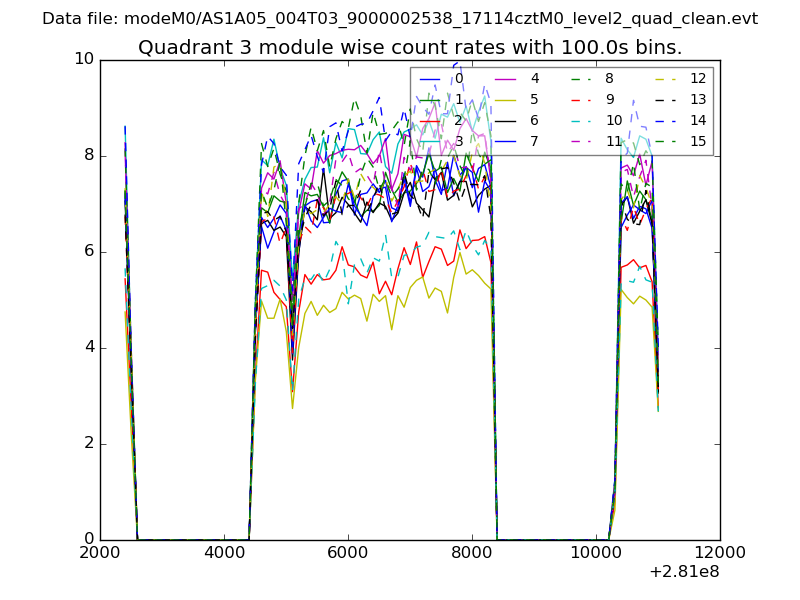 |
 |
| Parameter | Plot |
|---|---|
| CZT HV Monitor | 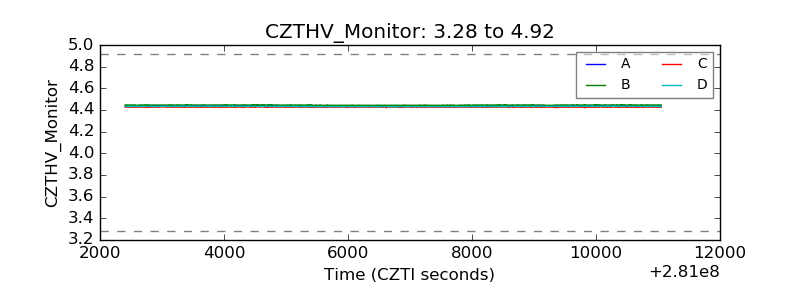 |
| D_VDD | 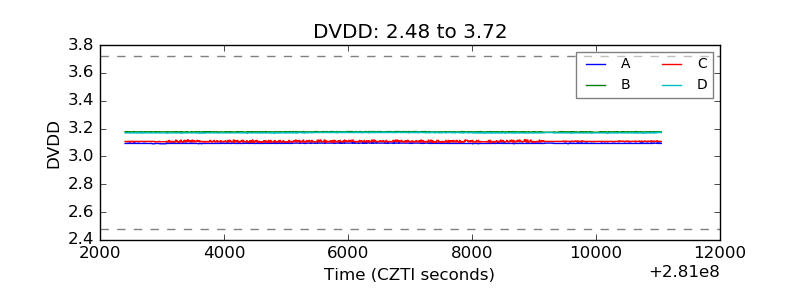 |
| Temperature 1 | 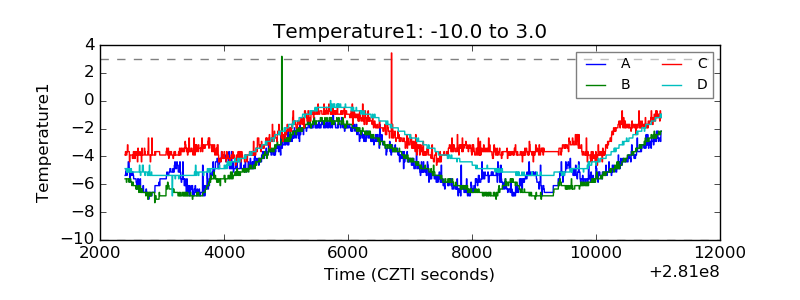 |
| Veto HV Monitor | 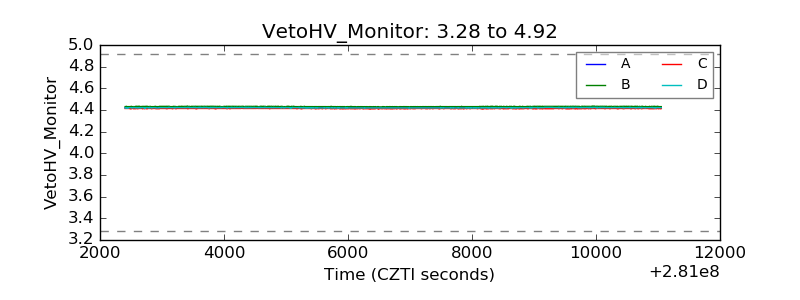 |
| Veto LLD | 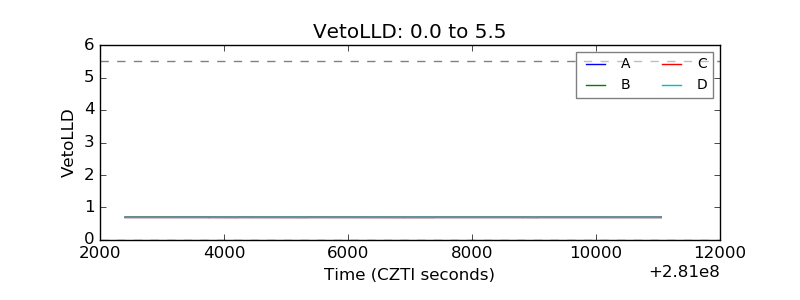 |
| Alpha Counter |  |
| _CPM_Rate |  |
| CZT Counter | 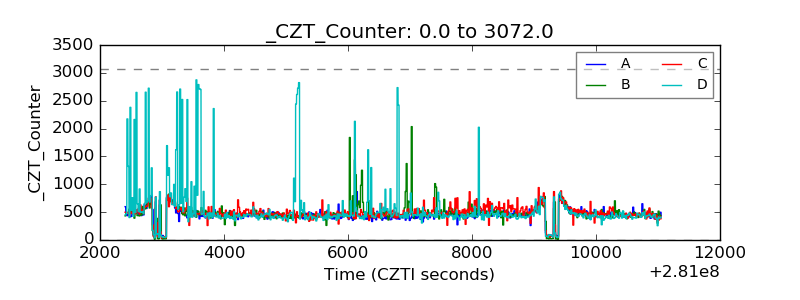 |
| +2.5 Volts monitor |  |
| +5 Volts monitor |  |
| _ROLL_ROT | 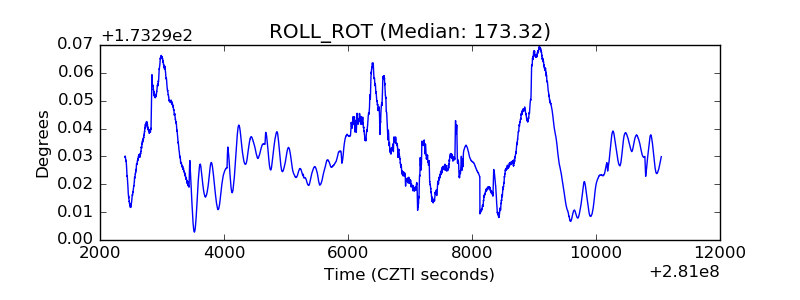 |
| _Roll_DEC | 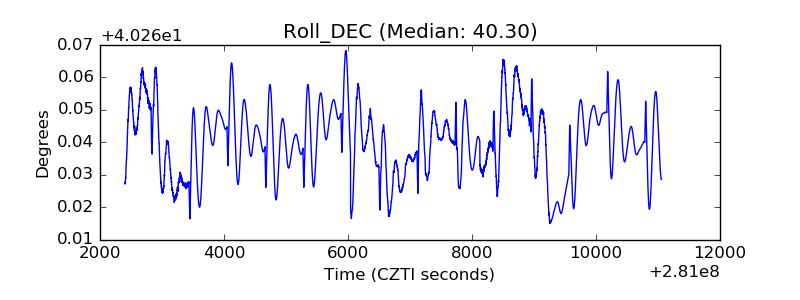 |
| _Roll_RA | 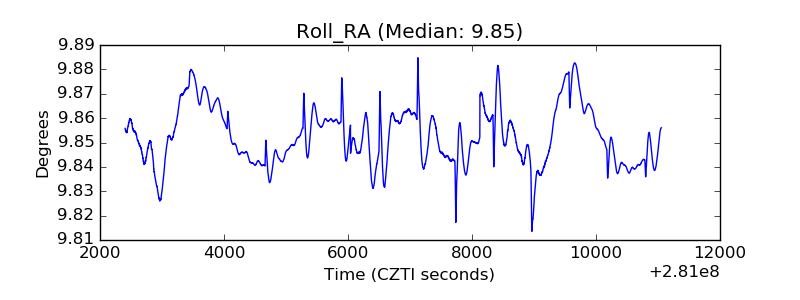 |
| Veto Counter | 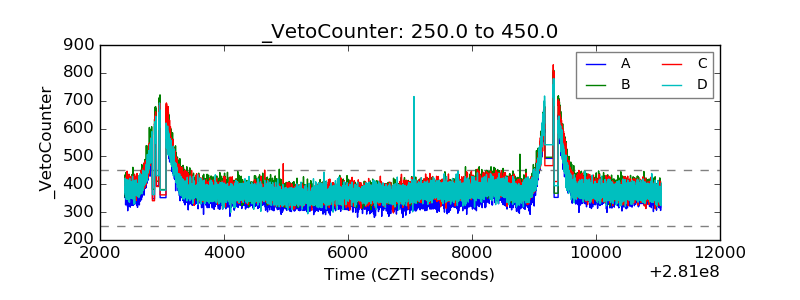 |