| Param | Original file | Final file |
|---|---|---|
| Filename | modeM0/AS1A05_004T03_9000002538_17117cztM0_level2.evt | modeM0/AS1A05_004T03_9000002538_17117cztM0_level2_quad_clean.evt |
| Size (bytes) | 630,964,800 | 120,795,840 |
| Size | 601.7 MB | 115.2 MB |
| Events in quadrant A | 4,342,120 | 767,498 |
| Events in quadrant B | 4,619,386 | 771,251 |
| Events in quadrant C | 4,941,225 | 738,450 |
| Events in quadrant D | 4,567,272 | 728,418 |
| Mode SS | |||
|---|---|---|---|
| Quadrant | BADHDUFLAG | Total packets | Discarded packets |
| A | 0 | 194 | 0 |
| B | 0 | 194 | 0 |
| C | 0 | 194 | 0 |
| D | 0 | 194 | 0 |
| Mode M0 | |||
|---|---|---|---|
| Quadrant | BADHDUFLAG | Total packets | Discarded packets |
| A | 0 | 19344 | 2 |
| B | 0 | 19873 | 2 |
| C | 0 | 20513 | 2 |
| D | 0 | 20182 | 2 |
| Mode M9 | |||
|---|---|---|---|
| Quadrant | BADHDUFLAG | Total packets | Discarded packets |
| A | 0 | 7 | 0 |
| B | 0 | 7 | 0 |
| C | 0 | 7 | 0 |
| D | 0 | 7 | 0 |
| Quadrant | Total seconds | Saturated seconds | Saturation percentage |
|---|---|---|---|
| A | 9412 | 209 | 2.220569% |
| B | 9412 | 228 | 2.422439% |
| C | 9412 | 306 | 3.251169% |
| D | 9412 | 148 | 1.572461% |
Noise dominated data is calculated using 1-second bins in cleaned event files. If a bin has >2000 counts, and if more than 50% of those come from <1% of pixels, then it is considered to be noise-dominated and hence unusable.
| Quadrant | # 1 sec bins | Bins with >0 counts | Bins with >2000 counts | High rate bins dominated by noise | Noise dominated (total time) | Noise dominated (detector-on time) | Marked lightcurve |
|---|---|---|---|---|---|---|---|
| A | 10052 | 9413 | 0 | 0 | 0.00% | 0.00% | 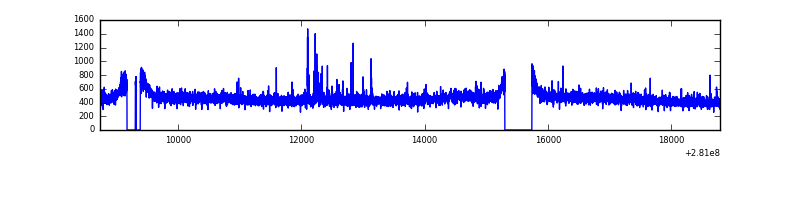 |
| B | 10052 | 9413 | 7 | 7 | 0.07% | 0.07% | 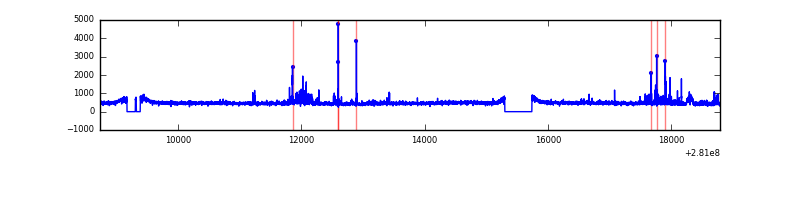 |
| C | 10052 | 9414 | 55 | 55 | 0.55% | 0.58% | 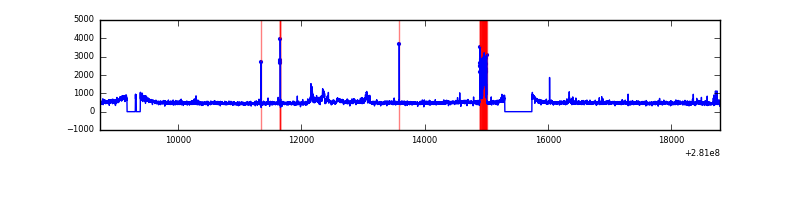 |
| D | 10052 | 9415 | 14 | 14 | 0.14% | 0.15% | 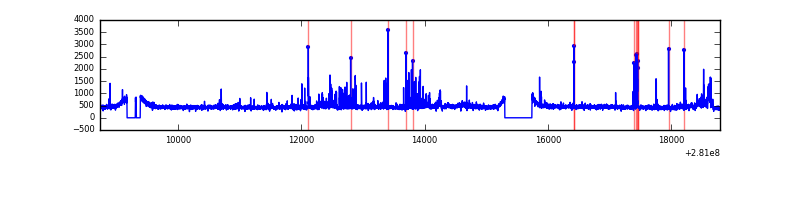 |
Top three noisy pixels from each quadrant. If the there are fewer than three noisy pixels in the level2.evt file, extra rows are filled as -1
| Pixel properties | Quadrant properties | ||||||
|---|---|---|---|---|---|---|---|
| Quadrant | DetID | PixID | Counts | Sigma | Mean | Median | Sigma |
| A | 4 | 2 | 61107 | 263.83 | 1112 | 1083 | 227.5 |
| A | 0 | 226 | 9833 | 38.46 | 1112 | 1083 | 227.5 |
| A | 12 | 194 | 8252 | 31.51 | 1112 | 1083 | 227.5 |
| B | 7 | 220 | 162709 | 762.47 | 1107 | 1076 | 212.0 |
| B | 15 | 35 | 33109 | 151.11 | 1107 | 1076 | 212.0 |
| B | 0 | 219 | 32573 | 148.58 | 1107 | 1076 | 212.0 |
| C | 3 | 233 | 428279 | 1722.94 | 1061 | 1066 | 248.0 |
| C | 14 | 238 | 163512 | 655.14 | 1061 | 1066 | 248.0 |
| C | 9 | 160 | 102194 | 407.85 | 1061 | 1066 | 248.0 |
| D | 5 | 222 | 253548 | 952.84 | 1085 | 1052 | 265.0 |
| D | 7 | 38 | 96612 | 360.61 | 1085 | 1052 | 265.0 |
| D | 10 | 70 | 66794 | 248.09 | 1085 | 1052 | 265.0 |
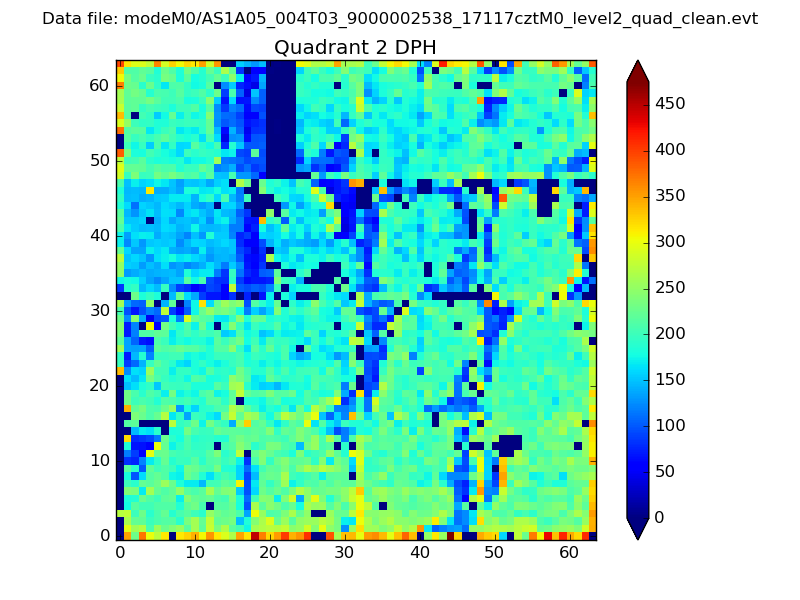
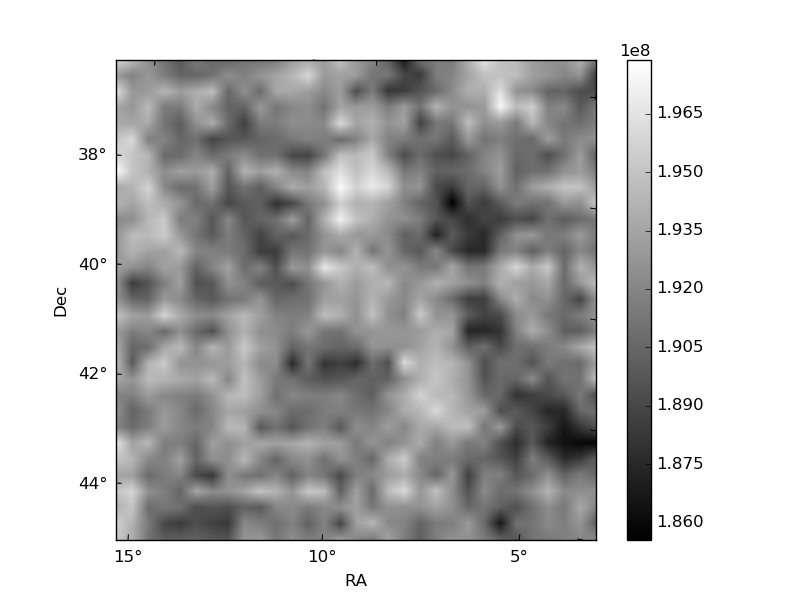
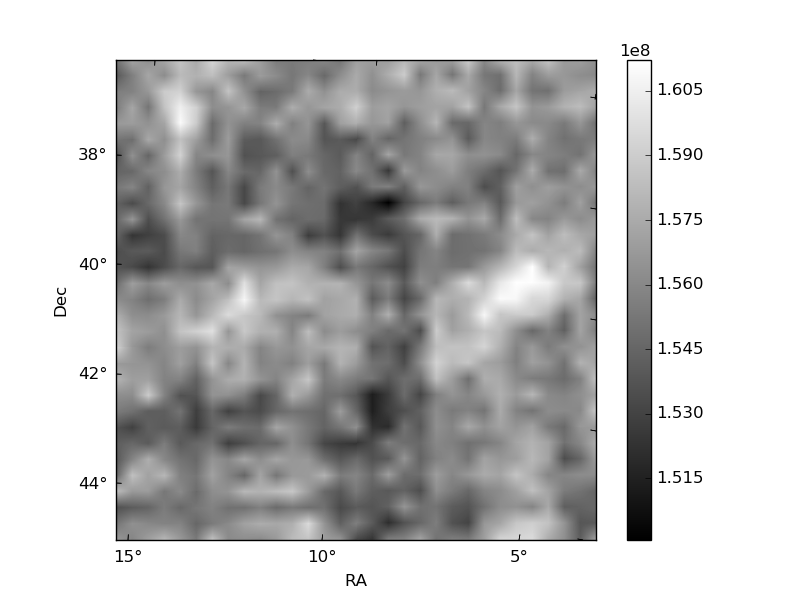
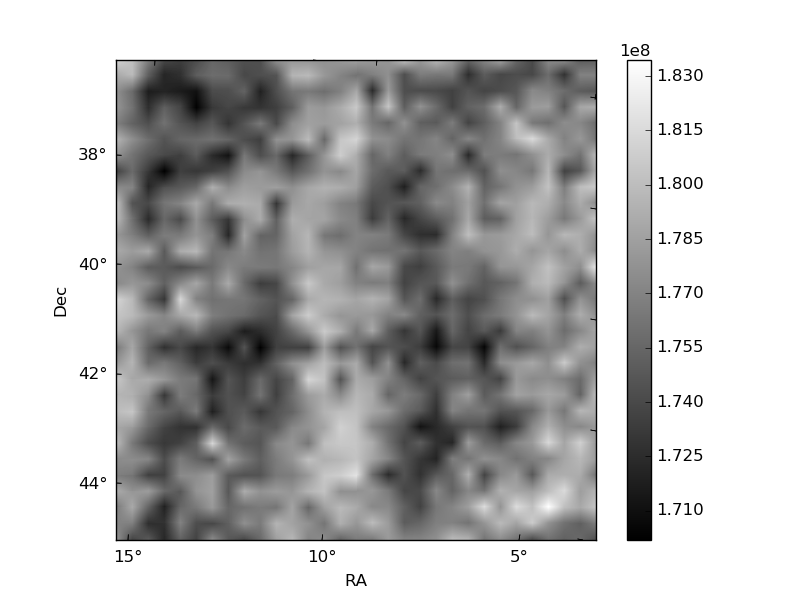
Histogram calculated using DETX and DETY for each event in the final _common_clean file
| Quadrant A | 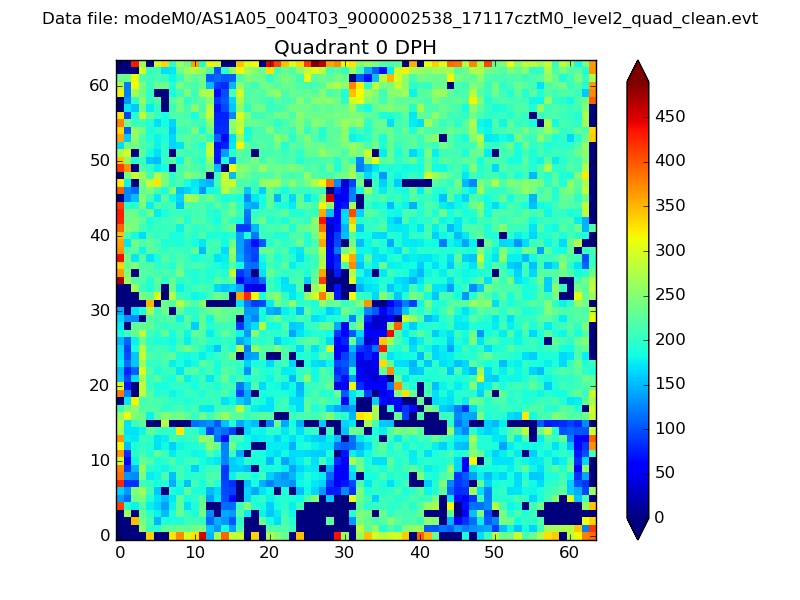 |
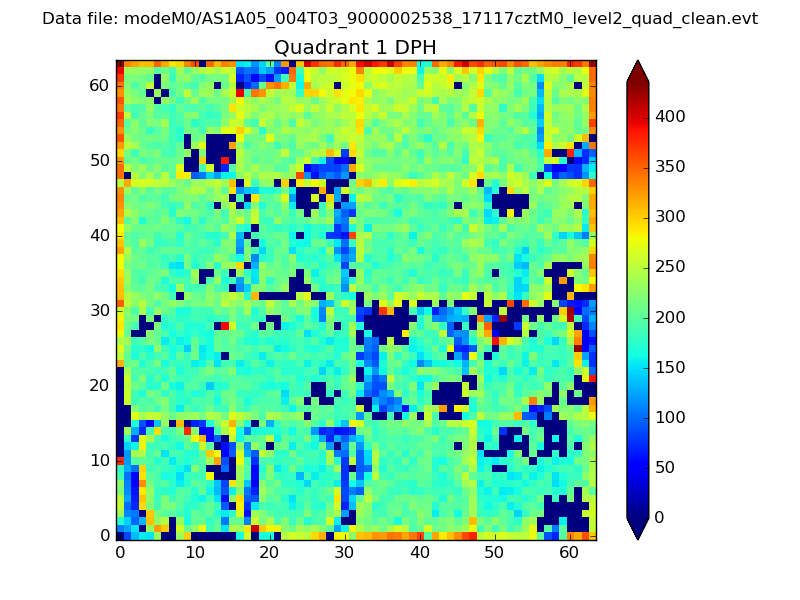 |
Quadrant B |
|---|---|---|---|
| Quadrant D | 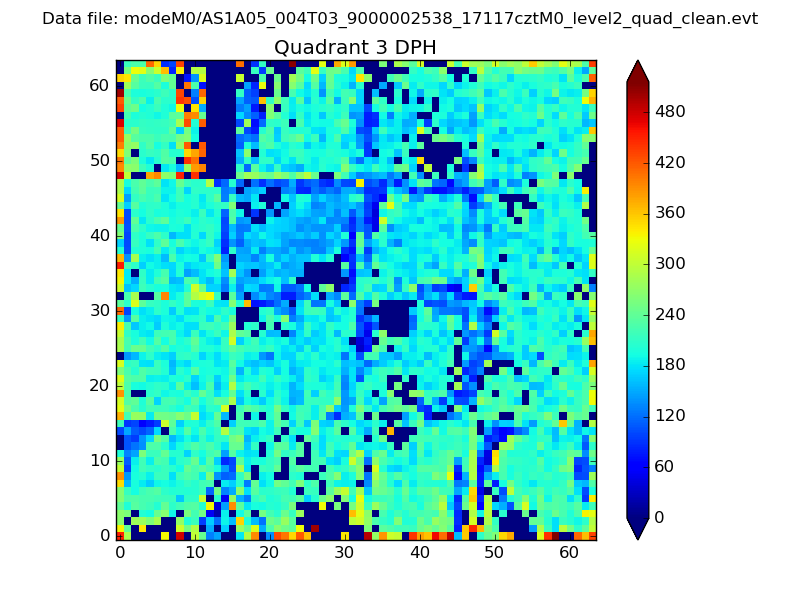 |
 |
Quadrant C |
| Plot type | Count rate plots | Images |
|---|---|---|
| Comparison with Poisson distribution Blue bars denote a histogram of data divided into 1 sec bins. Red curve is a Poisson curve with rate = median count rate of data. |
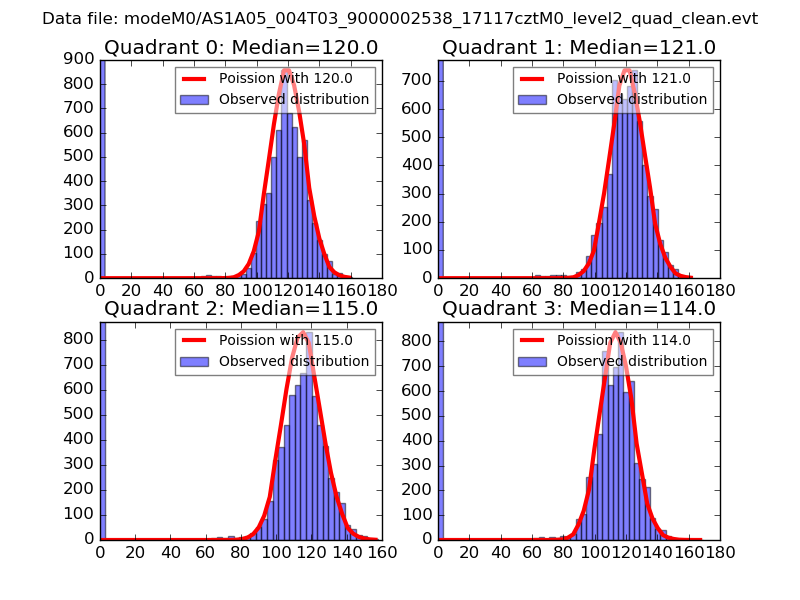 |
 |
| Quadrant-wise count rates Data is divided into 100 sec bins |
 |
|
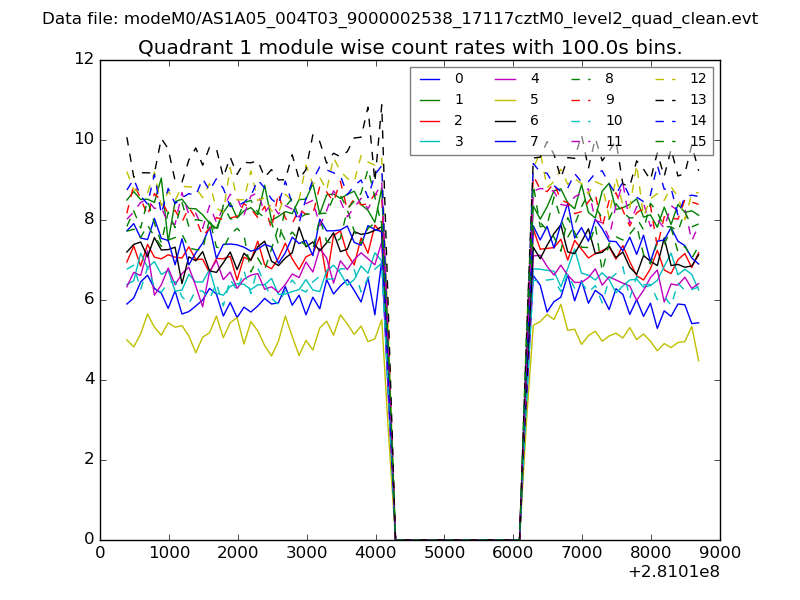
| Module-wise count rates for Quadrant A Data is divided into 100 sec bins |
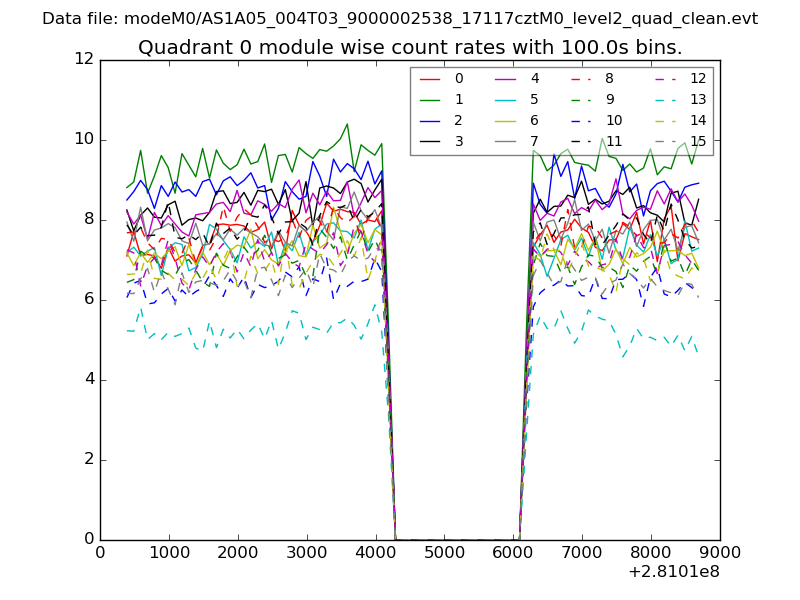 |
 |
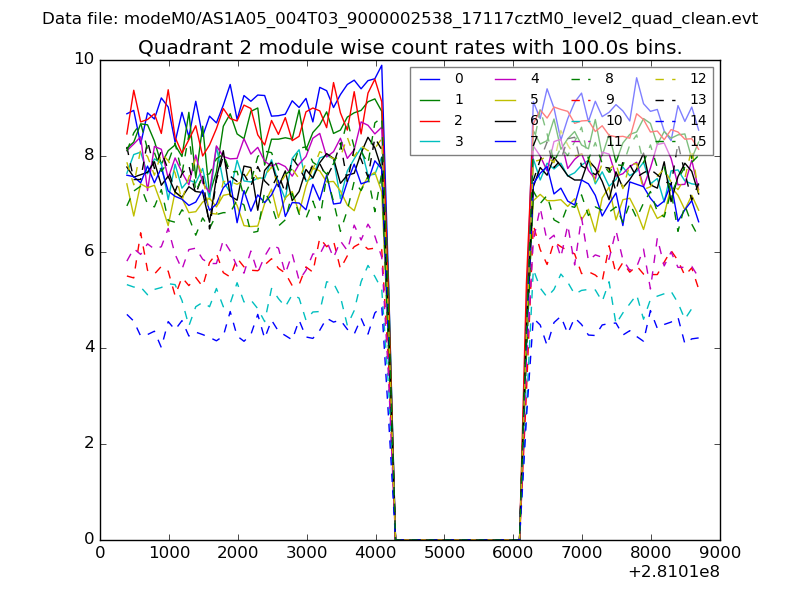
| Module-wise count rates for Quadrant B Data is divided into 100 sec bins |
 |
 |
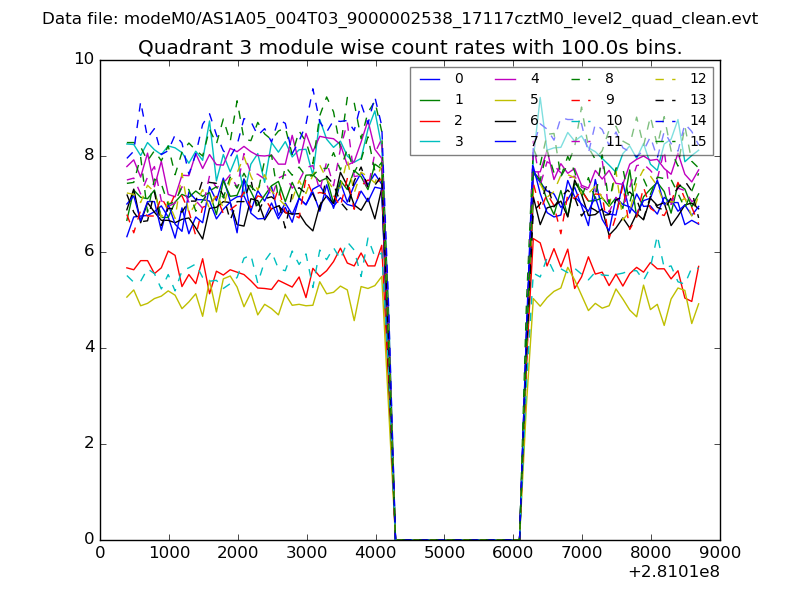
| Module-wise count rates for Quadrant C Data is divided into 100 sec bins |
 |
 |
| Module-wise count rates for Quadrant D Data is divided into 100 sec bins |
 |
 |
| Parameter | Plot |
|---|---|
| CZT HV Monitor | 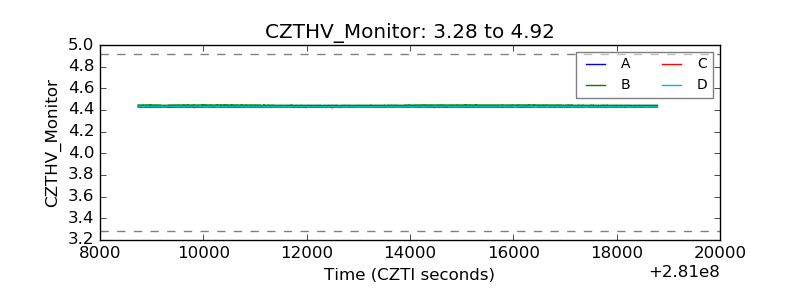 |
| D_VDD | 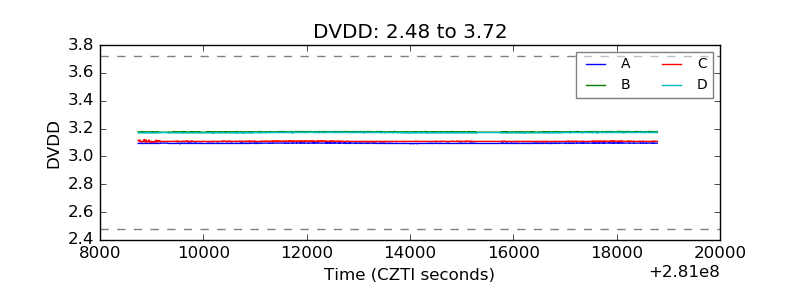 |
| Temperature 1 | 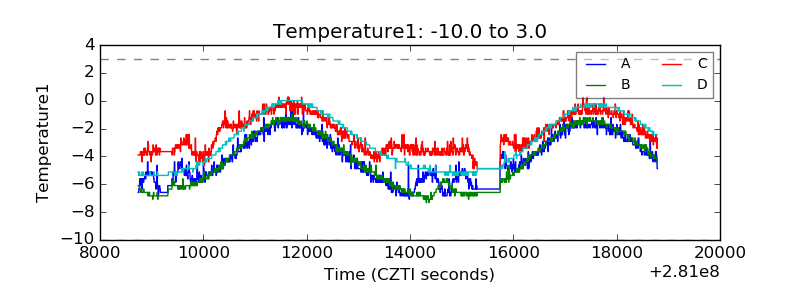 |
| Veto HV Monitor | 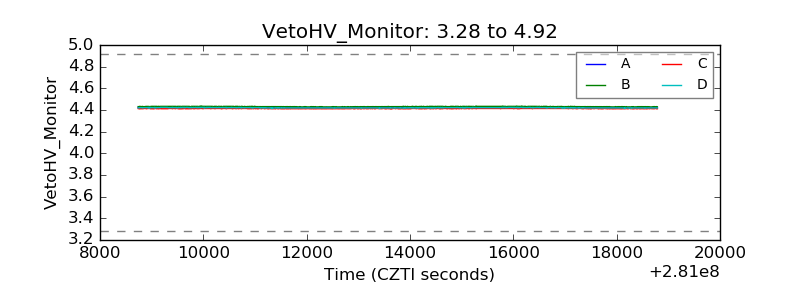 |
| Veto LLD | 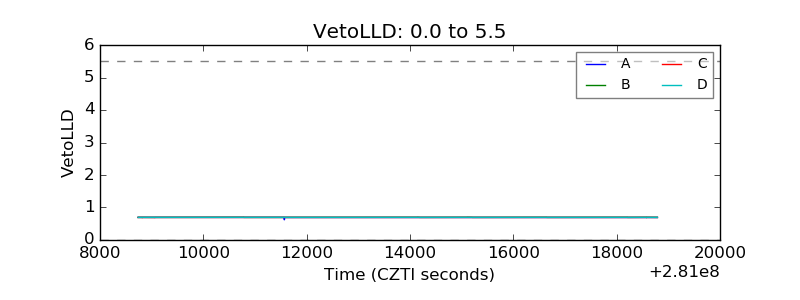 |
| Alpha Counter | 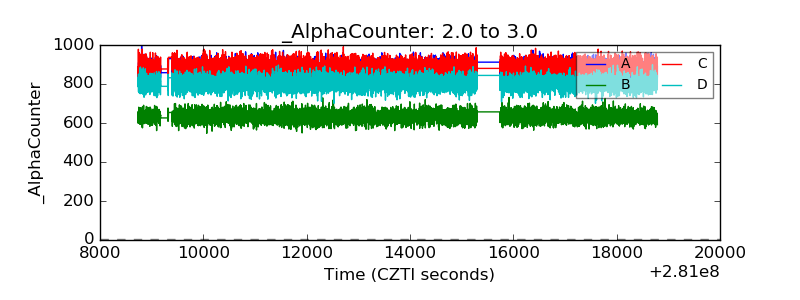 |
| _CPM_Rate |  |
| CZT Counter | 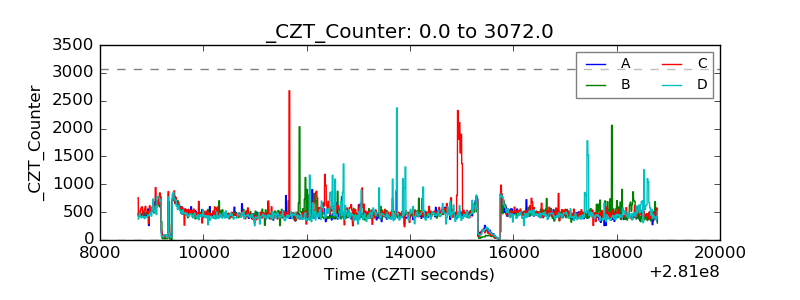 |
| +2.5 Volts monitor |  |
| +5 Volts monitor |  |
| _ROLL_ROT | 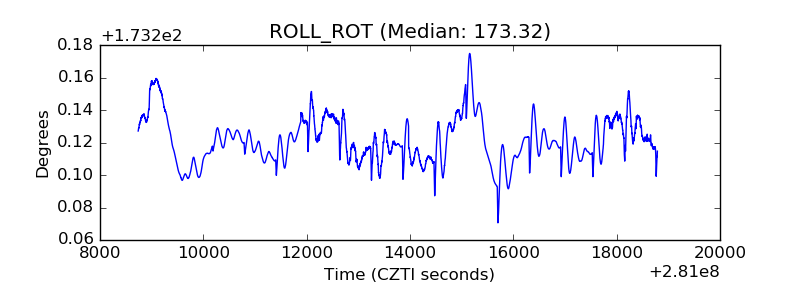 |
| _Roll_DEC | 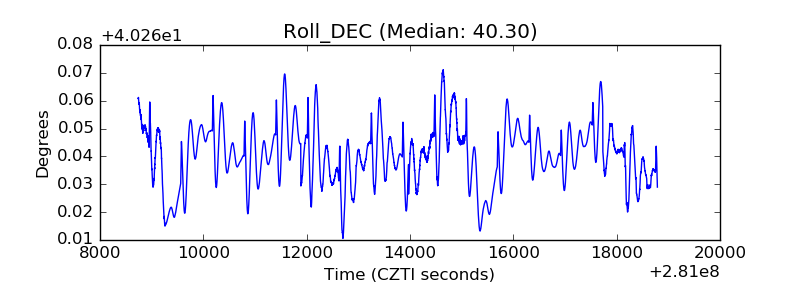 |
| _Roll_RA | 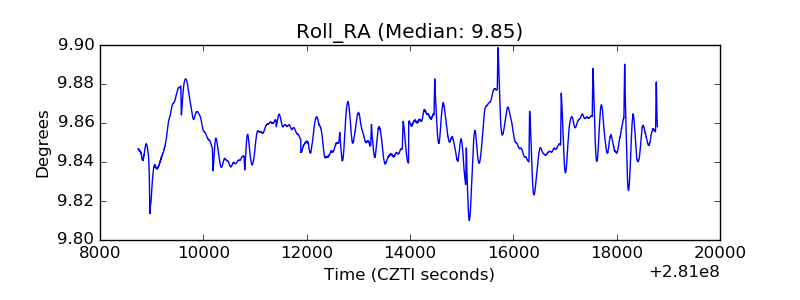 |
| Veto Counter | 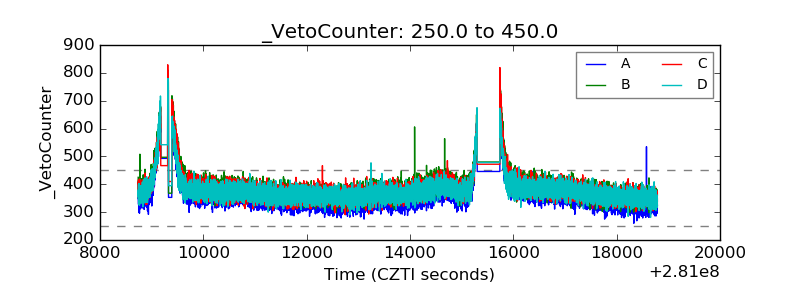 |