| Param | Original file | Final file |
|---|---|---|
| Filename | modeM0/AS1A05_004T03_9000002538_17118cztM0_level2.evt | modeM0/AS1A05_004T03_9000002538_17118cztM0_level2_quad_clean.evt |
| Size (bytes) | 490,072,320 | 109,163,520 |
| Size | 467.4 MB | 104.1 MB |
| Events in quadrant A | 3,266,113 | 715,589 |
| Events in quadrant B | 3,574,885 | 714,382 |
| Events in quadrant C | 3,804,978 | 685,411 |
| Events in quadrant D | 3,696,044 | 678,792 |
| Mode SS | |||
|---|---|---|---|
| Quadrant | BADHDUFLAG | Total packets | Discarded packets |
| A | 0 | 148 | 0 |
| B | 0 | 148 | 0 |
| C | 0 | 148 | 0 |
| D | 0 | 148 | 0 |
| Mode M0 | |||
|---|---|---|---|
| Quadrant | BADHDUFLAG | Total packets | Discarded packets |
| A | 0 | 14953 | 1 |
| B | 0 | 15474 | 1 |
| C | 0 | 15873 | 1 |
| D | 0 | 16113 | 1 |
| Mode M9 | |||
|---|---|---|---|
| Quadrant | BADHDUFLAG | Total packets | Discarded packets |
| A | 0 | 6 | 0 |
| B | 0 | 6 | 0 |
| C | 0 | 6 | 0 |
| D | 0 | 6 | 0 |
| Quadrant | Total seconds | Saturated seconds | Saturation percentage |
|---|---|---|---|
| A | 7359 | 102 | 1.386058% |
| B | 7360 | 102 | 1.385870% |
| C | 7360 | 133 | 1.807065% |
| D | 7360 | 97 | 1.317935% |
Noise dominated data is calculated using 1-second bins in cleaned event files. If a bin has >2000 counts, and if more than 50% of those come from <1% of pixels, then it is considered to be noise-dominated and hence unusable.
| Quadrant | # 1 sec bins | Bins with >0 counts | Bins with >2000 counts | High rate bins dominated by noise | Noise dominated (total time) | Noise dominated (detector-on time) | Marked lightcurve |
|---|---|---|---|---|---|---|---|
| A | 7924 | 7360 | 0 | 0 | 0.00% | 0.00% | 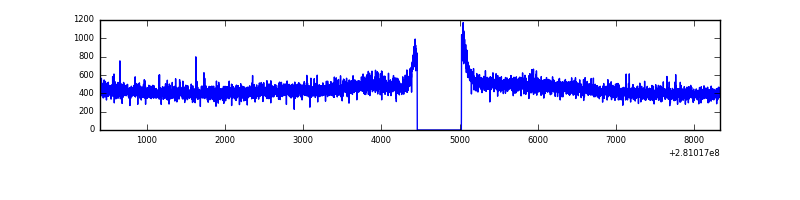 |
| B | 7925 | 7360 | 9 | 9 | 0.11% | 0.12% | 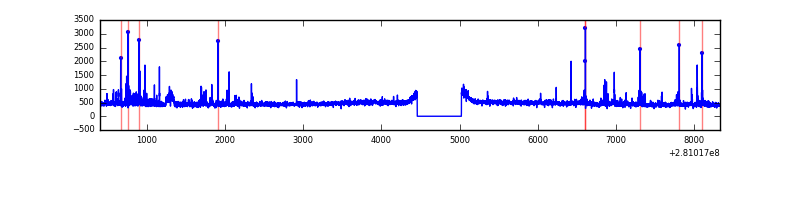 |
| C | 7925 | 7361 | 0 | 0 | 0.00% | 0.00% | 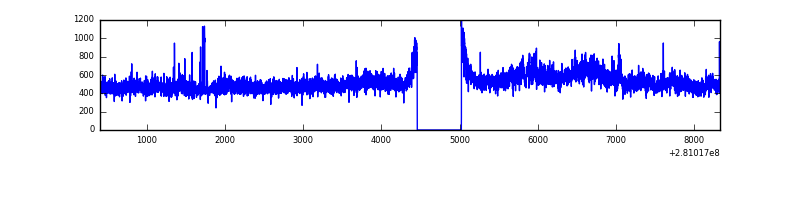 |
| D | 7925 | 7360 | 17 | 17 | 0.21% | 0.23% | 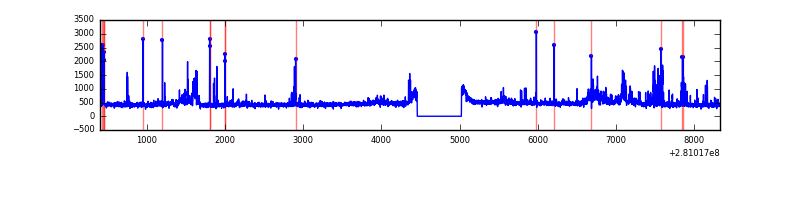 |
Top three noisy pixels from each quadrant. If the there are fewer than three noisy pixels in the level2.evt file, extra rows are filled as -1
| Pixel properties | Quadrant properties | ||||||
|---|---|---|---|---|---|---|---|
| Quadrant | DetID | PixID | Counts | Sigma | Mean | Median | Sigma |
| A | 0 | 226 | 7577 | 38.63 | 850 | 826 | 174.7 |
| A | 12 | 194 | 6270 | 31.15 | 850 | 826 | 174.7 |
| A | 3 | 137 | 6032 | 29.79 | 850 | 826 | 174.7 |
| B | 7 | 220 | 76861 | 465.29 | 844 | 819 | 163.4 |
| B | 0 | 197 | 74738 | 452.3 | 844 | 819 | 163.4 |
| B | 15 | 35 | 31034 | 184.88 | 844 | 819 | 163.4 |
| C | 3 | 233 | 502706 | 2637.96 | 813 | 817 | 190.3 |
| C | 14 | 238 | 123510 | 644.88 | 813 | 817 | 190.3 |
| C | 13 | 61 | 5865 | 26.53 | 813 | 817 | 190.3 |
| D | 5 | 222 | 144336 | 707.49 | 830 | 804 | 202.9 |
| D | 7 | 38 | 140241 | 687.3 | 830 | 804 | 202.9 |
| D | 1 | 52 | 126753 | 620.82 | 830 | 804 | 202.9 |
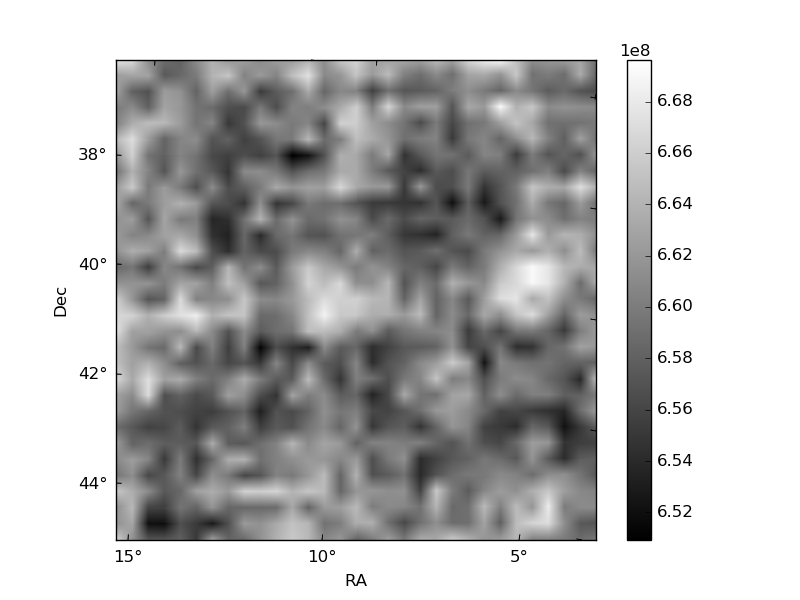
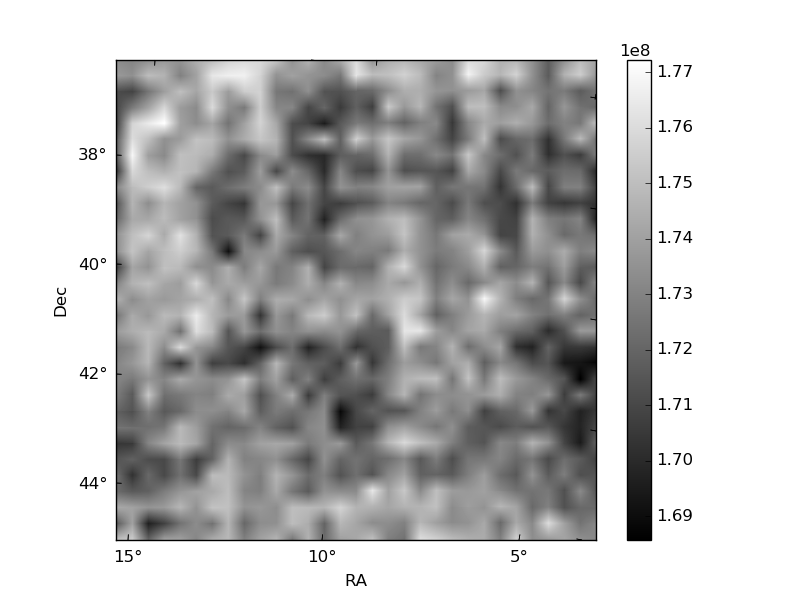
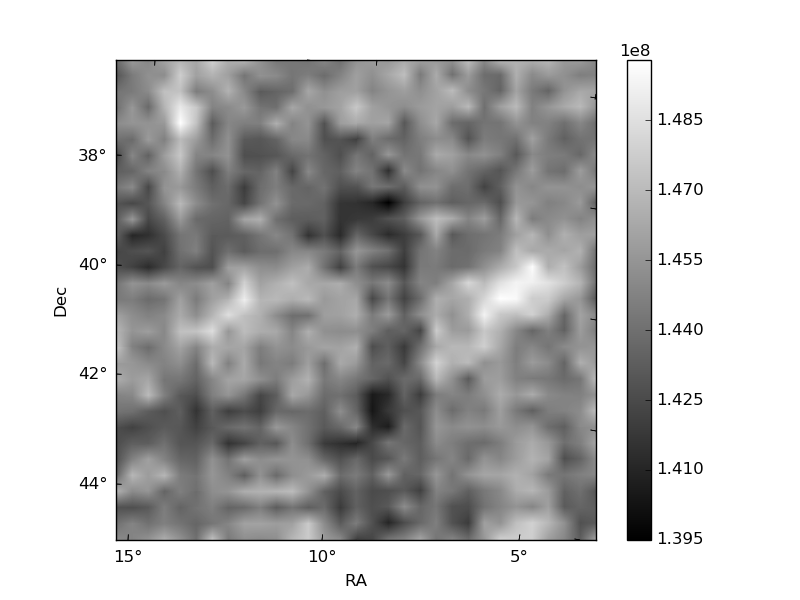
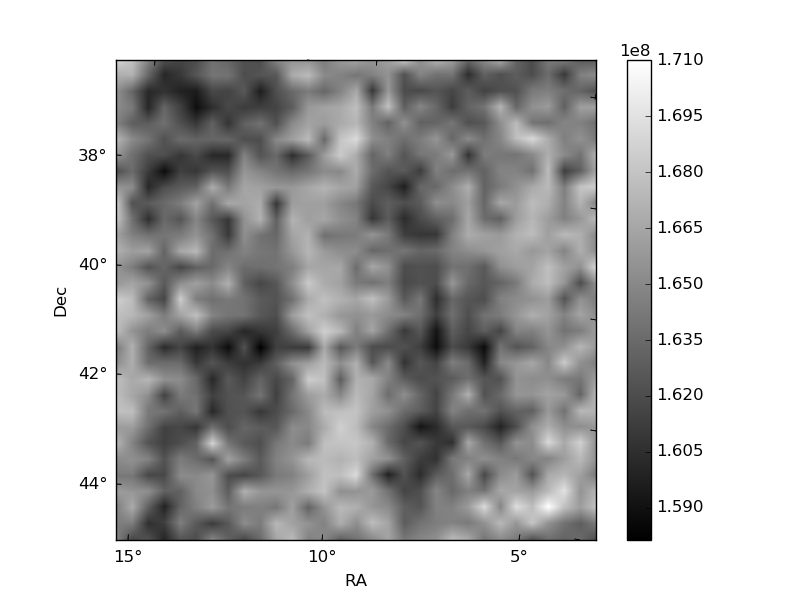
Histogram calculated using DETX and DETY for each event in the final _common_clean file
| Quadrant A | 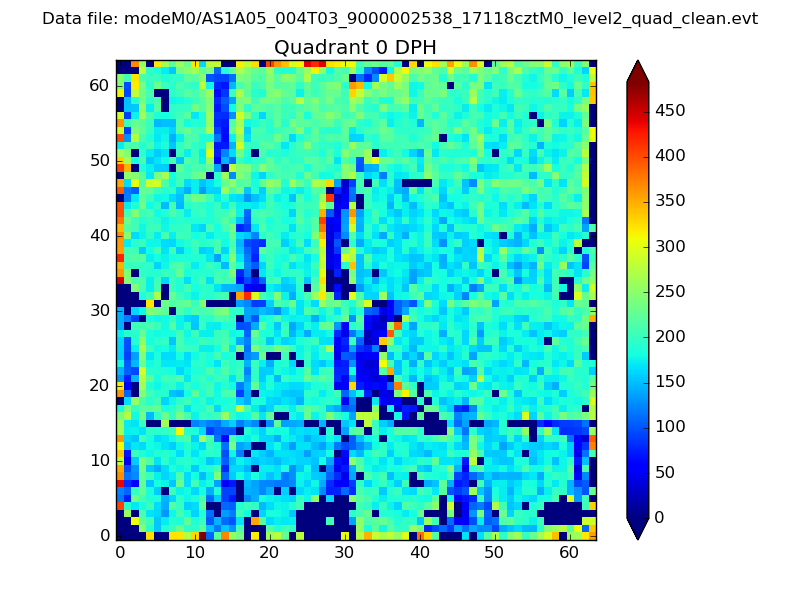 |
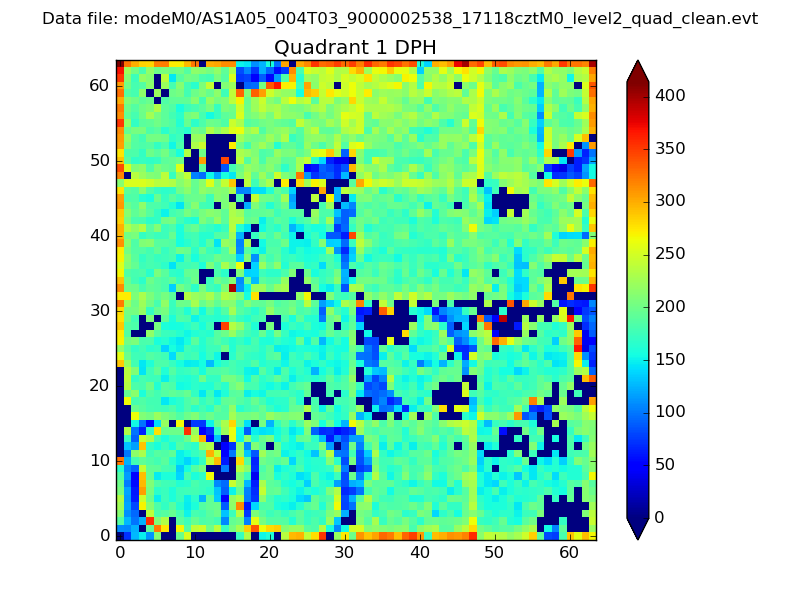 |
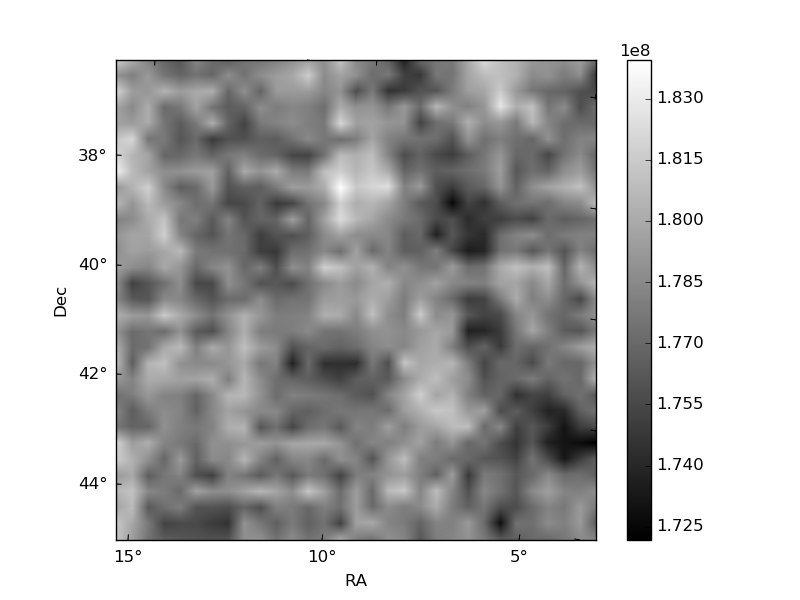
Quadrant B |
|---|---|---|---|
| Quadrant D | 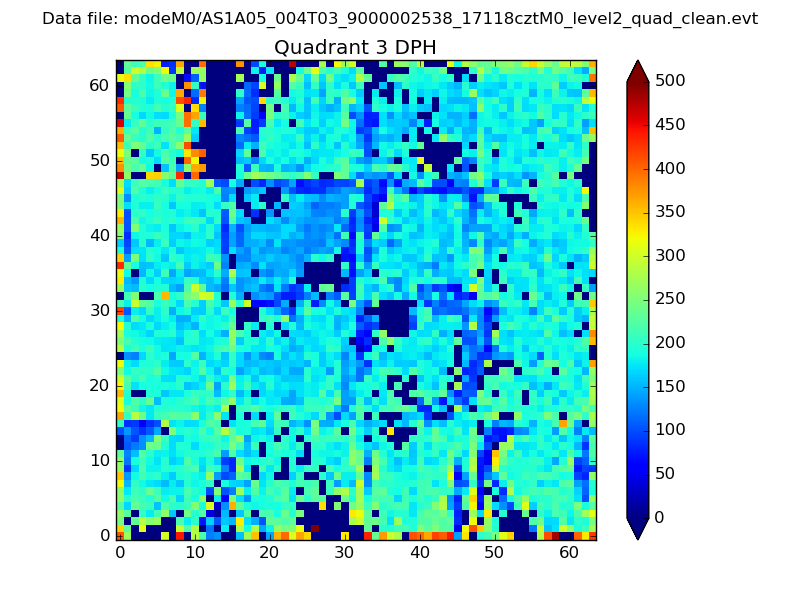 |
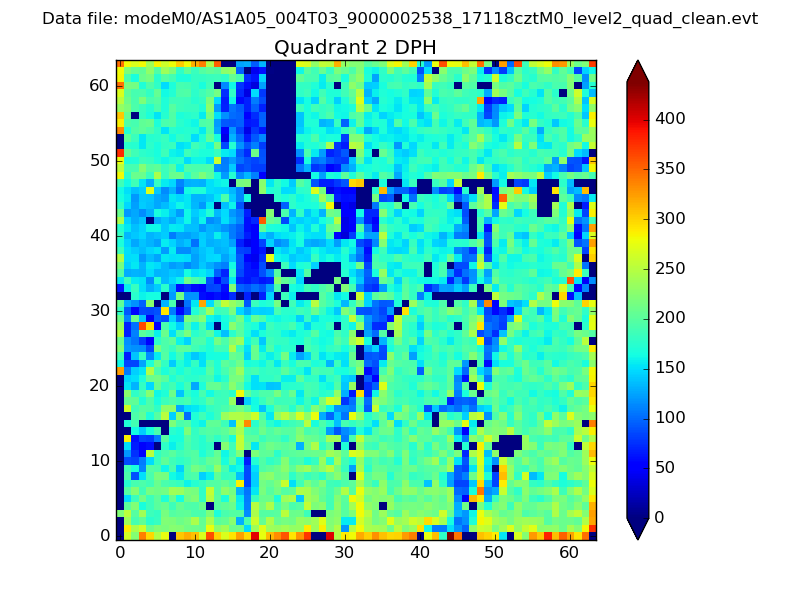 |
Quadrant C |
| Plot type | Count rate plots | Images |
|---|---|---|
| Comparison with Poisson distribution Blue bars denote a histogram of data divided into 1 sec bins. Red curve is a Poisson curve with rate = median count rate of data. |
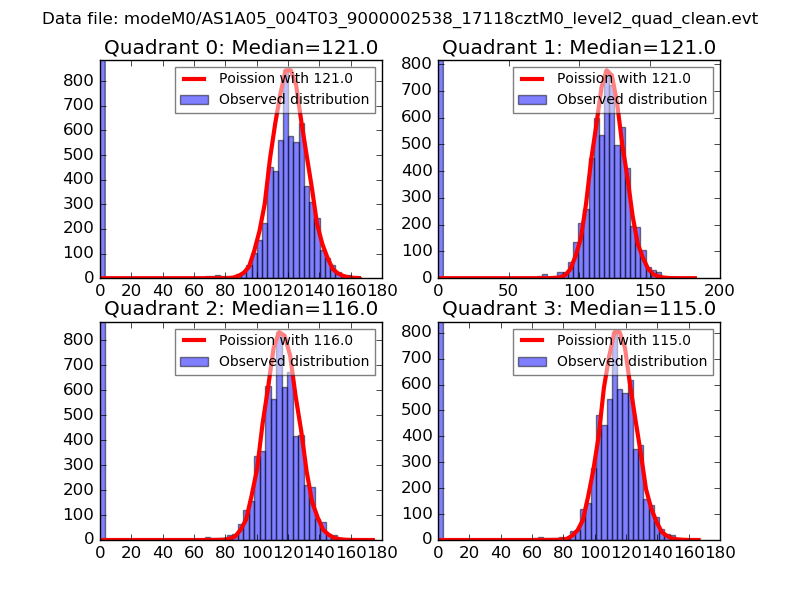 |
 |
| Quadrant-wise count rates Data is divided into 100 sec bins |
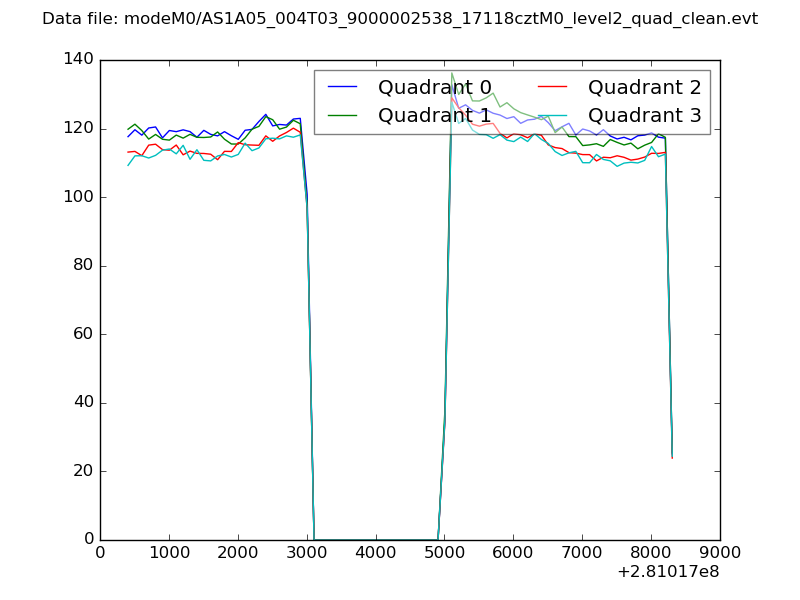 |
|
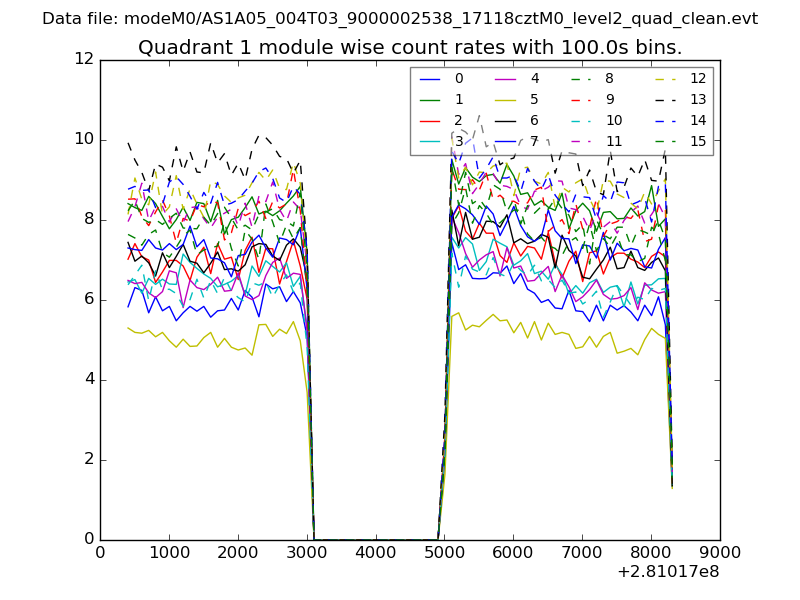
| Module-wise count rates for Quadrant A Data is divided into 100 sec bins |
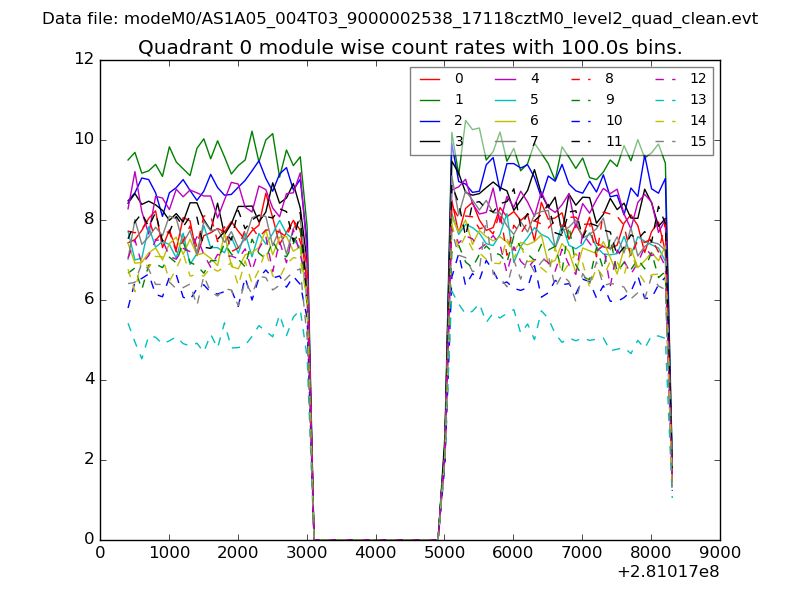 |
 |
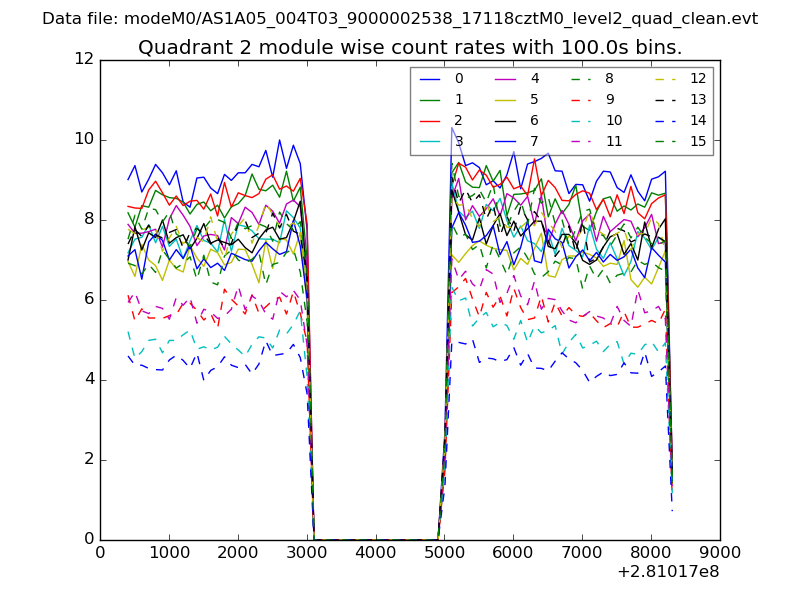
| Module-wise count rates for Quadrant B Data is divided into 100 sec bins |
 |
 |
| Module-wise count rates for Quadrant C Data is divided into 100 sec bins |
 |
 |
| Module-wise count rates for Quadrant D Data is divided into 100 sec bins |
 |
 |
| Parameter | Plot |
|---|---|
| CZT HV Monitor | 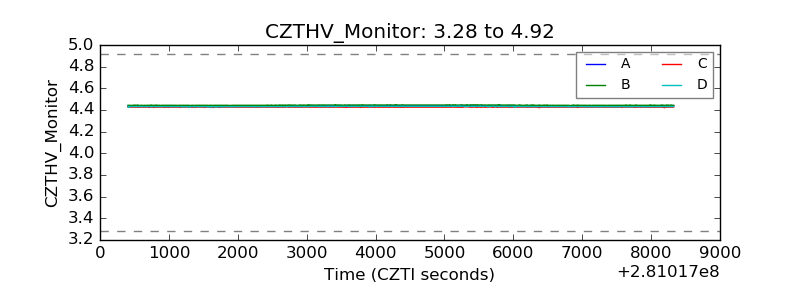 |
| D_VDD | 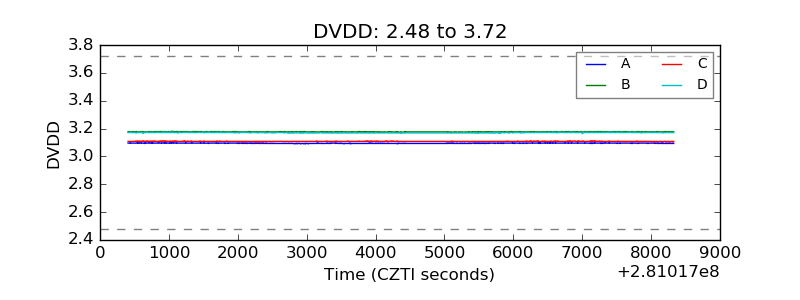 |
| Temperature 1 | 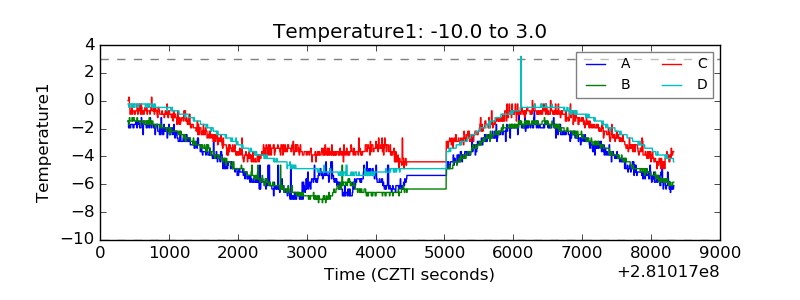 |
| Veto HV Monitor | 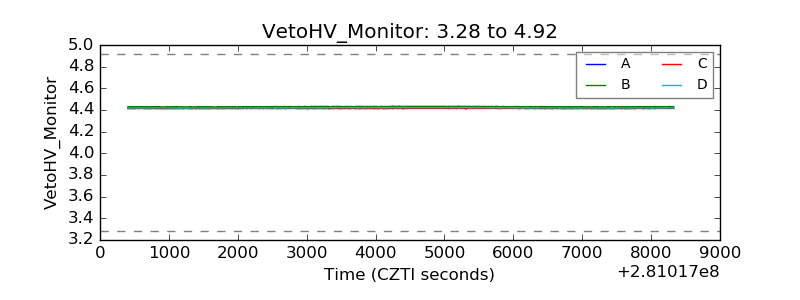 |
| Veto LLD | 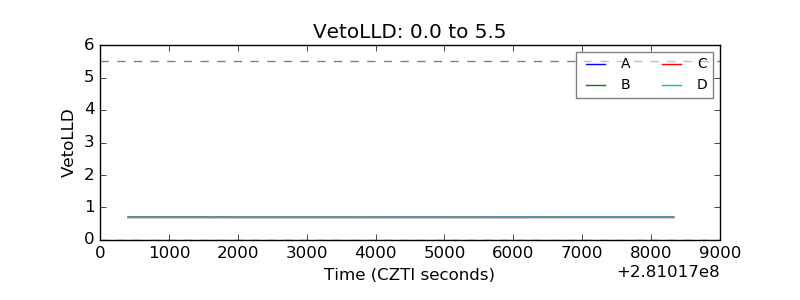 |
| Alpha Counter | 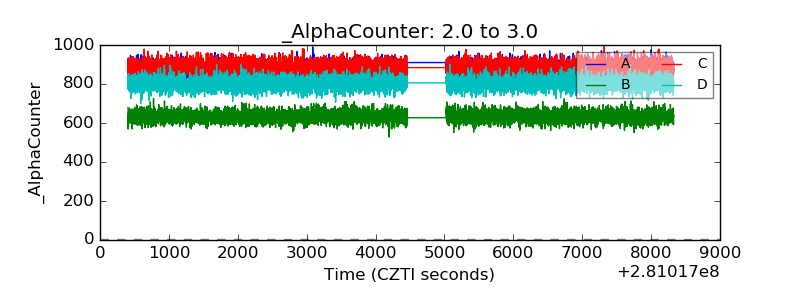 |
| _CPM_Rate | 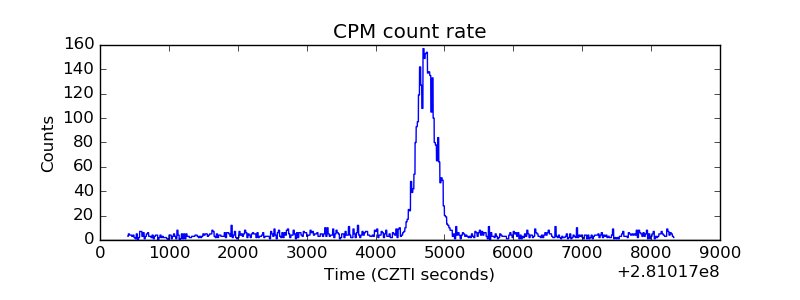 |
| CZT Counter | 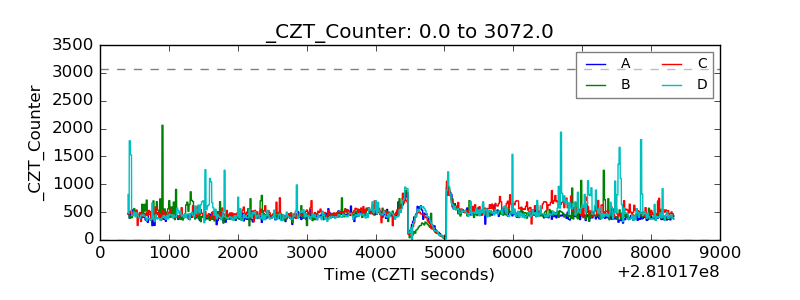 |
| +2.5 Volts monitor |  |
| +5 Volts monitor |  |
| _ROLL_ROT |  |
| _Roll_DEC | 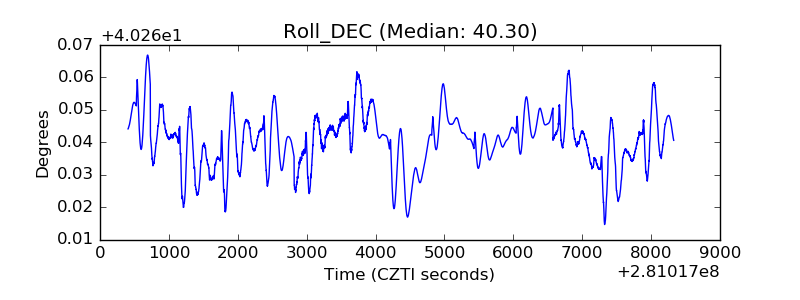 |
| _Roll_RA | 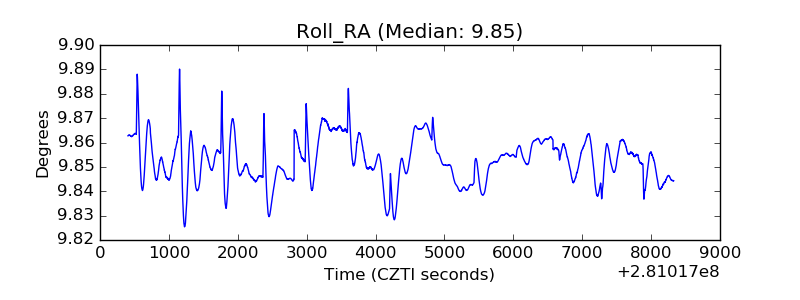 |
| Veto Counter |  |