| Param | Original file | Final file |
|---|---|---|
| Filename | modeM0/AS1A05_056T01_9000002540cztM0_level2.fits | modeM0/AS1A05_056T01_9000002540cztM0_level2_quad_clean.evt |
| Size (bytes) | 999,002,880 | 793,952,640 |
| Size | 952.7 MB | 757.2 MB |
| Events in quadrant A | 6,138,806 | 4,487,779 |
| Events in quadrant B | 5,984,026 | 4,514,328 |
| Events in quadrant C | 5,915,752 | 4,144,192 |
| Events in quadrant D | 5,216,970 | 3,898,943 |
| Mode M0 | |||
|---|---|---|---|
| Quadrant | BADHDUFLAG | Total packets | Discarded packets |
| A | 0 | 213409 | 0 |
| B | 0 | 212500 | 0 |
| C | 0 | 277779 | 0 |
| D | 0 | 234695 | 0 |
| Mode M9 | |||
|---|---|---|---|
| Quadrant | BADHDUFLAG | Total packets | Discarded packets |
| A | 0 | 186 | 0 |
| B | 0 | 186 | 0 |
| C | 0 | 186 | 0 |
| D | 0 | 186 | 0 |
| Mode SS | |||
|---|---|---|---|
| Quadrant | BADHDUFLAG | Total packets | Discarded packets |
| A | 0 | 2082 | 0 |
| B | 0 | 2082 | 0 |
| C | 0 | 2082 | 0 |
| D | 0 | 2082 | 0 |
| Quadrant | Total seconds | Saturated seconds | Saturation percentage |
|---|---|---|---|
| A | 102102 | 1369 | 1.340816% |
| B | 102102 | 1516 | 1.484790% |
| C | 102102 | 3824 | 3.745274% |
| D | 102102 | 2867 | 2.807976% |
Noise dominated data is calculated using 1-second bins in cleaned event files. If a bin has >2000 counts, and if more than 50% of those come from <1% of pixels, then it is considered to be noise-dominated and hence unusable.
| Quadrant | # 1 sec bins | Bins with >0 counts | Bins with >2000 counts | High rate bins dominated by noise | Noise dominated (total time) | Noise dominated (detector-on time) | Marked lightcurve |
|---|---|---|---|---|---|---|---|
| A | 119643 | 102097 | 0 | 0 | 0.00% | 0.00% | 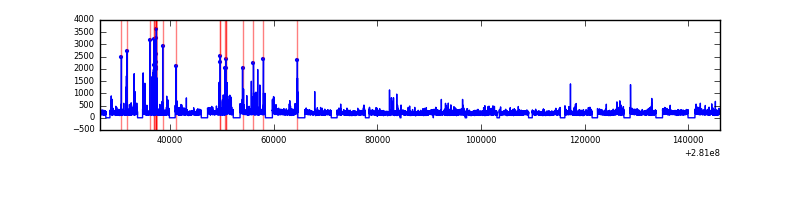 |
| B | 119643 | 102098 | 0 | 0 | 0.00% | 0.00% | 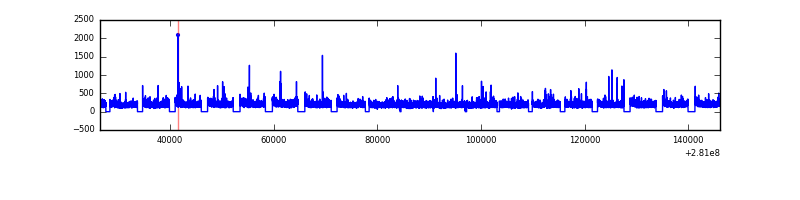 |
| C | 119642 | 102092 | 0 | 0 | 0.00% | 0.00% |  |
| D | 119643 | 102097 | 0 | 0 | 0.00% | 0.00% | 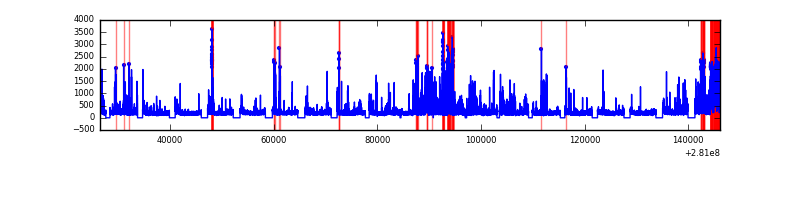 |
Top three noisy pixels from each quadrant. If the there are fewer than three noisy pixels in the level2.evt file, extra rows are filled as -1
| Pixel properties | Quadrant properties | ||||||
|---|---|---|---|---|---|---|---|
| Quadrant | DetID | PixID | Counts | Sigma | Mean | Median | Sigma |
| A | 0 | 29 | 5779 | 10.79 | 1594 | 1490 | 397.4 |
| A | 7 | 110 | 4919 | 8.63 | 1594 | 1490 | 397.4 |
| A | 0 | 30 | 4568 | 7.74 | 1594 | 1490 | 397.4 |
| B | 2 | 9 | 4798 | 10.5 | 1577 | 1500 | 314.2 |
| B | 2 | 8 | 4104 | 8.29 | 1577 | 1500 | 314.2 |
| B | 3 | 17 | 3932 | 7.74 | 1577 | 1500 | 314.2 |
| C | 12 | 241 | 4194 | 6.74 | 1565 | 1457 | 405.8 |
| C | 2 | 191 | 3935 | 6.11 | 1565 | 1457 | 405.8 |
| C | 9 | 242 | 3916 | 6.06 | 1565 | 1457 | 405.8 |
| D | 3 | 14 | 3928 | 6.52 | 1488 | 1353 | 394.8 |
| D | 6 | 231 | 3771 | 6.12 | 1488 | 1353 | 394.8 |
| D | 10 | 189 | 3678 | 5.89 | 1488 | 1353 | 394.8 |
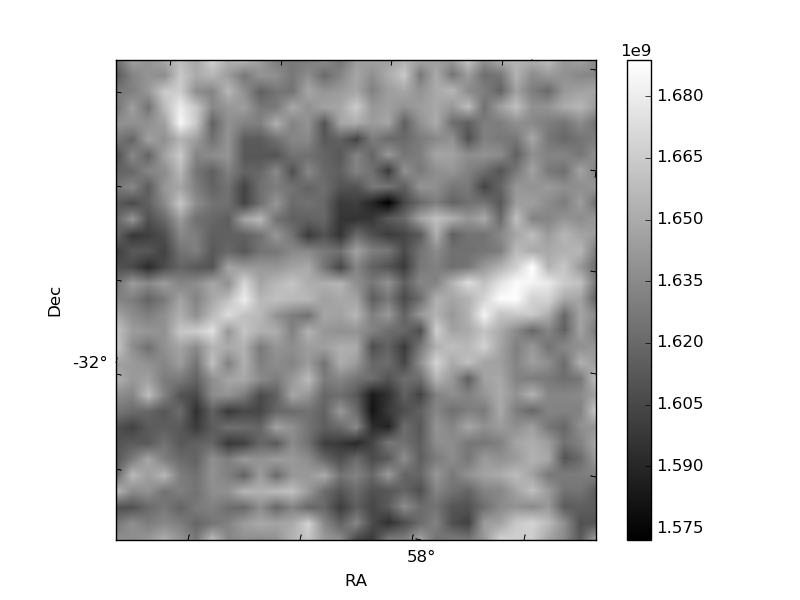
Histogram calculated using DETX and DETY for each event in the final _common_clean file
| Quadrant A | 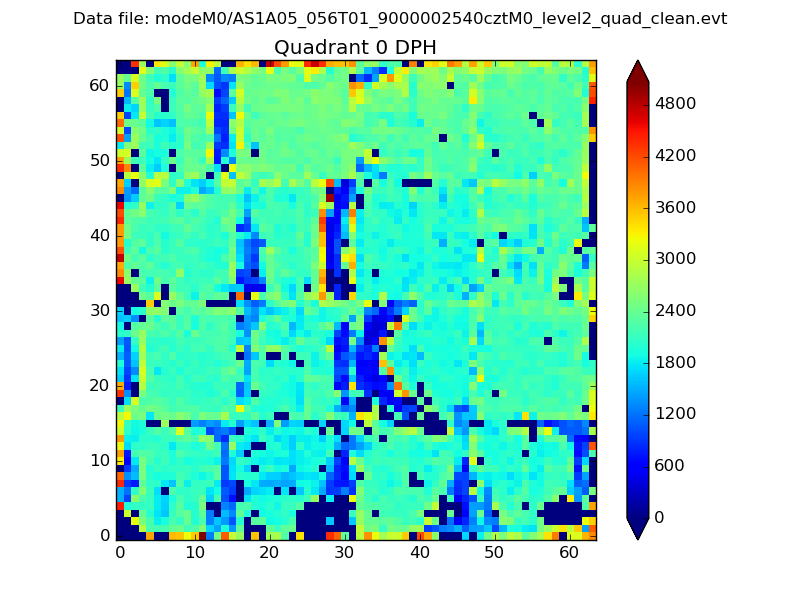 |
 |
Quadrant B |
|---|---|---|---|
| Quadrant D | 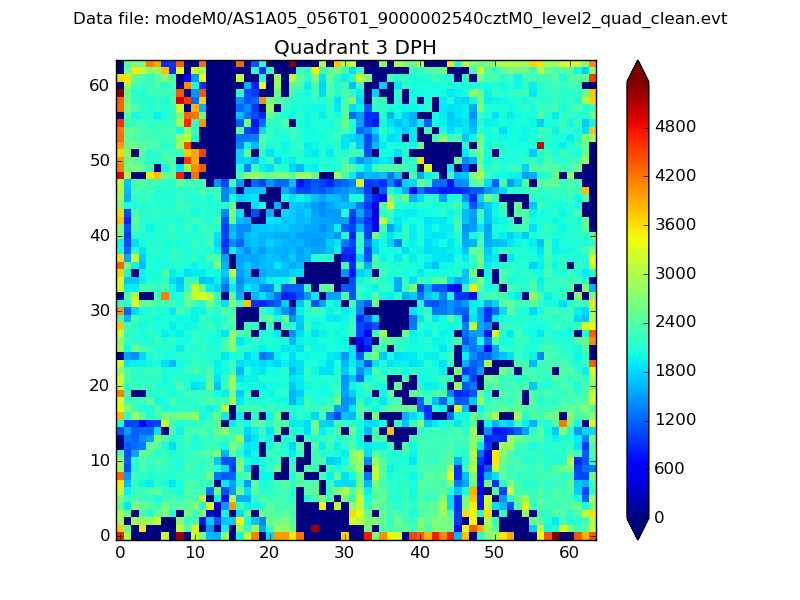 |
 |
Quadrant C |
| Plot type | Count rate plots | Images |
|---|---|---|
| Comparison with Poisson distribution Blue bars denote a histogram of data divided into 1 sec bins. Red curve is a Poisson curve with rate = median count rate of data. |
 |
 |
| Quadrant-wise count rates Data is divided into 100 sec bins |
 |
|
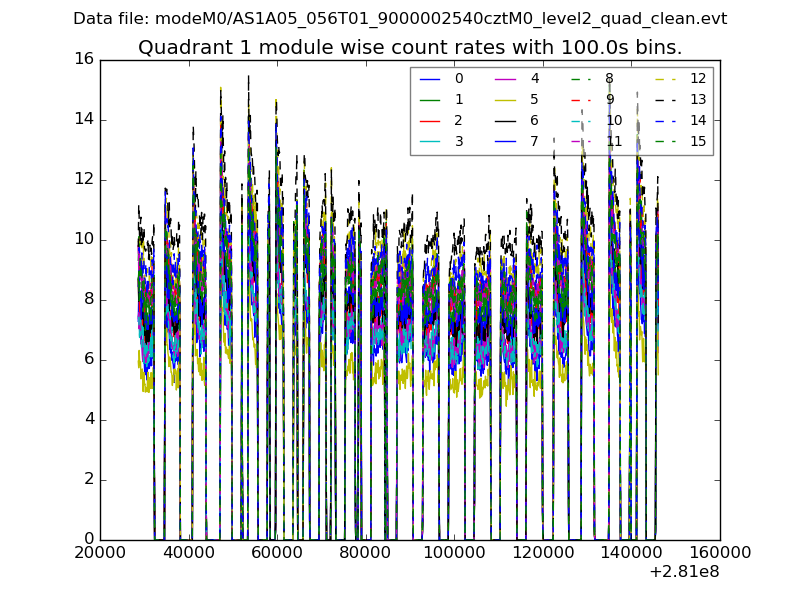
| Module-wise count rates for Quadrant A Data is divided into 100 sec bins |
 |
 |
| Module-wise count rates for Quadrant B Data is divided into 100 sec bins |
 |
 |
| Module-wise count rates for Quadrant C Data is divided into 100 sec bins |
 |
 |
| Module-wise count rates for Quadrant D Data is divided into 100 sec bins |
 |
 |
| Parameter | Plot |
|---|---|
| CZT HV Monitor | 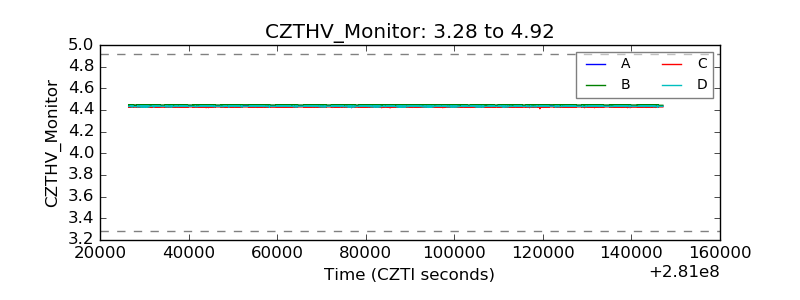 |
| D_VDD | 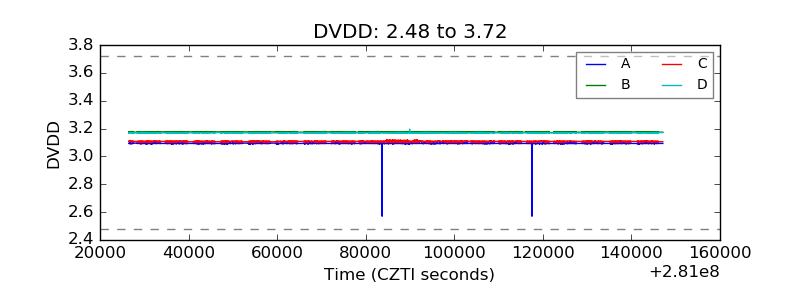 |
| Temperature 1 |  |
| Veto HV Monitor | 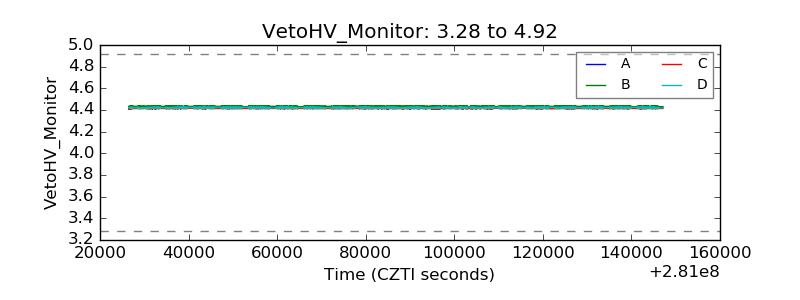 |
| Veto LLD | 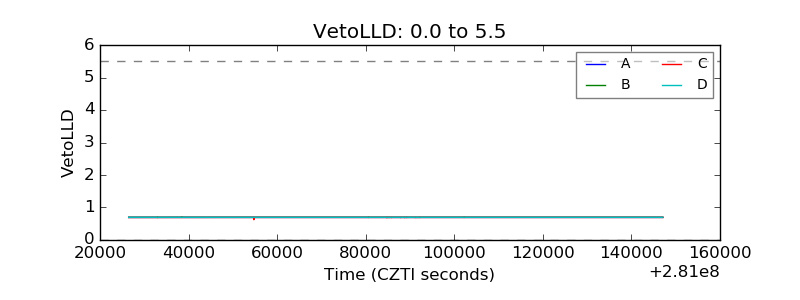 |
| Alpha Counter |  |
| _CPM_Rate |  |
| CZT Counter |  |
| +2.5 Volts monitor |  |
| +5 Volts monitor |  |
| _ROLL_ROT |  |
| _Roll_DEC |  |
| _Roll_RA |  |
| Veto Counter |  |